6. Sampling Distribution
1/11
There's no tags or description
Looks like no tags are added yet.
Name | Mastery | Learn | Test | Matching | Spaced |
|---|
No study sessions yet.
12 Terms
Sample Proportion Definition
The sample proportion (ˆp) represents the fraction of the sample that has a particular characteristic, used to estimate the population proportion. Derived from categorical data.
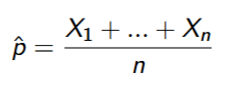
Sample Proportion Formula
The number of successes in the sample divided by the total number of observations in the sample.
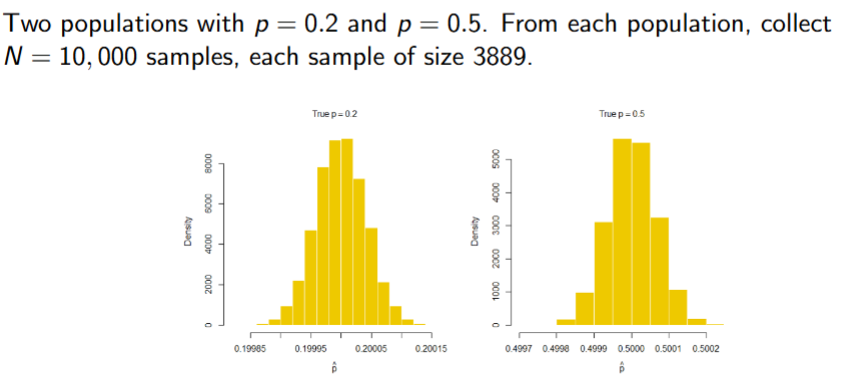
Sample Proportion Distribution
If np(1-p) >= 5, distribution of sample proportion is approzimated by N(p, (p(1 - p)) / n).
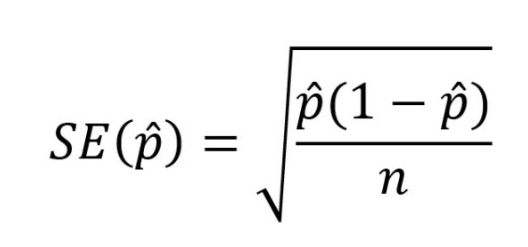
Standard Error of ˆp Formula
The standard deviation of the sampling distribution of a sample proportion. It measures how much the sample proportion is expected to vary from the true population proportion.
When does the Standard Error increase?
Sample size decreases
P increases (Usually cant be changed)
Sample Mean
The sample mean (X̄) is the average of all observations in a sample. Derived from quantitative data.
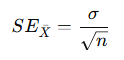
Formula for Standard Error of Sample Mean
σ = population standard deviation
\sqrt{n}= sample size
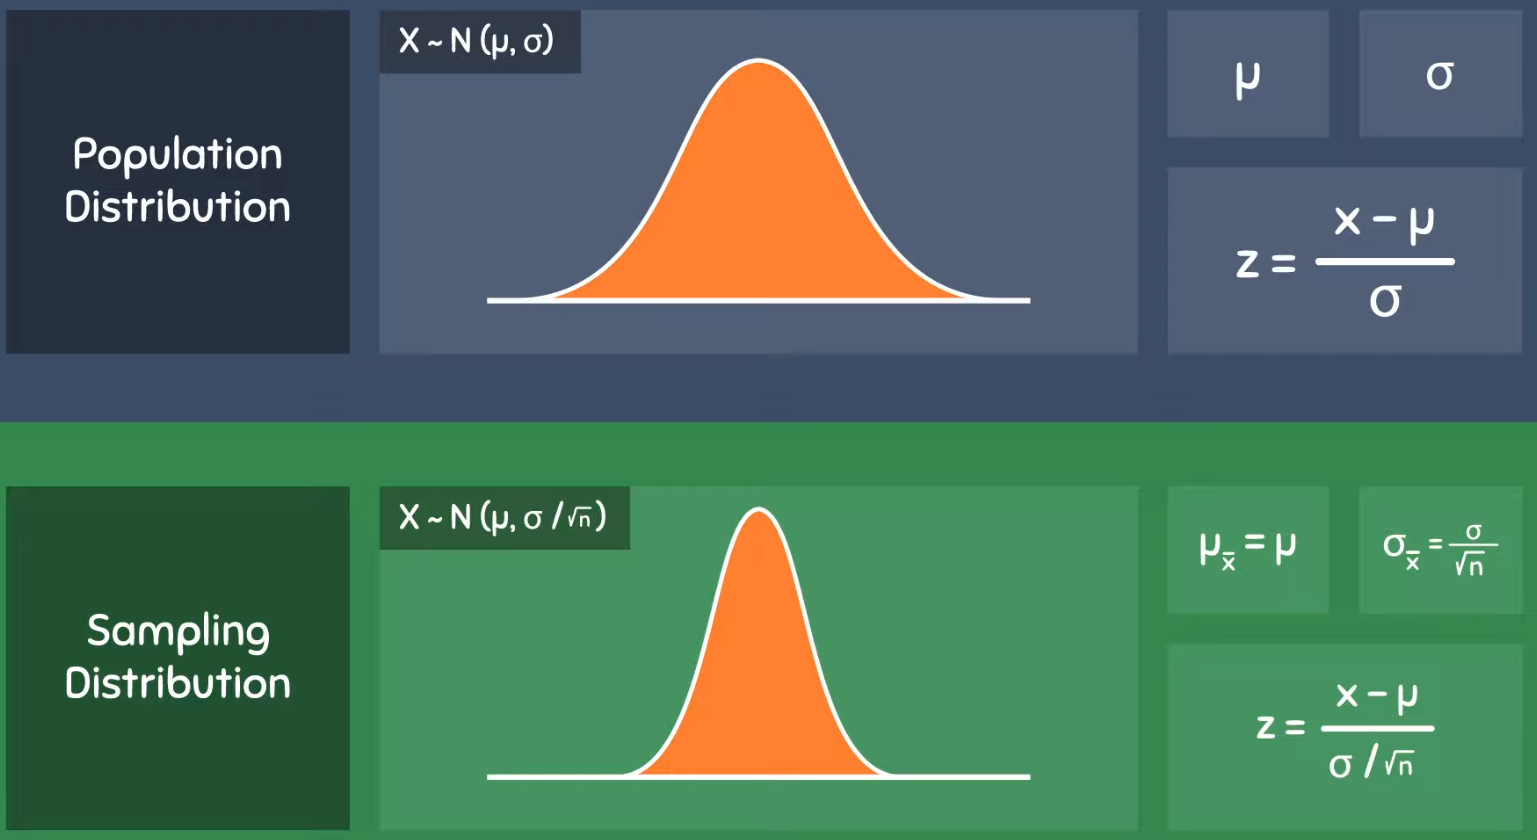
Central Limit Theorem
Sampling distribution of the sample mean will approach a normal distribution as the sample size increases, regardless of the population's distribution. Approximation will improve if the data distribution is less skewed.
Central Limit Theorem Formula
Expressed as the distribution for the sample mean X̄ being approximately normal: 𝑋̄∼𝑁(𝜇,𝜎2/n).
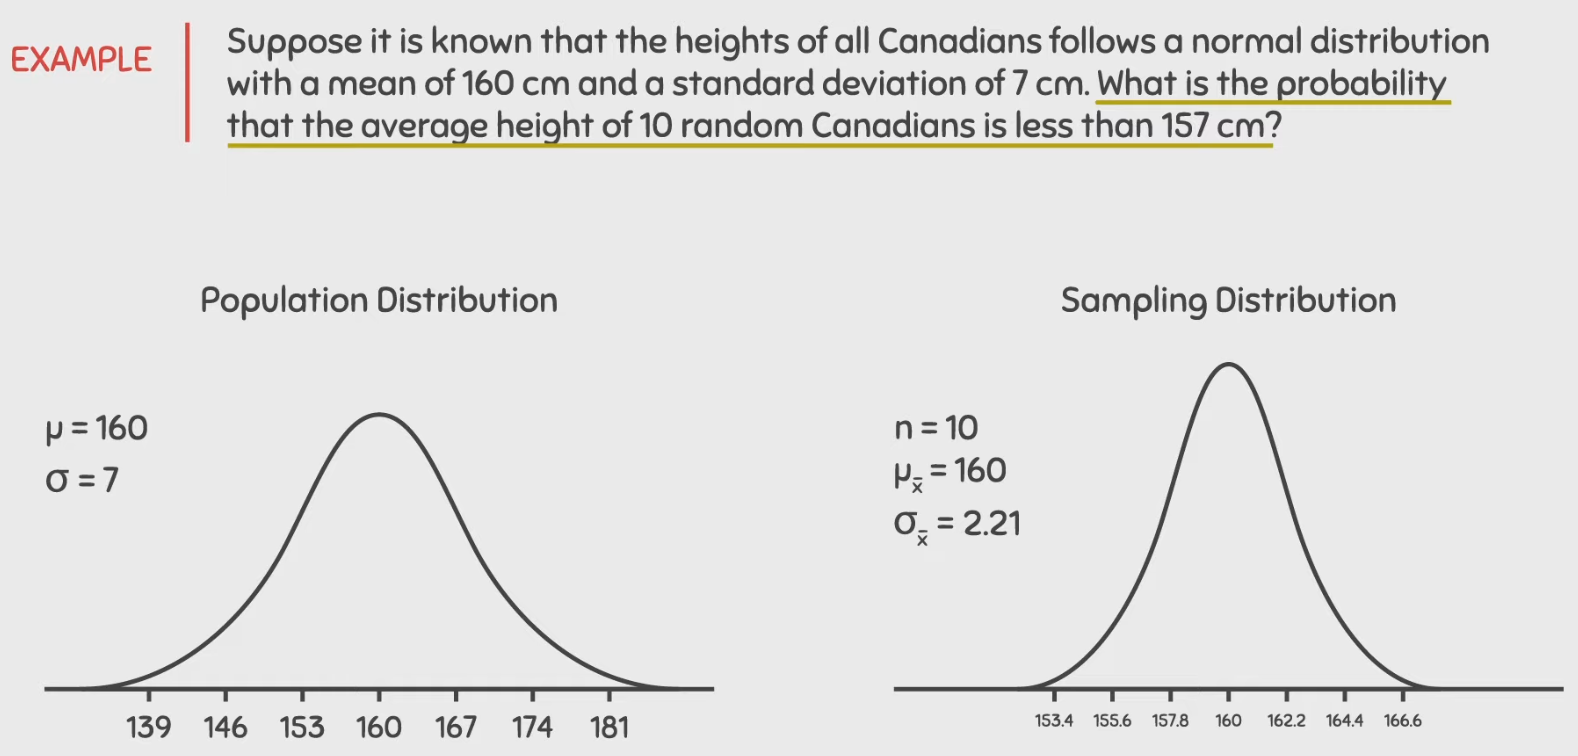
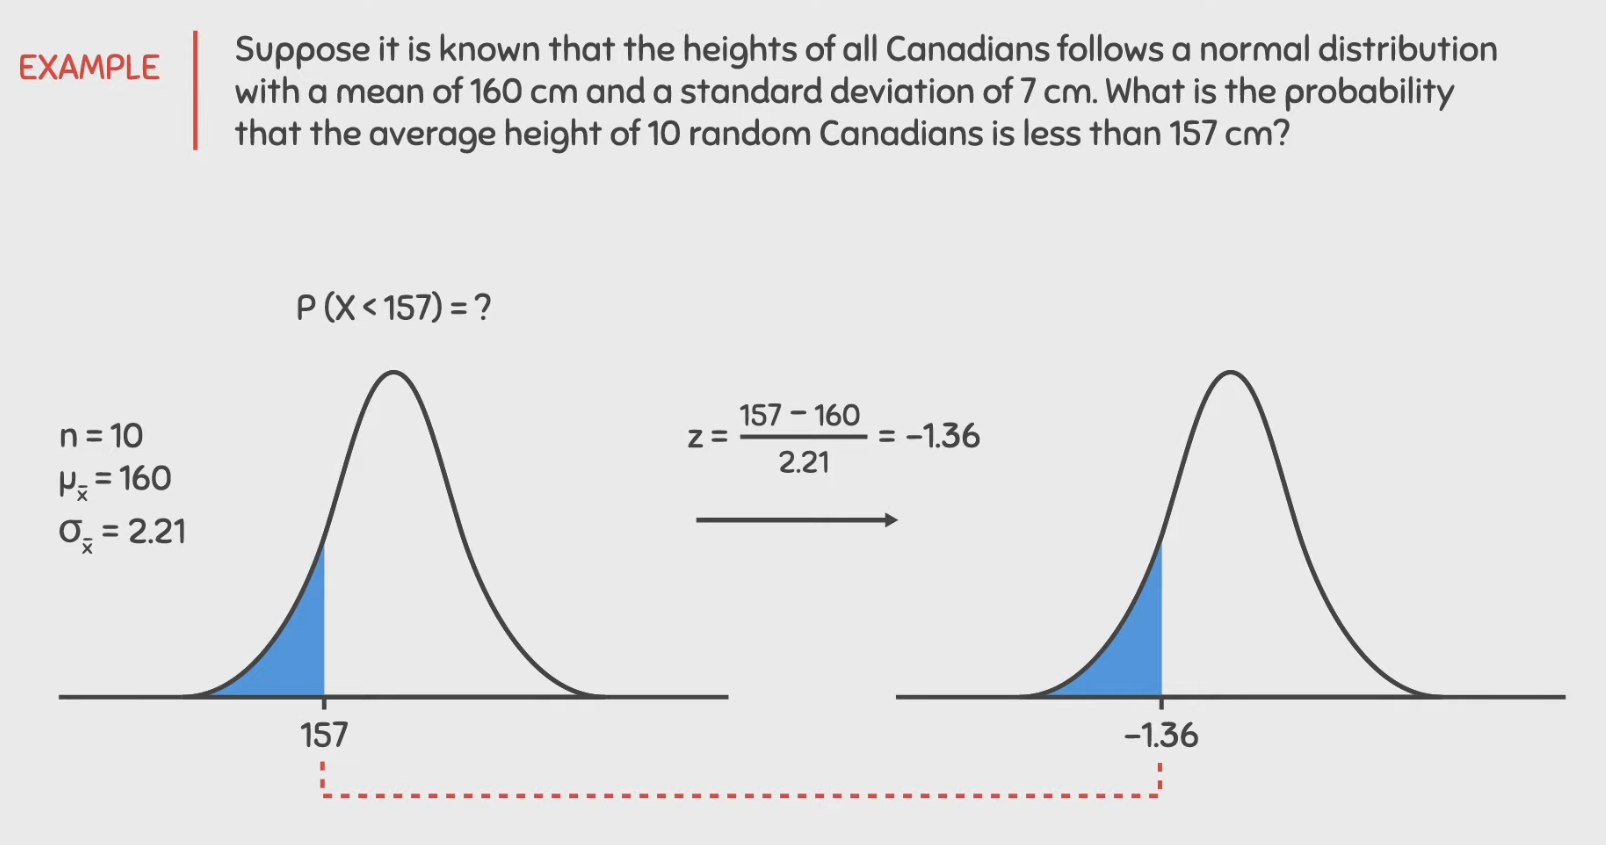
Central Limit Theorem Example
Convert population to sampling distribution → Get Z using standardisation → Find probability
As sample size increases, what happens to shape of the sampling distribution of sample mean?
The sampling distribution of the sample mean looks less like the data/population distribution as the sample size increases. The sampling distribution becomes approximately normal, even if the data/population distribution is not normal.
As sample size increases, how does the shape of the data distribution change in relation to the population distribution?
The data distribution looks more like the population distribution as the sample size increases.