(L11) IMED2004 - Genetics of Complex Disease
 Call Kai
 Learn
Learn Practice Test
 Spaced Repetition
 Match
Match Flashcards
 Knowt Play
1/64

There's no tags or description
Looks like no tags are added yet.
Name | Mastery | Learn | Test | Matching | Spaced | Call with Kai | Chat |
|---|
No analytics yet
Send a link to your students to track their progress
65 Terms
What are the eight learning outcomes for Genetics of Complex Disease?
1. Understand that complex diseases are common, quantitative and multigenic.
2. Define heritability and relate genetic and environmental contributions to susceptibility.
3. Understand the case-control design of GWAS and the associations GWAS detects.
4. Define linkage disequilibrium (LD), explain its use in association studies, and distinguish it from traditional linkage.
5. Define haplotype, understand limited haplotype-block diversity, and explain haplotype use in GWAS.
6. Understand GWAS successes and the difficulty of converting associations into biological pathways.
7. Describe missing heritability.
8. Compare the effect sizes of common versus rare variants and explain why rare variants are poorly captured by GWAS.
What is a complex disease in genetics?
A disorder resulting from:
- Multiple genomic variants and genes
- Significant influences of the physical environment
- Significant influences of the social environment
.
Lecturer explanation:
Because both genetics and environment contribute, complex diseases are often called multifactorial diseases.
What is a chronic disease, and how is it related to complex disease?
A chronic disease is a long-lasting condition with persistent effects.
Many complex diseases are also chronic.
Consequences:
- Reduced quality of life
- Social burden
- Economic burden
.
Multimorbidity:
The presence of 2 or more chronic conditions in the same person.
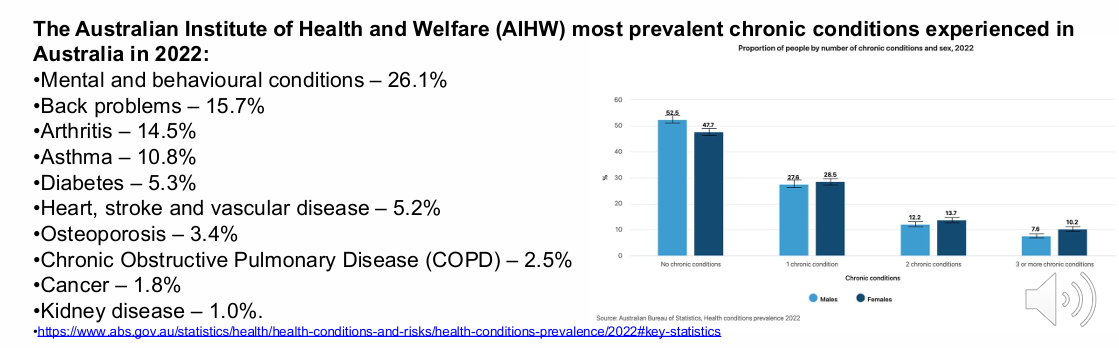
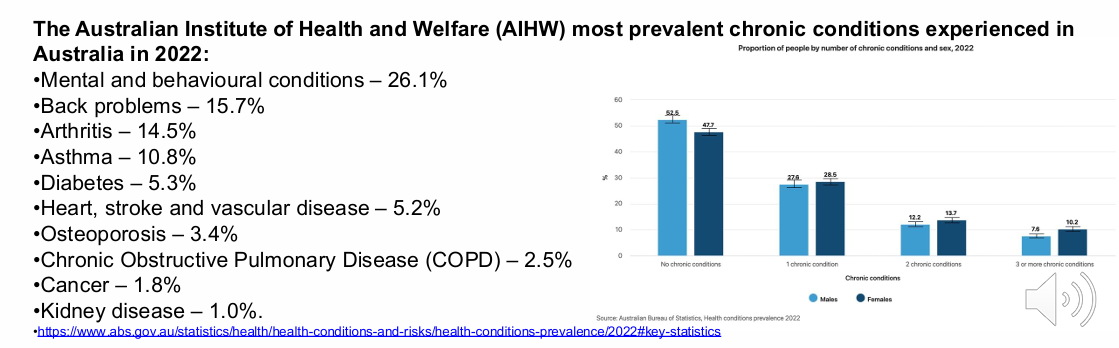
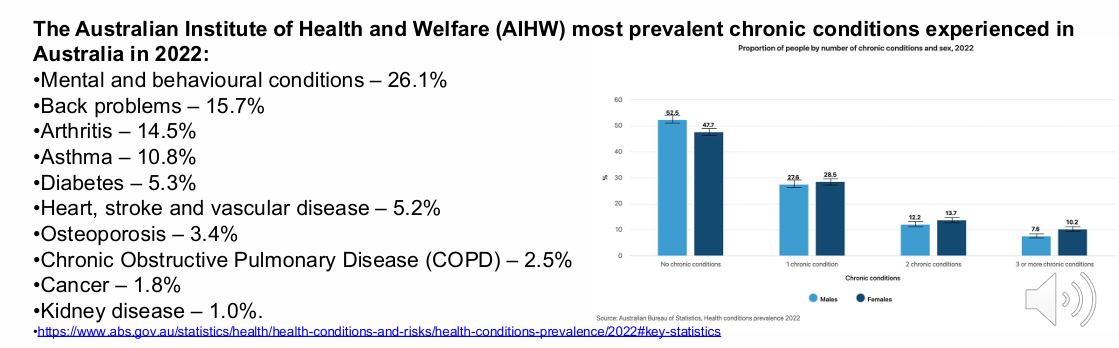
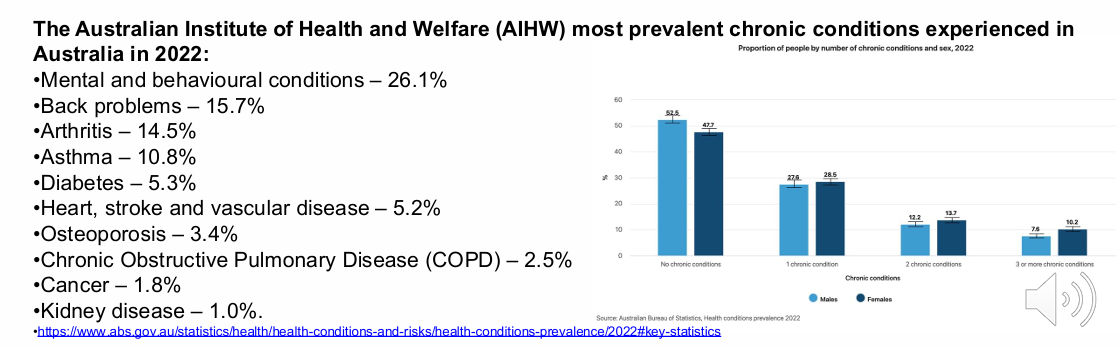
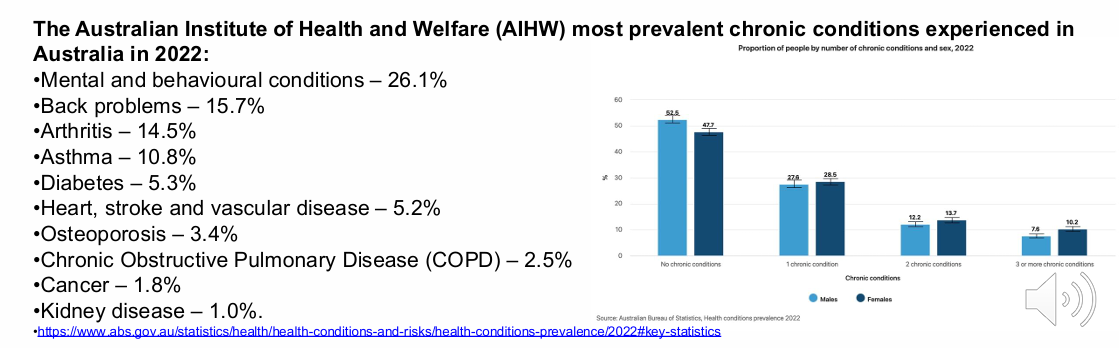
What Australian chronic-disease prevalence figures were given for 2022?
Mental and behavioural conditions: 26.1%
Back problems: 15.7%
Arthritis: 14.5%
Asthma: 10.8%
Diabetes: 5.3%
Heart, stroke and vascular disease: 5.2%
Osteoporosis: 3.4%
COPD: 2.5%
Cancer: 1.8%
Kidney disease: 1.0%
.
Lecturer explanation:
About 1 in 2 Australians have at least one chronic condition and about 1 in 5 have two or more.
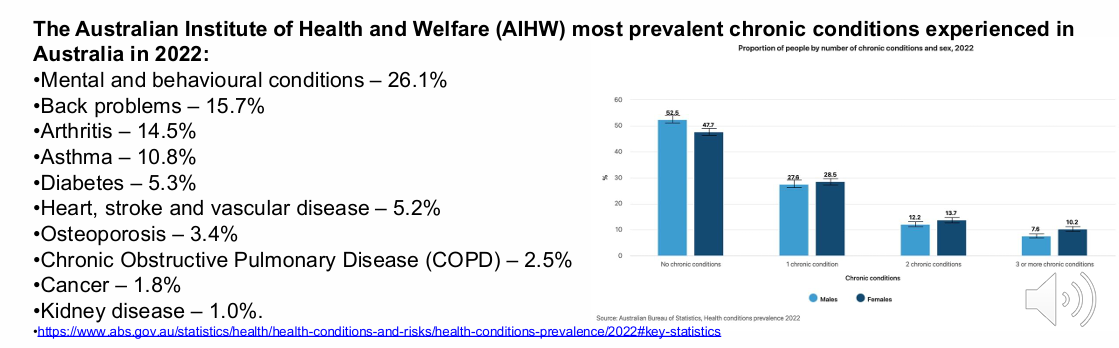
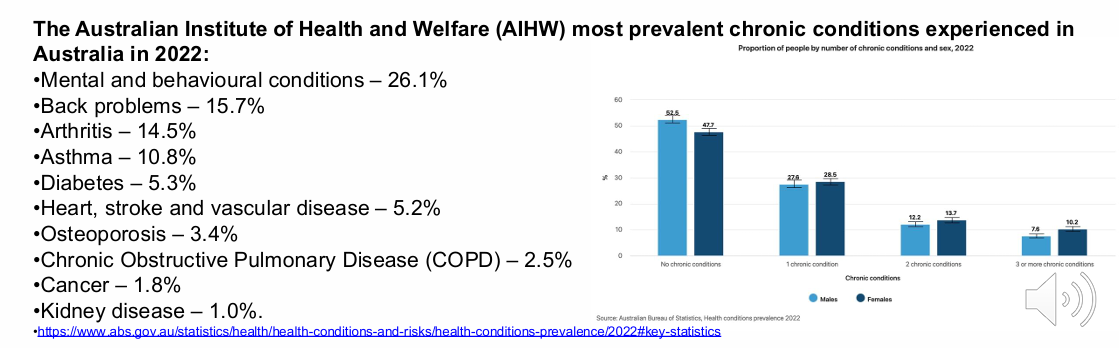
What should you identify in the complex/chronic disease figure?
- Complex disease = multiple genomic variants/genes + physical/social environment
- Chronic diseases are long-lasting with persistent effects
- Multimorbidity = 2 or more chronic conditions
- The listed 2022 Australian prevalence values

Why do complex diseases not follow Mendelian inheritance?
Because:
- Many loci contribute to risk.
- Genetic variants are only one component of risk.
- Environmental and lifestyle factors also contribute.
- Risk and protective alleles combine across the genome.
Therefore:
No simple dominant, recessive or X-linked pedigree pattern is expected.
What does a complex-disease risk allele mean?
A risk allele creates a genetic predisposition rather than certainty.
.
A carrier:
- May be more likely to develop disease than a non-carrier.
- Will not necessarily develop it.
.
Whether disease develops depends on:
- Full genetic background
- Risk and protective alleles
- Lifestyle
- Environment
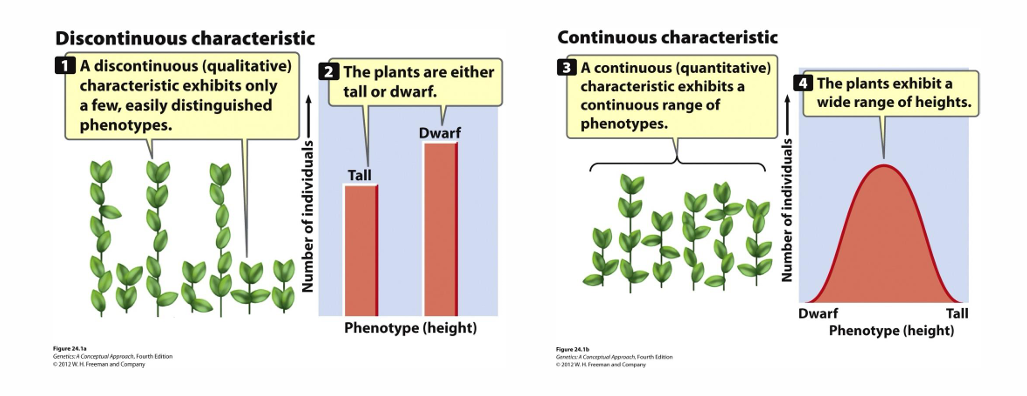
How do Mendelian and complex traits differ as qualitative versus quantitative traits?
Mendelian traits:
- Qualitative
- Discrete
- One-or-the-other phenotype
- No in-between
.
Complex traits:
- Quantitative
- Continuous
- Polygenic/multifactorial inheritance
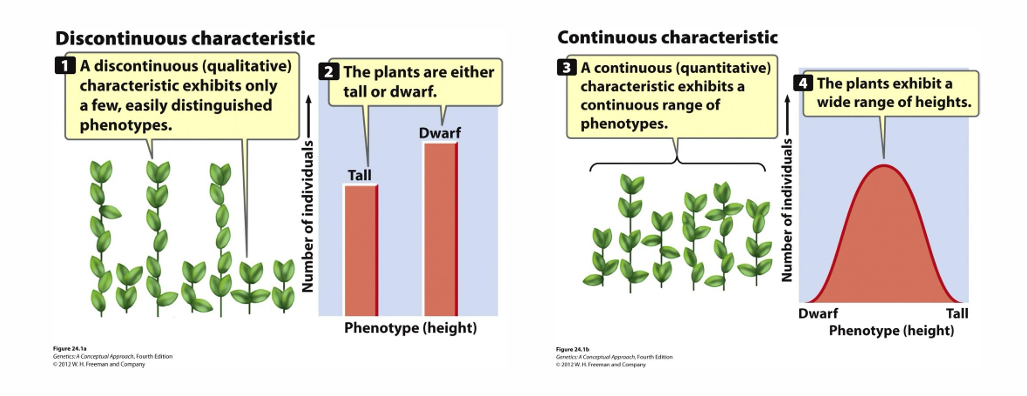
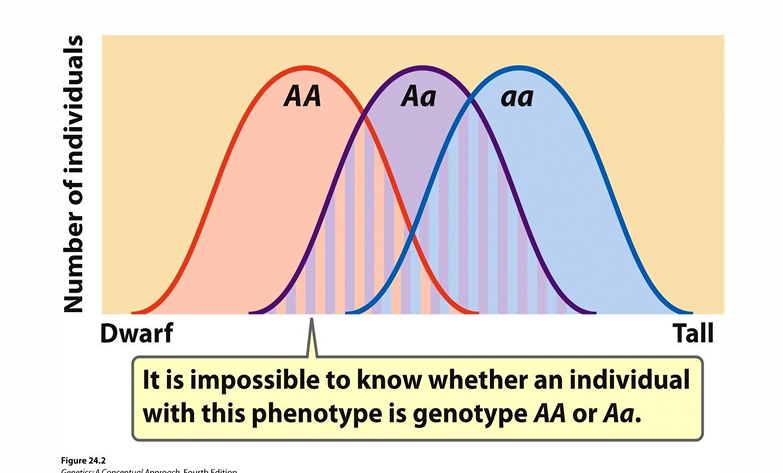
What should you identify in the qualitative-versus-quantitative trait diagram?
Mendelian/discontinuous:
- Distinct phenotype classes such as tall versus dwarf
.
Complex/continuous:
- A broad bell-shaped range of phenotypes such as plant height
- Number of individuals plotted against phenotype
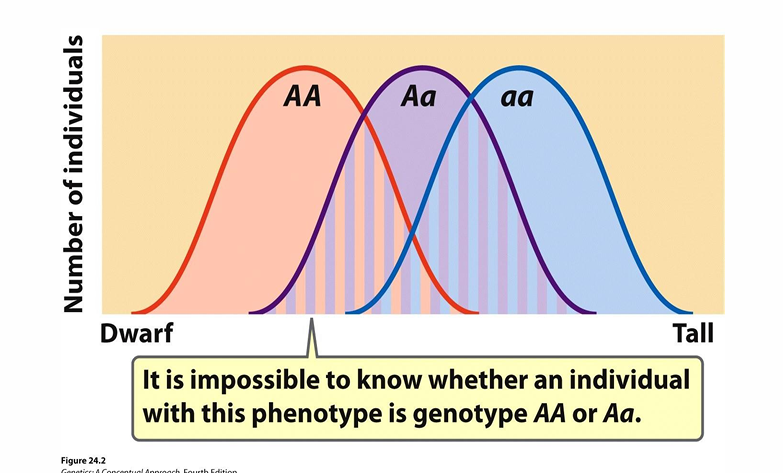
Why can genotype sometimes be inferred from a Mendelian phenotype but not from a complex quantitative phenotype?
Qualitative/Mendelian traits:
- Phenotype classes can correspond clearly to genotype.
.
Quantitative/complex traits:
- Phenotype distributions overlap.
- The same phenotype can arise from different genotypes.
.
Therefore:
Genotype cannot be reliably inferred from phenotype in complex traits.
What should you identify in the overlapping genotype distributions for a complex trait?
- AA, Aa and aa each have overlapping phenotype distributions.
- An intermediate phenotype could belong to more than one genotype.
- Overlap prevents reliable genotype inference from phenotype.
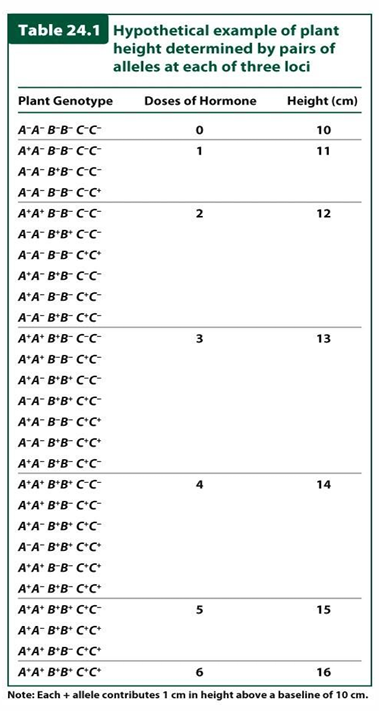

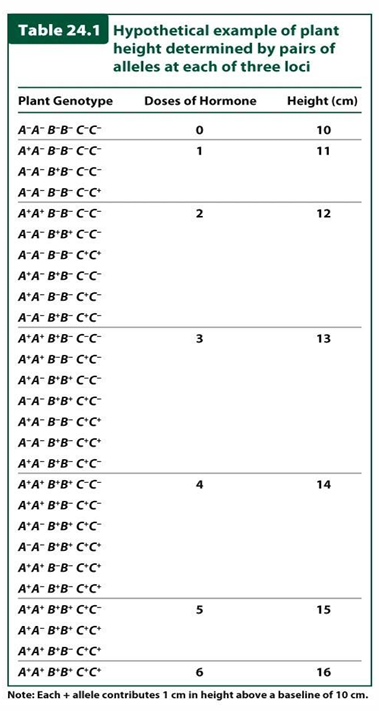
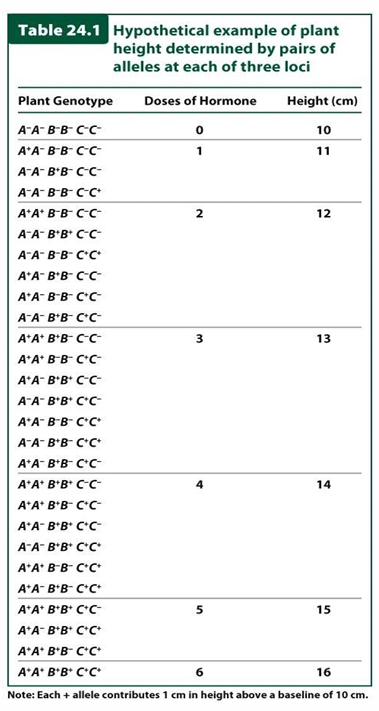
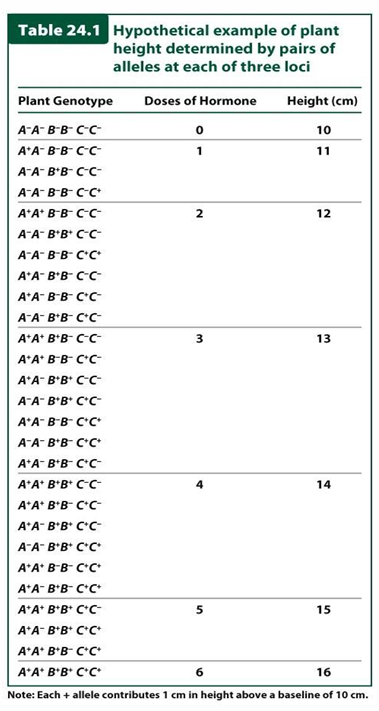
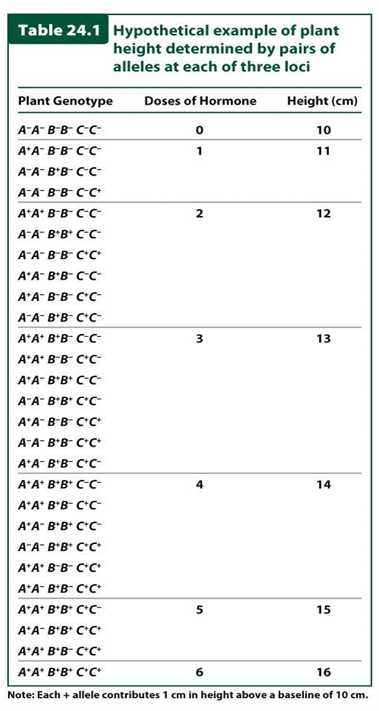
How does the hypothetical A, B and C growth-hormone model illustrate multigenic inheritance?
Genes A, B and C each contribute growth-hormone doses.
A−A−B−B−C−C−:
- 0 hormone doses
A+A+B+B−C−C−:
- 2 doses hormone A
- 1 dose hormone B
- 0 doses hormone C
- 3 doses total
More hormone doses correlate with greater plant height.

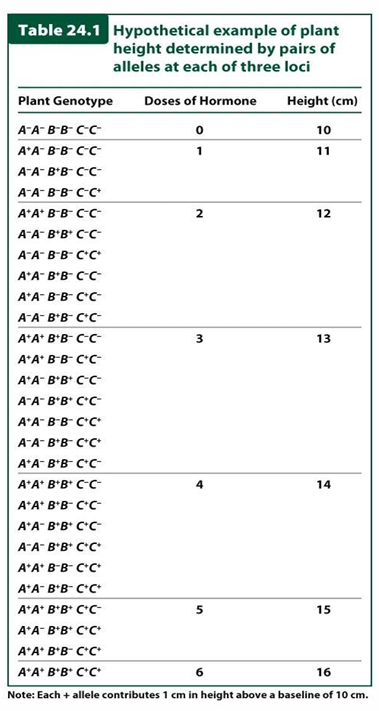
Why can plant genotype not be inferred from height in the multigenic A/B/C example?
Many different genotypes can generate the same total number of hormone doses.
Therefore:
- Different genotypes can produce the same phenotype.
- Height does not uniquely identify genotype.
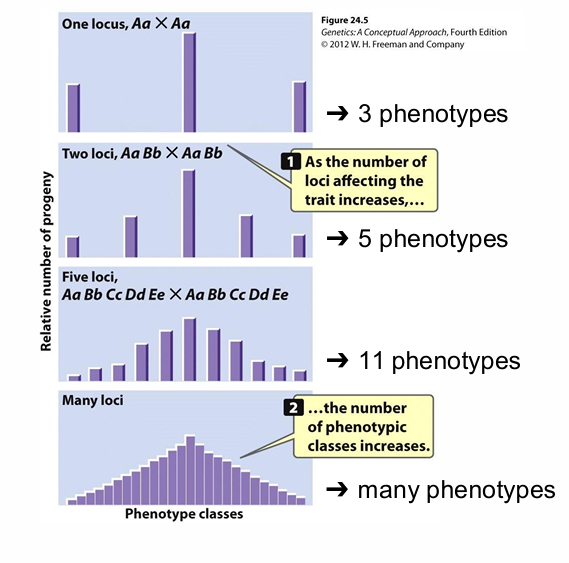
How does increasing the number of loci affect the number of phenotypes in a complex trait?
One locus:
- 3 phenotypes
.
Two loci:
- 5 phenotypes
.
Five loci:
- 11 phenotypes
.
Many loci:
- Many phenotypes
.
As loci increase:
- Phenotypic classes increase.
- Each individual locus contributes less.
.
follows 2n+1
Why are genetic risk alleles for complex disease difficult to find?
Because:
- Many loci contribute.
- Each usually has only a small effect.
- Different people with the same disease may carry different risk-allele combinations.
- Environmental effects also contribute.
Lecturer emphasis:
Complex disease reflects many small genetic effects plus environment.
What is heritability (H²)?
Heritability is the proportion of phenotypic variation (VP) explained by genetic variation (VG).
H² = VG / VP
VP = VG + VE + VGE
VE = variance due to environment
VGE = variance due to gene × environment interaction
What do H² = 0 and H² = 1 mean?
H² = 0:
- Phenotypic variance is due to environment only.
.
H² = 1:
- Phenotypic variance is due to genotype only.
- The lecture associates this with Mendelian traits.
Complex disease:
- Usually intermediate because both genes and environment contribute.
What heritability estimates were given for common complex diseases?
Coronary artery disease: H² = 0.40
Arthritis: H² = 0.42
Type 2 diabetes: H² = 0.69
Asthma: H² = 0.47-0.83
Conclusion:
Less than 100% of complex-disease risk is genetic.
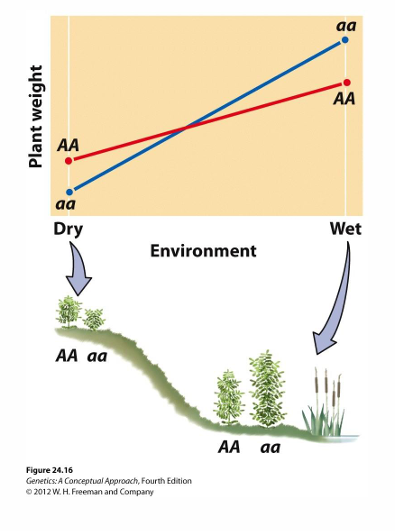
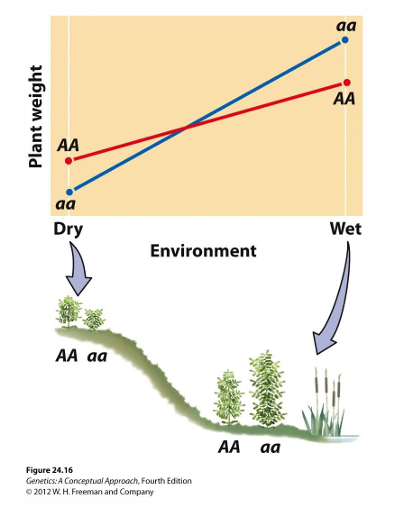
How can the environment alter the phenotype produced by a genotype?
The same genotype can produce different phenotypes in different environments.
.
Plant example:
- Both genotypes are shorter in dry conditions.
- Both are taller in wet conditions.
.
Human environmental factors include:
- Smoking
- Diet
- Physical activity
Why is gene-environment interaction clinically important?
Changing environmental/behavioural factors is currently more feasible than changing the genome.
.
Examples:
- Smoking status
- Diet
- Physical activity
Therefore:
Environmental intervention is a practical route to modifying complex-disease risk or severity.


What should you identify in the genotype-by-environment interaction diagram?
- Two genotypes respond differently across dry versus wet environments.
- Phenotype depends on both genotype and environment.
- The non-identical response lines illustrate gene-environment interaction.


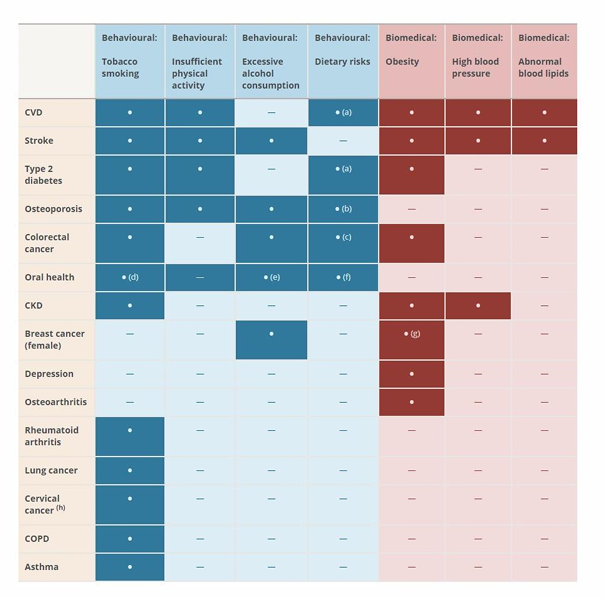
Which behavioural and biomedical risk factors were highlighted as being associated with multiple chronic diseases?
Behavioural:
- Tobacco smoking
- Insufficient physical activity
- Excessive alcohol consumption
- Dietary risks
.
Biomedical:
- Obesity
- High blood pressure
- Abnormal blood lipids

What are the potential benefits of identifying gene-environment interactions in complex disease?
- Personalised guidance on environmental interventions
- Identification of pathways through which exposures act
- Identification of exposures needing further investigation
- Better understanding of disease aetiology
- Rational design of targeted treatments
- Better disease-risk prediction

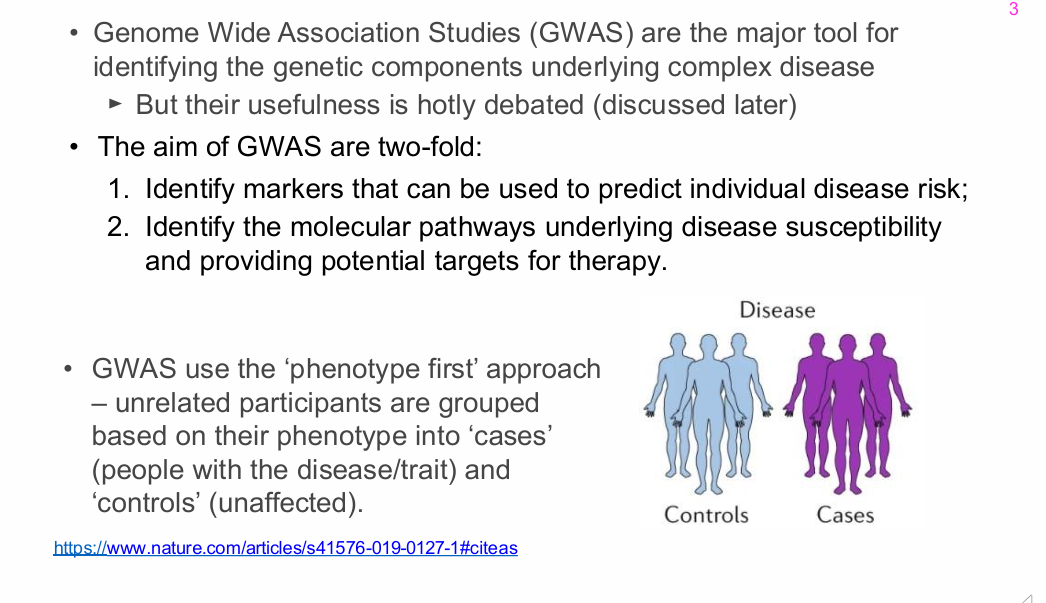
What are the two main aims of genome-wide association studies (GWAS)?
1. Identify markers that can help predict individual disease risk.
2. Identify molecular pathways underlying disease susceptibility and potential therapeutic targets.
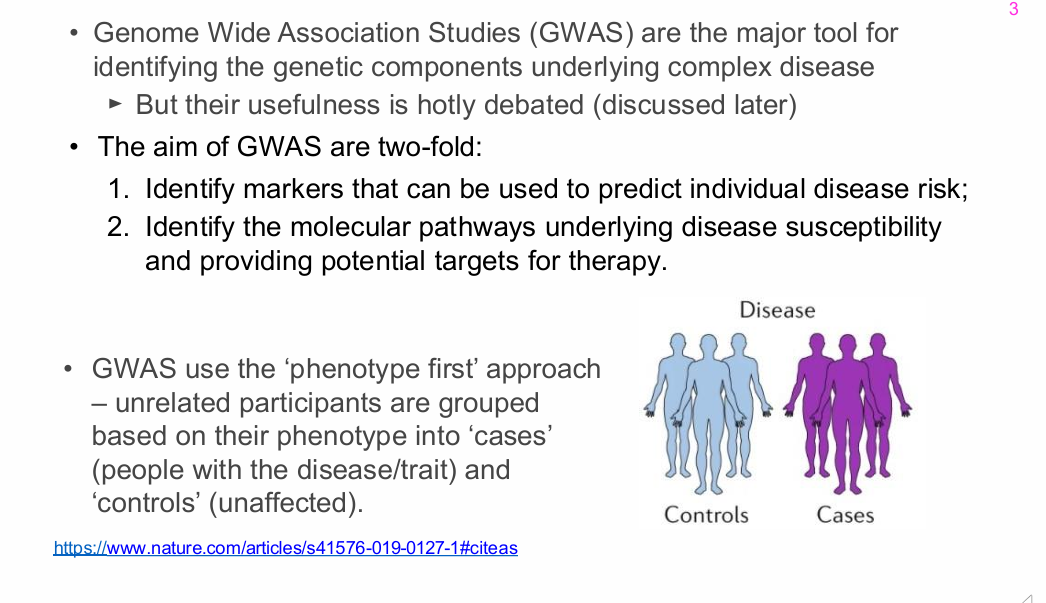
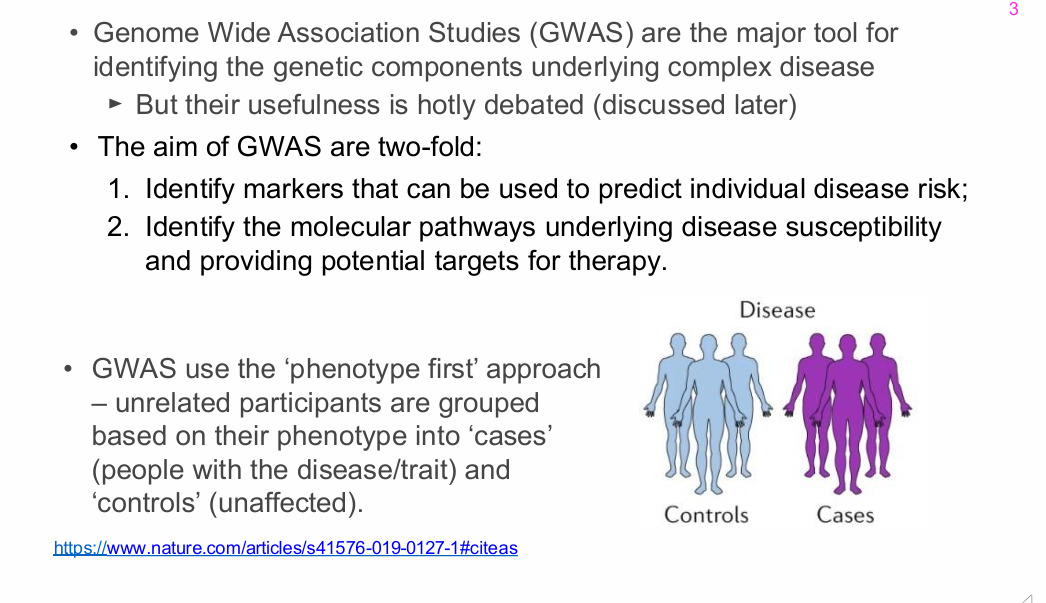
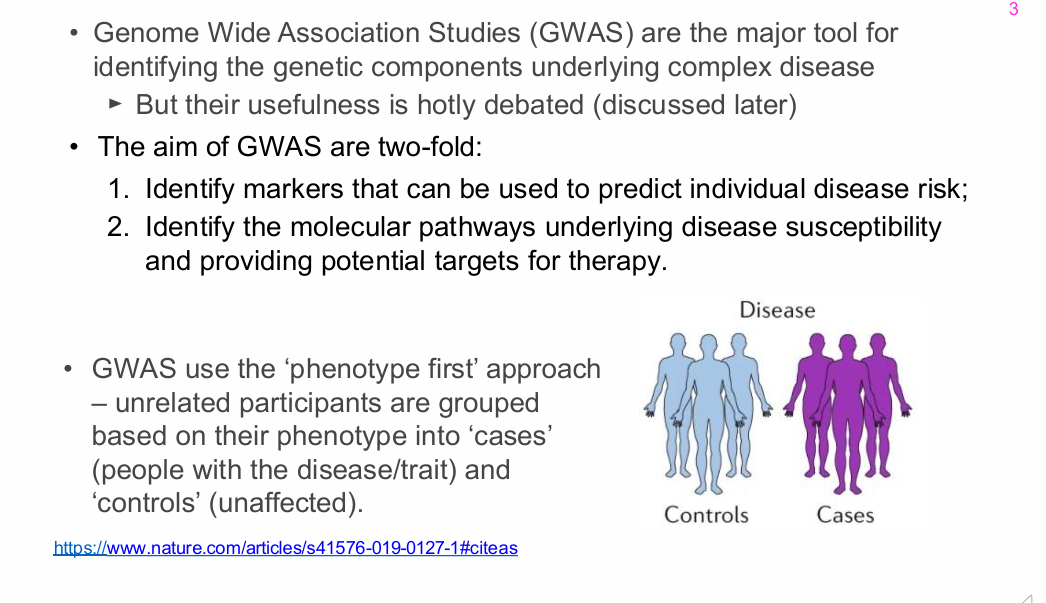
What does the phenotype-first design of GWAS mean?
Unrelated participants are grouped by phenotype into:
.
- Cases: people with the disease/trait
- Controls: unaffected people
.
GWAS compares genetic-marker frequencies between these groups.

How many SNPs are typically assayed in a GWAS according to this lecture?
Approximately 300,000-500,000 SNPs per participant.
Technology:
Usually SNP arrays/microarrays.
When is a SNP considered associated with disease in GWAS?
When the SNP/allele is more frequent in cases than controls at a statistically significant level.
Important:
Association does not by itself prove causality.
What common-variant assumption underlies classic GWAS?
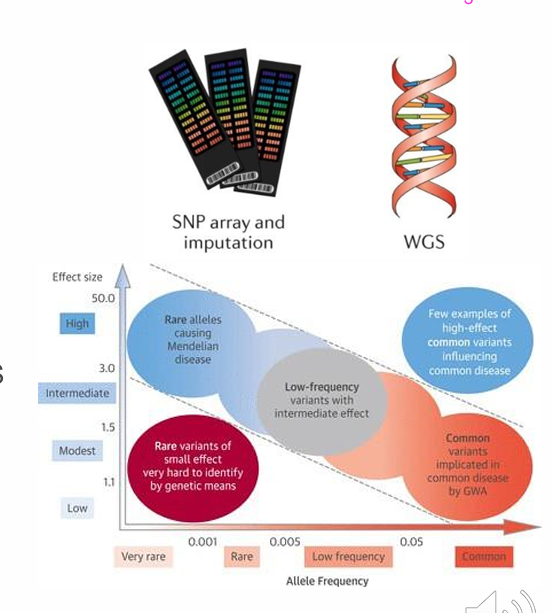
Classic GWAS is designed to detect common variants (genetic variants are more common in the cases than the controls are said to be associated with the disease)
Assumption:
Common complex diseases are influenced by common variants, each usually having a small additive effect on risk.
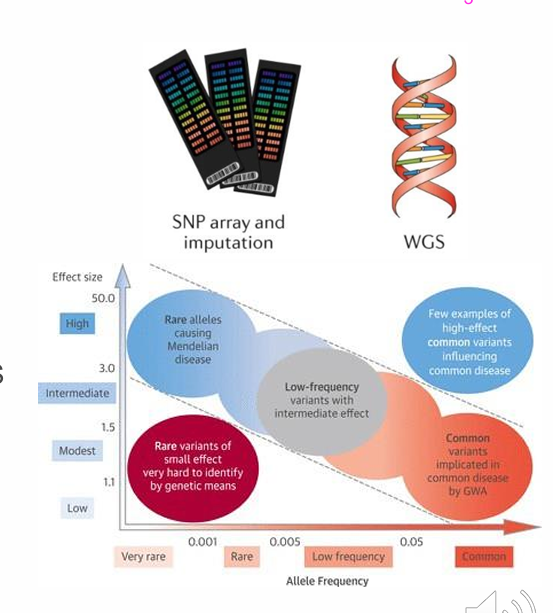

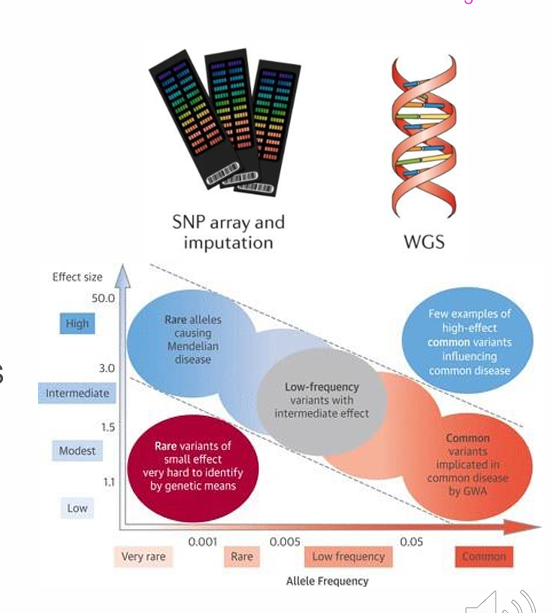
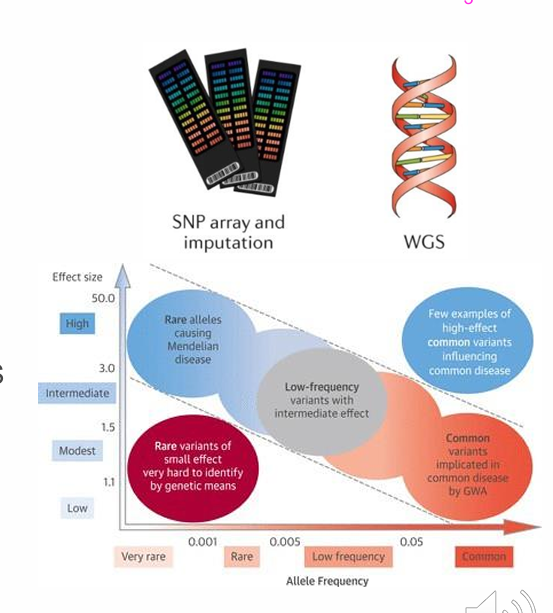
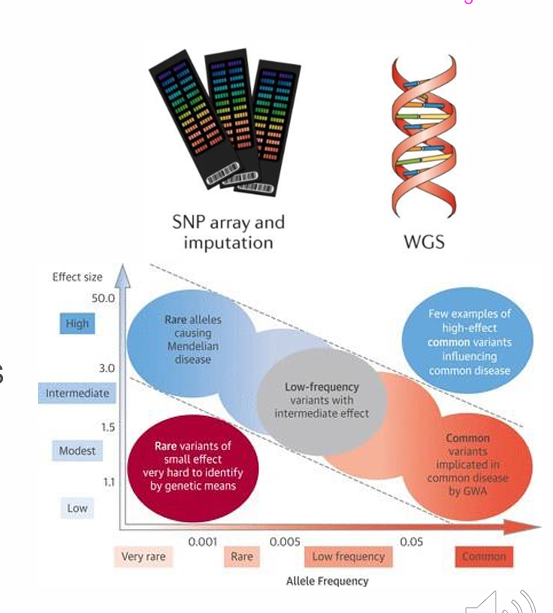
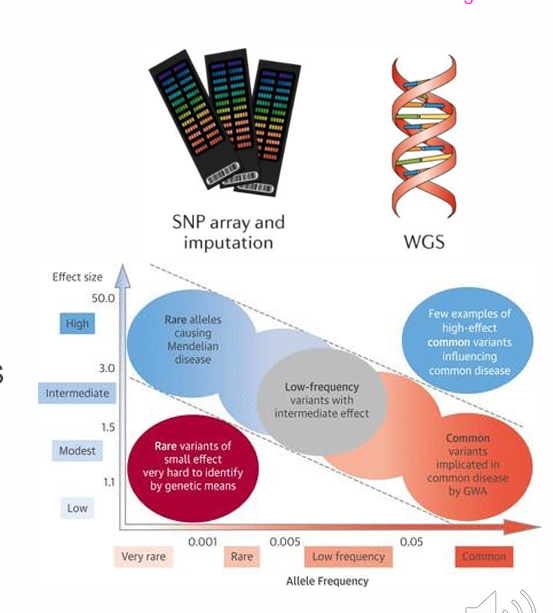
How do Mendelian and complex-disease variants differ in allele frequency and effect size?
Mendelian disease:
- Usually rare variants
- Often large effect sizes
.
Complex disease GWAS:
- Usually common variants
- Usually small effect sizes
Why does GWAS usually identify associated regions rather than the true causal variant?
The genotyped SNP may be in linkage disequilibrium with the causal variant.
Therefore:
- Marker and causal allele are inherited together more often than expected.
- Association points to a nearby genomic region.
- Functional follow-up is required to identify the causal allele.

What was the goal of the International HapMap Project?
To determine:
- Common patterns of DNA sequence variation
- Allele frequencies
- The degree of association between variants
.
Timeframe:
2002-2009
What populations and genotyping scales were used in the HapMap Project?
Populations:
- CEPH/European
- Yoruba/African
- Japanese
- Chinese
.
Main technology:
Microarrays
Phase I:
- ~1 million common SNPs
- ~1 SNP every 5 kb
- 269 DNA samples
.
Phase II:
- 3.1 million common SNPs
- 270 DNA samples
- Four populations

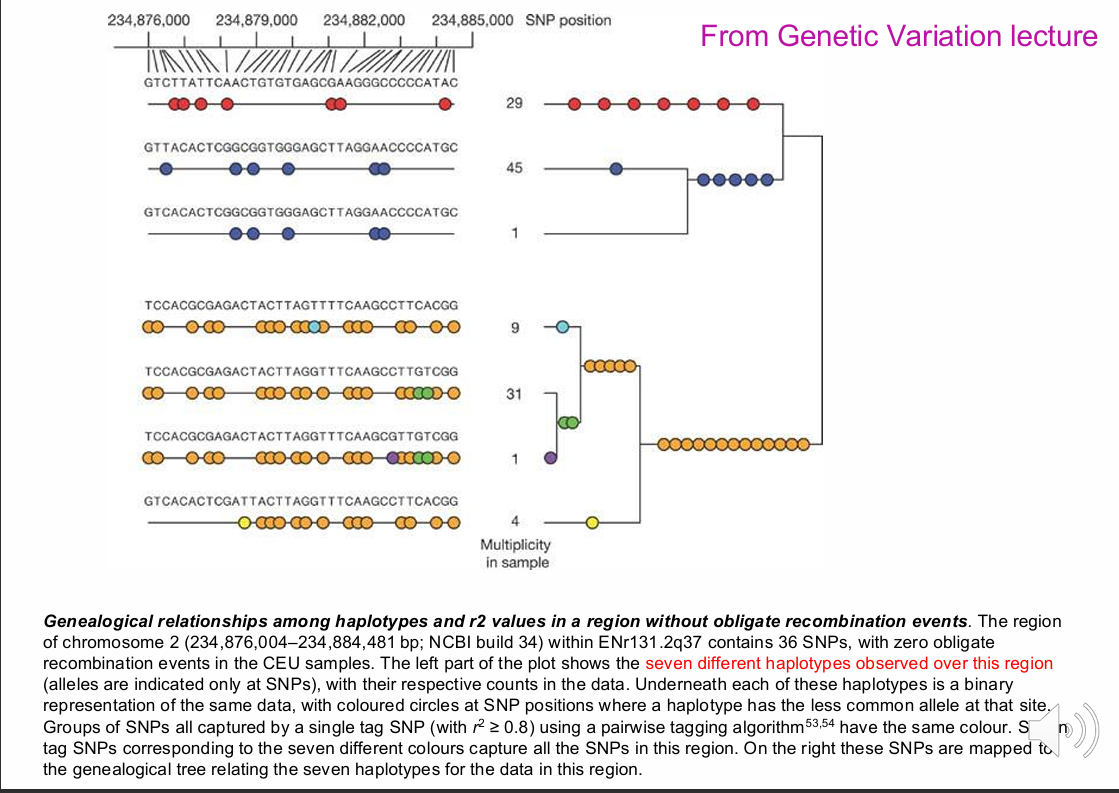
What did the chromosome 2 HapMap example show about haplotype diversity and tag SNPs?
Region:
Chromosome 2, 234,876,004-234,884,481 bp
Features:
- 36 SNPs
- 7 observed haplotypes
- Zero obligate recombination events in CEU samples
- SNP groups captured by tag SNPs with r² ≥ 0.8
- 7 tag SNPs captured all SNPs in the region

What is linkage disequilibrium (LD)?
LD is genetic association between variants due to shared DNA segments inherited from a common ancestor.
The presence of one variant provides information about the likely presence of a nearby variant.


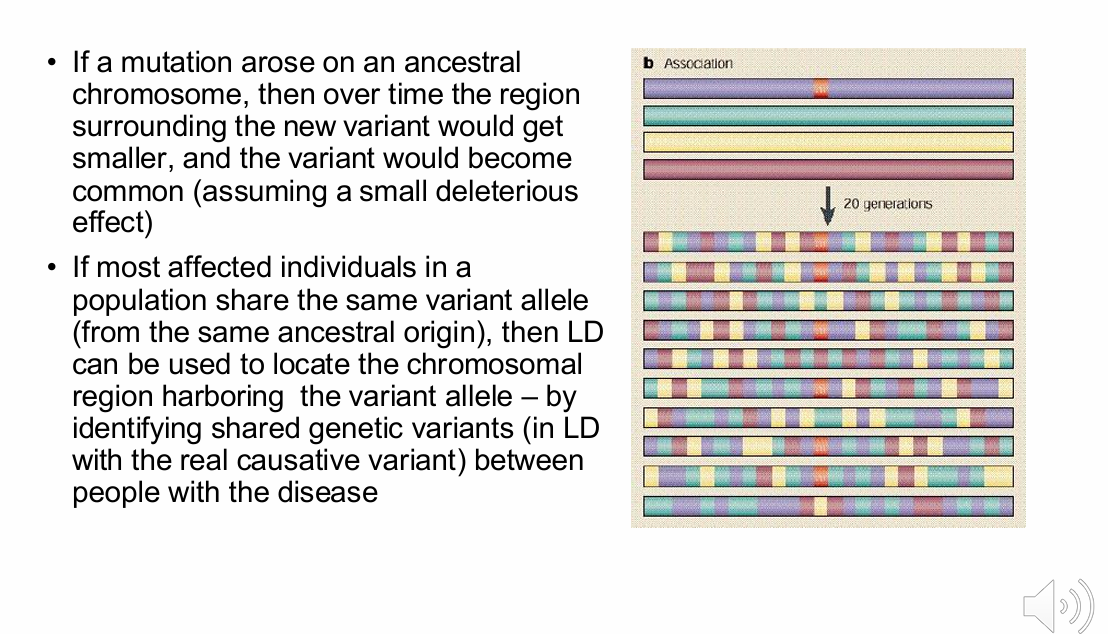
How does recombination shape LD around an ancestral mutation over generations?
1. A mutation arises on an ancestral chromosome.
2. It is inherited through generations.
3. Recombination progressively removes surrounding ancestral DNA.
4. A smaller shared segment remains around the mutation.
5. Nearby markers remain associated with the mutation.
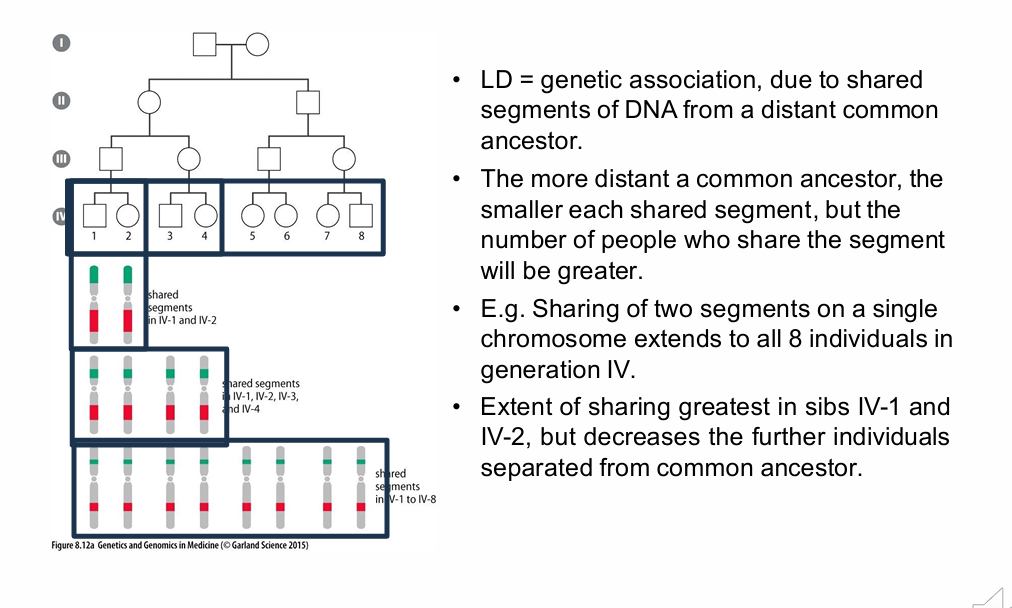
How does distance from a common ancestor affect the size and frequency of shared DNA segments?
More recent common ancestor:
- Larger shared segments
- Fewer people share them
.
More distant common ancestor:
- Smaller shared segments
- More people may share them
.
In the pedigree:
- Sharing is greatest in siblings IV-1 and IV-2.
- Sharing decreases with greater separation from the common ancestor.
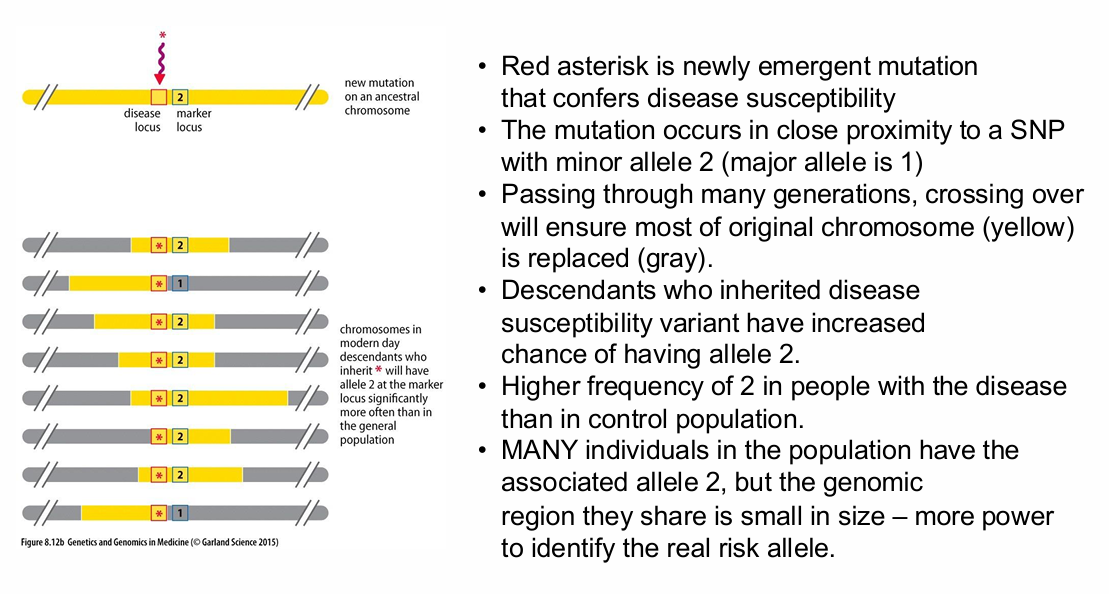
How can a marker allele become associated with a disease-susceptibility allele through LD?
1. A disease-susceptibility mutation arises near a marker SNP.
2. The marker minor allele is allele 2; major allele is 1.
3. Recombination removes much of the original chromosome over generations.
4. The nearby marker may remain linked to the disease allele.
5. Descendants with the disease allele have an increased chance of carrying marker allele 2.
6. Allele 2 becomes more frequent in cases than controls.

Why can population-based LD mapping localise a disease region more precisely than traditional family linkage?
Population-based LD:
- Reflects many generations of recombination.
- Shared ancestral segments are small.
- This gives finer localisation of a nearby risk region.
.
Traditional family linkage:
- Uses more recent relatives.
- Shared chromosome segments are larger.
- Resolution is lower.
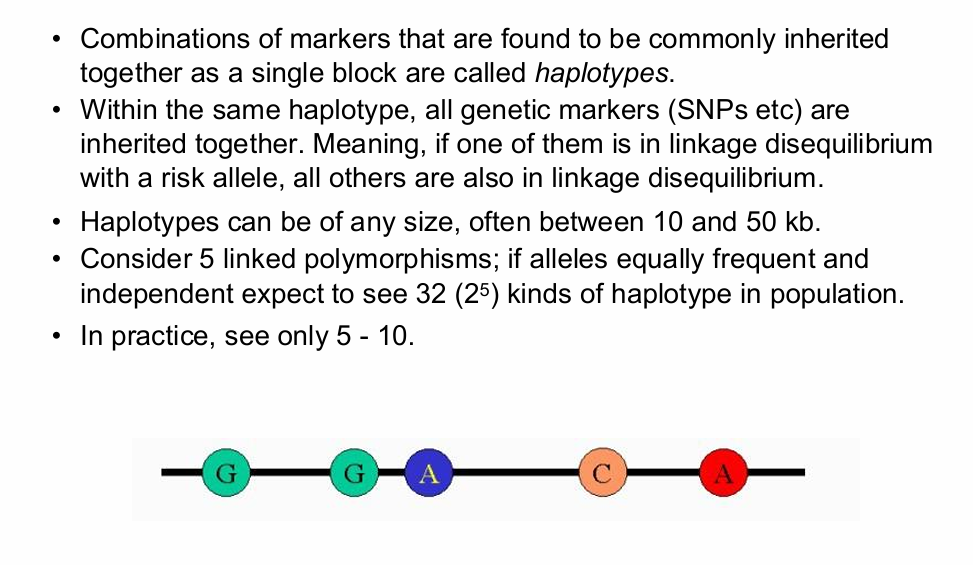
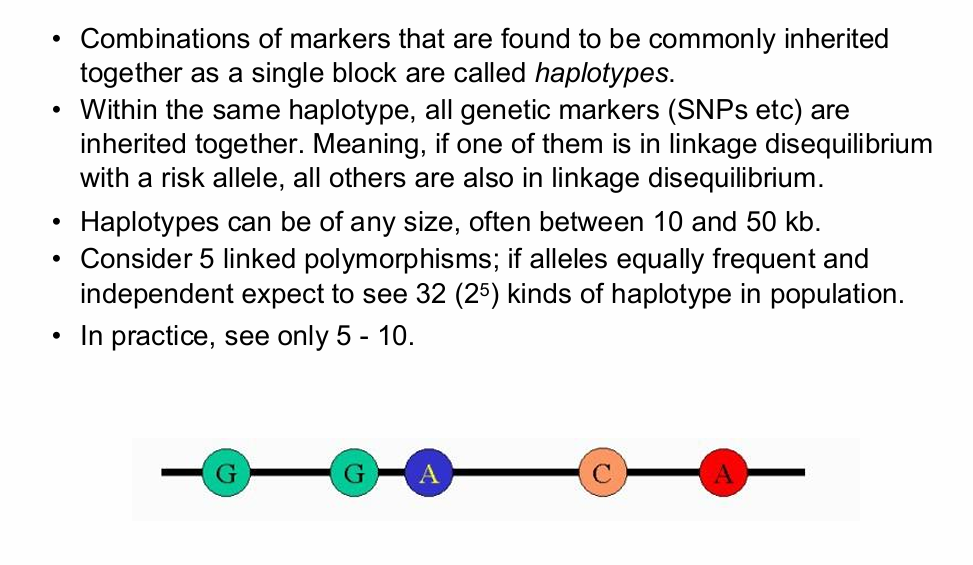
What is a haplotype?
A haplotype is a combination of genetic markers commonly inherited together as a single block.
Within a haplotype:
- SNPs are inherited together.
- If one marker is in LD with a risk allele, the others in the block are also in LD with it.


What haplotype sizes and diversity were given in the lecture?
Typical size:
Often 10-50 kb
Lecturer explanation:
Haplotype blocks may sometimes extend to ~100 kb.
Example with 5 linked polymorphisms:
- If independent and equally frequent: 2⁵ = 32 possible haplotypes
- In practice: only about 5-10 are usually observed
Why does limited haplotype diversity make GWAS feasible?
Because only a limited number of haplotypes are common:
- Researchers do not need to genotype every SNP.
- One or a few tag SNPs can identify the common haplotype block.
- Nearby untyped SNPs can be inferred/imputed from tag SNPs.

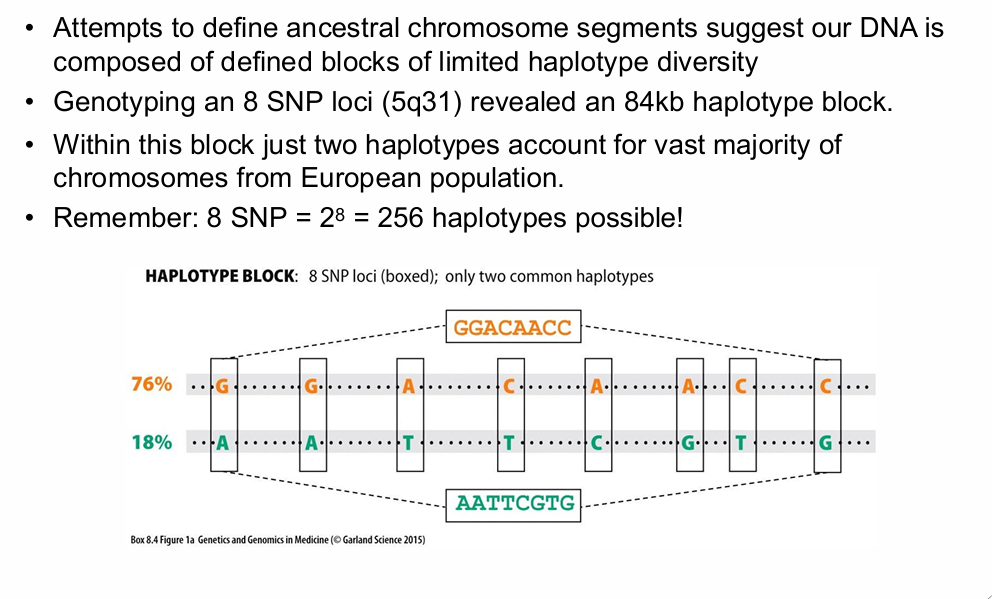
What did the 5q31 eight-SNP haplotype example show?
Region:
5q31
Block size:
84 kb
SNPs:
8
Possible haplotypes:
2⁸ = 256
Observed in the European population:
- GGACAACC = 76%
- AATTCGTG = 18%
Thus:
Two haplotypes accounted for the vast majority of chromosomes.

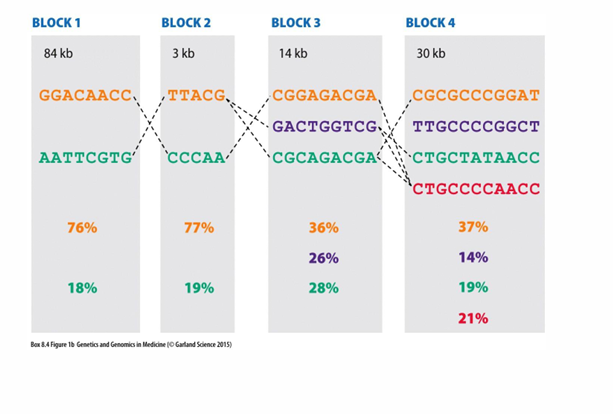
What did the adjacent 5q31 haplotype-block example show?
Four adjacent blocks were genotyped at:
- Block 1: 8 SNPs
- Block 2: 5 SNPs
- Block 3: 9 SNPs
- Block 4: 11 SNPs
Each block had:
- 2-4 common haplotypes
Dashed black lines:
Locations where >2% of chromosome 5 sequences switched between haplotypes, indicating recombination boundaries.
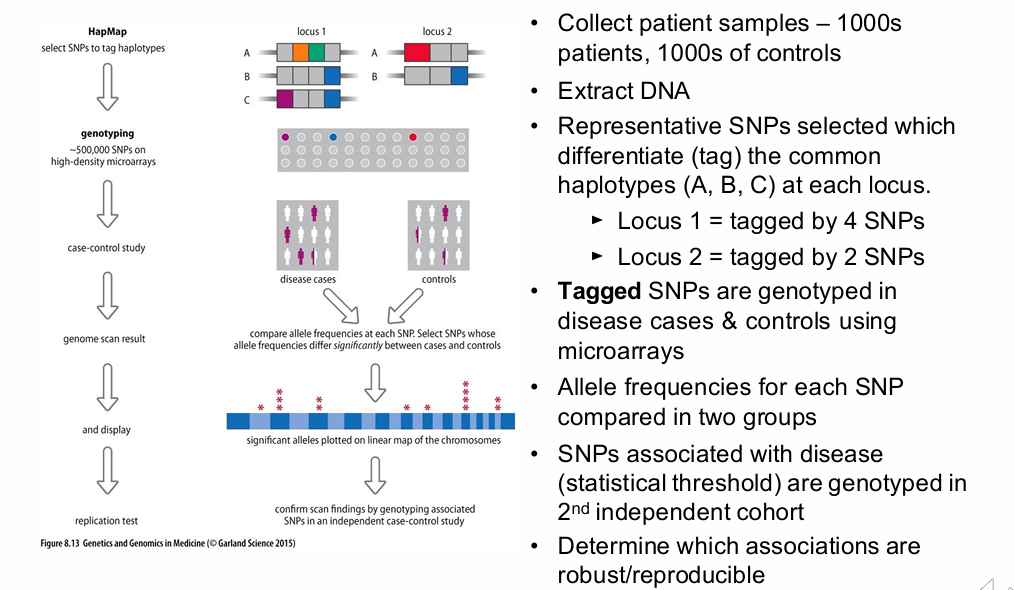
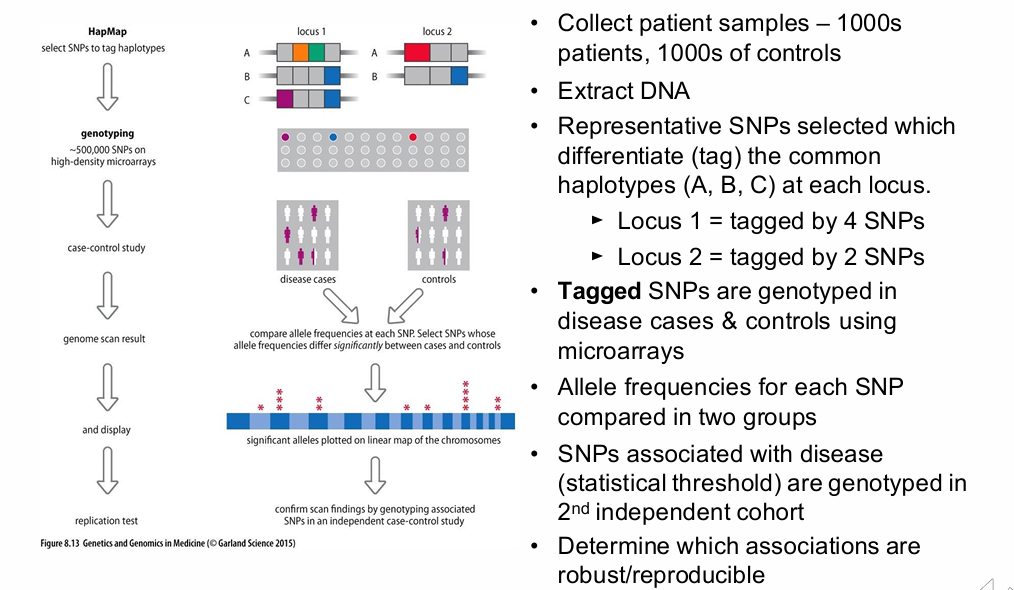
What is the standard GWAS workflow?
1. Recruit thousands of cases and thousands of controls.
2. Extract DNA.
3. Select representative tag SNPs for common haplotypes.
4. Genotype those SNPs, usually by microarray.
5. Compare allele frequencies between cases and controls.
6. Identify SNPs exceeding the significance threshold.
7. Genotype significant SNPs in a second independent cohort.
8. Determine which associations are robust and reproducible.

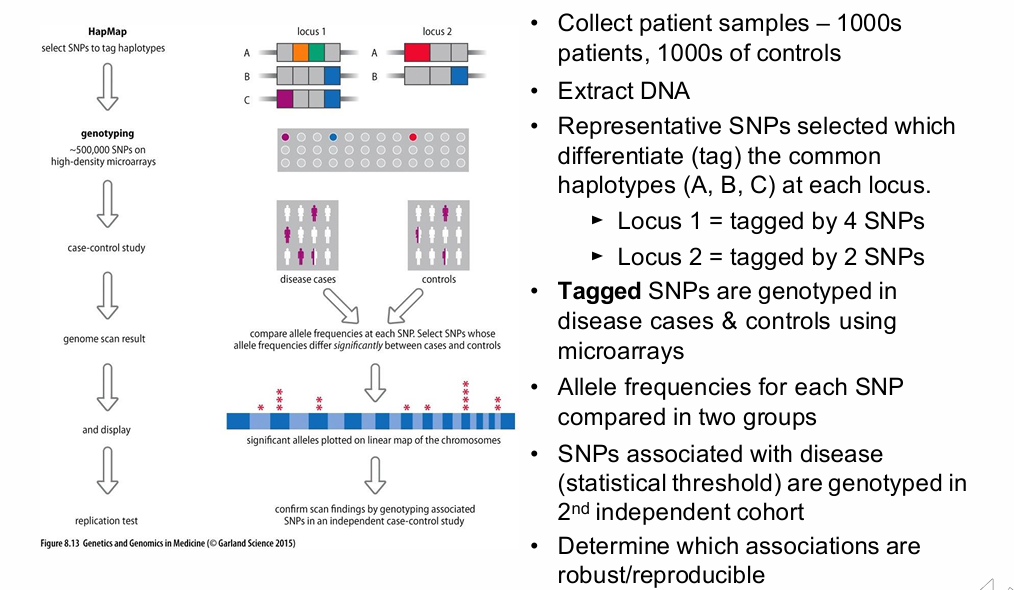
Why are tag SNPs used in GWAS?
Tag SNPs represent common haplotypes.
Because nearby variants are in LD:
- A few selected SNPs can capture information about many SNPs in the same block.
- Fewer loci need to be directly genotyped.

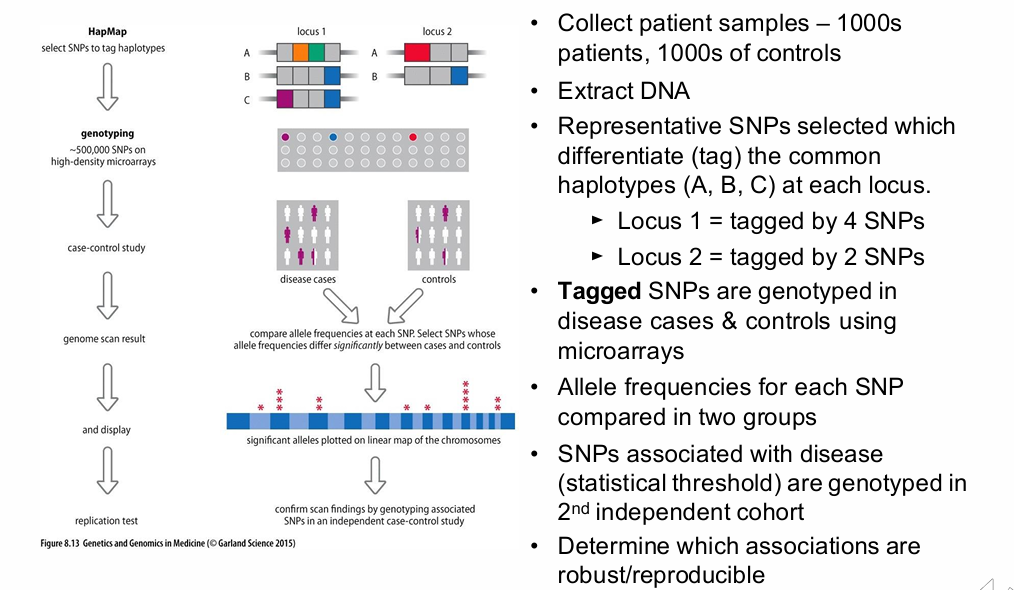
What should you identify in the GWAS workflow diagram?
- HapMap/common haplotypes
- Selection of tag SNPs
- Genotyping thousands of cases and controls
- Comparison of allele frequencies
- Identification of significant loci
- Replication in an independent cohort
What is a Manhattan plot in GWAS?
A Manhattan plot displays:
- Chromosomes along the x-axis
- −log10(P) for SNP associations on the y-axis
Peaks look like a city skyline because nearby SNPs in LD can all show association around the same causal region.
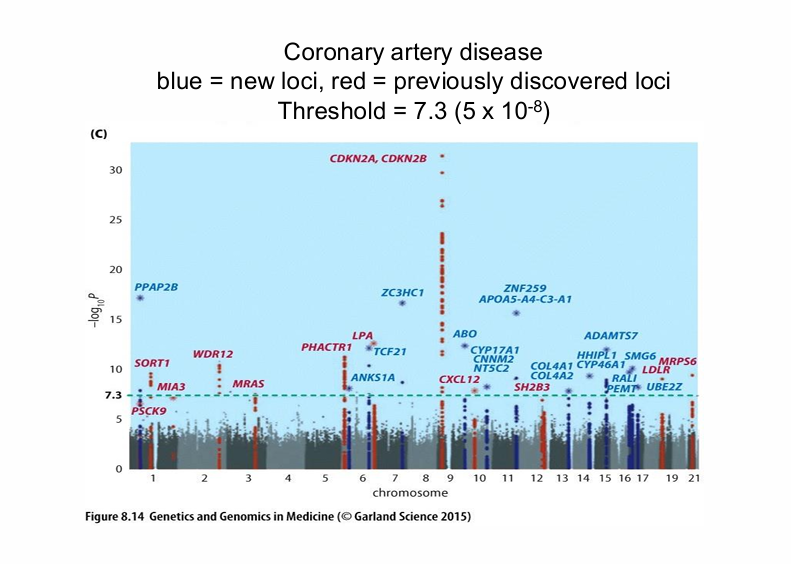
What genome-wide significance threshold was shown for the coronary artery disease Manhattan plot?
Threshold:
P = 5 × 10⁻⁸
.
Equivalent plotted value:
−log10(P) ≈ 7.3
Slide colours:
- Blue = new loci
- Red = previously discovered loci

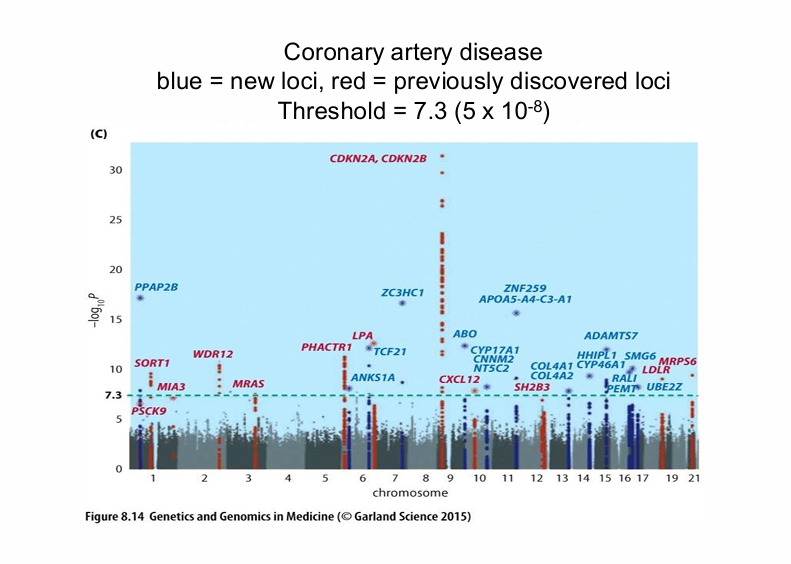
What should you conclude from a cluster of significant SNPs in a Manhattan plot?
A cluster usually indicates:
- Nearby SNPs are in LD with one another.
- The signal points to a genomic region harbouring one or more causal variants.
.
It does NOT automatically mean:
- Every significant SNP is causal.
- The exact risk allele has been identified.

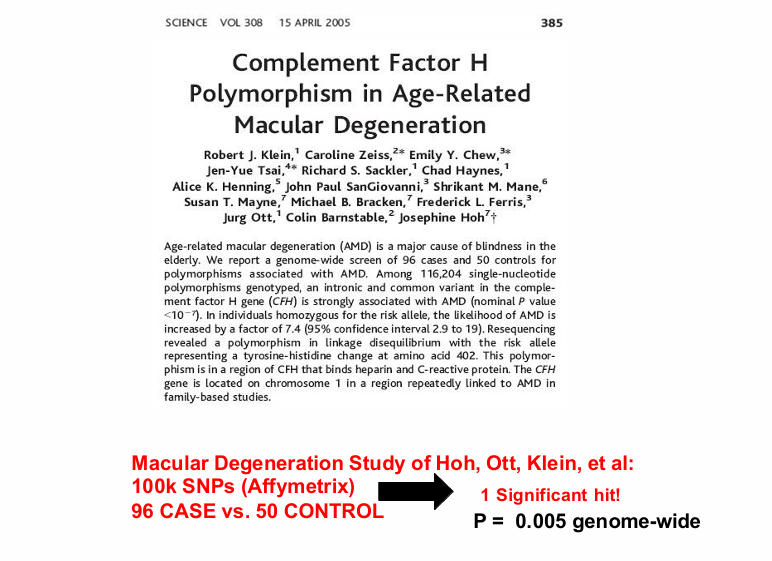
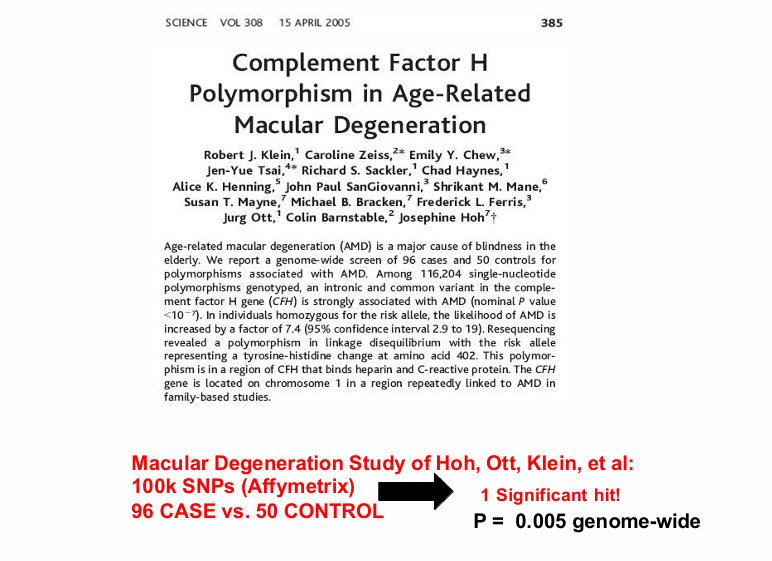
What was one of the first major GWAS success stories?
Age-related macular degeneration.
Study:
Hoh, Ott, Klein et al.
.
Design:
- 100,000 SNPs
- Affymetrix platform
- 96 cases
- 50 controls
- 1 significant hit
- Genome-wide P = 0.005
Associated gene:
Complement Factor H
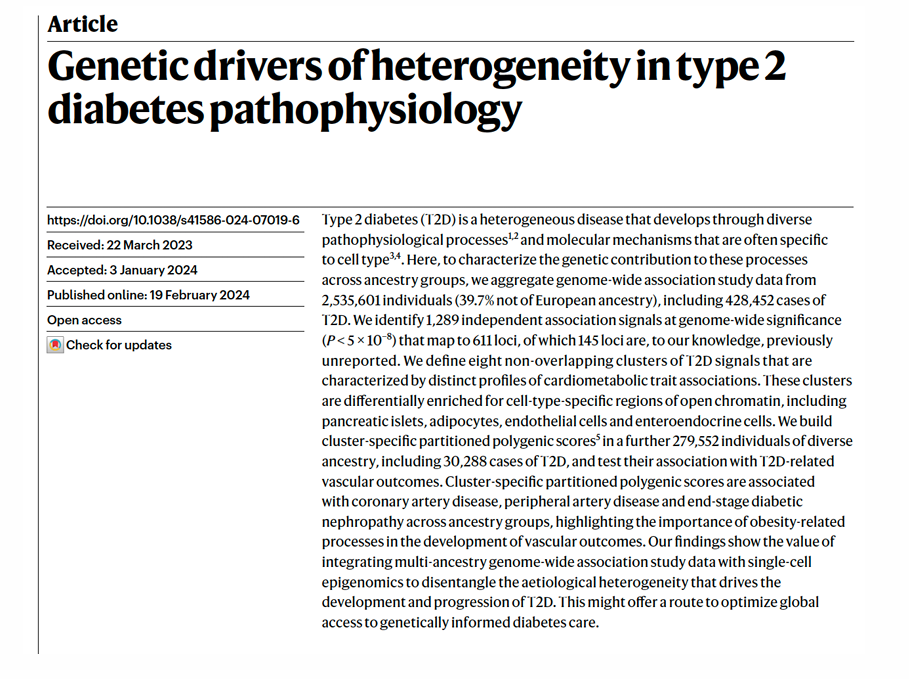
How large was the recent type 2 diabetes GWAS/meta-analysis example?
More than:
- 2.5 million individuals
- 400,000 cases
Lecturer explanation:
Modern GWAS often aggregate data across studies and ancestries to gain power to detect many small-effect associations.


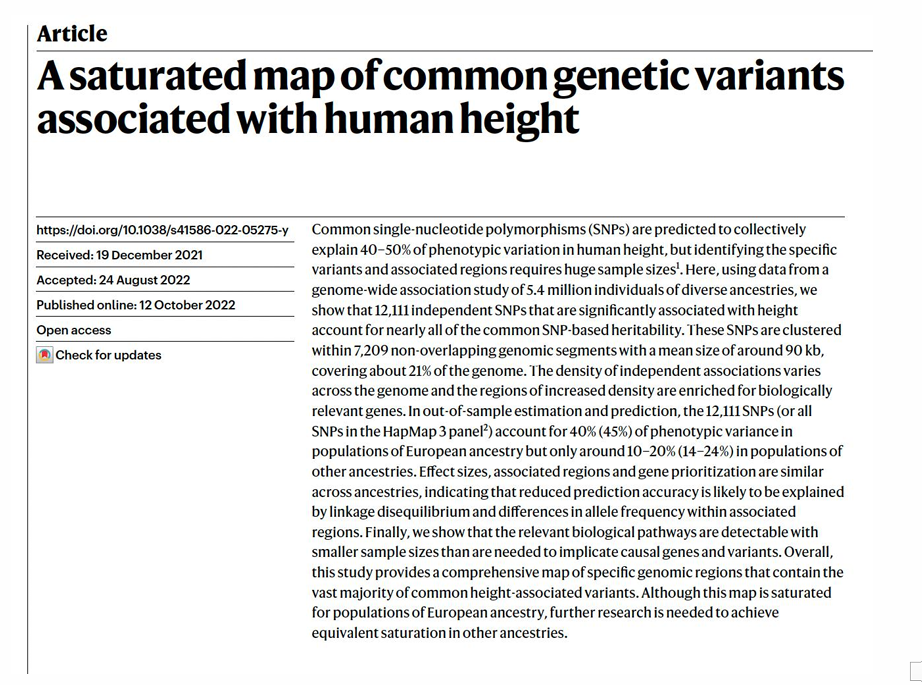
What did the recent human-height GWAS example illustrate?
Study scale:
- More than 5 million individuals
Meaning:
- Very large cohorts are needed to approach saturation of common-variant maps.
- Thousands of independent SNP associations can contribute to a highly polygenic trait such as height.
In what ways have GWAS been successful?
GWAS have:
- Reproducibly and unambiguously identified common genetic variation associated with complex traits.
- Identified ~400 genomic regions associated with ~70 common/complex diseases or traits.
- Revealed biological pathways not previously linked to disease.
Example:
The complement pathway in age-related macular degeneration became strongly established through GWAS.
Why has it been difficult to convert GWAS associations into biological mechanisms?
Because:
- Many signals are not in protein-coding regions.
- Phenotypic heterogeneity complicates association.
- Variant pleiotropy can produce different effects in different settings.
- Very large sample sizes are required.
- Functional interpretation of regulatory/non-coding variants is difficult.
Lecturer explanation:
Many GWAS signals appear to lie in regulatory regions of the non-coding genome.
What is missing heritability?
Missing heritability is the gap between:
- Total heritability estimated for a trait
and
- The smaller proportion of genetic risk explained by known GWAS variants.
What example of missing heritability was given for coronary artery disease?
Estimated heritability:
~40%
Risk explained by known GWAS variants:
~8.9%
Therefore:
A large fraction of the expected genetic contribution is not explained by common GWAS variants.
Why can small GWAS cohorts miss true susceptibility loci?
Common disease variants often have very small effect sizes.
.
Small studies:
- Can detect stronger effects.
- Often lack power to detect weaker effects.
.
Therefore:
Much larger studies or meta-analyses are needed.
.
The lecture states:
GWAS may use 40,000+ individuals to detect more small-effect common variants.
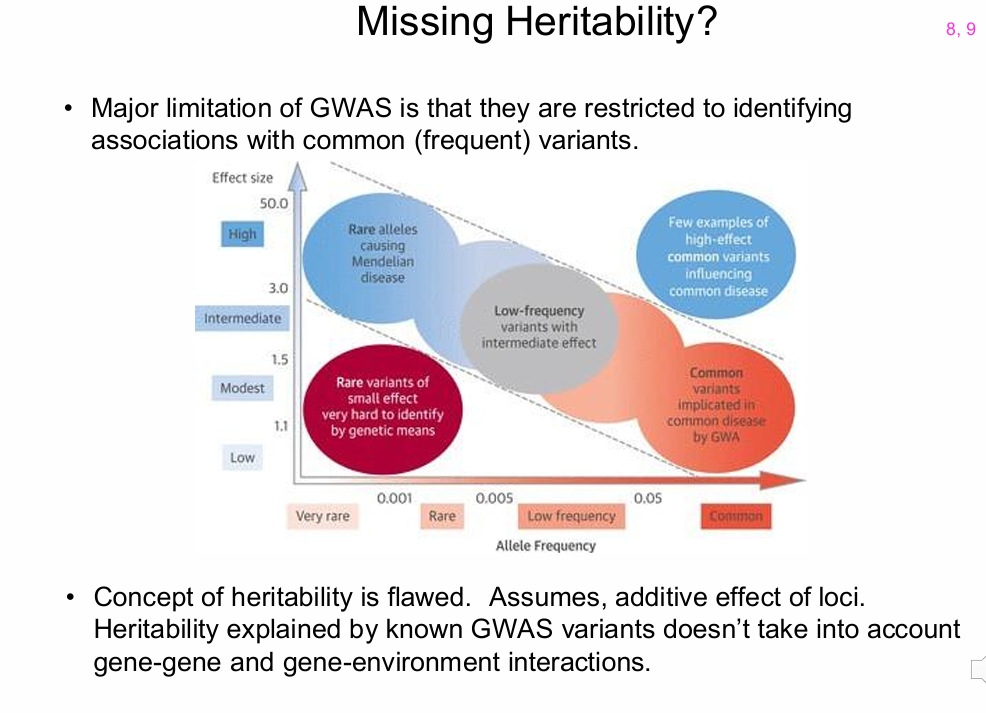
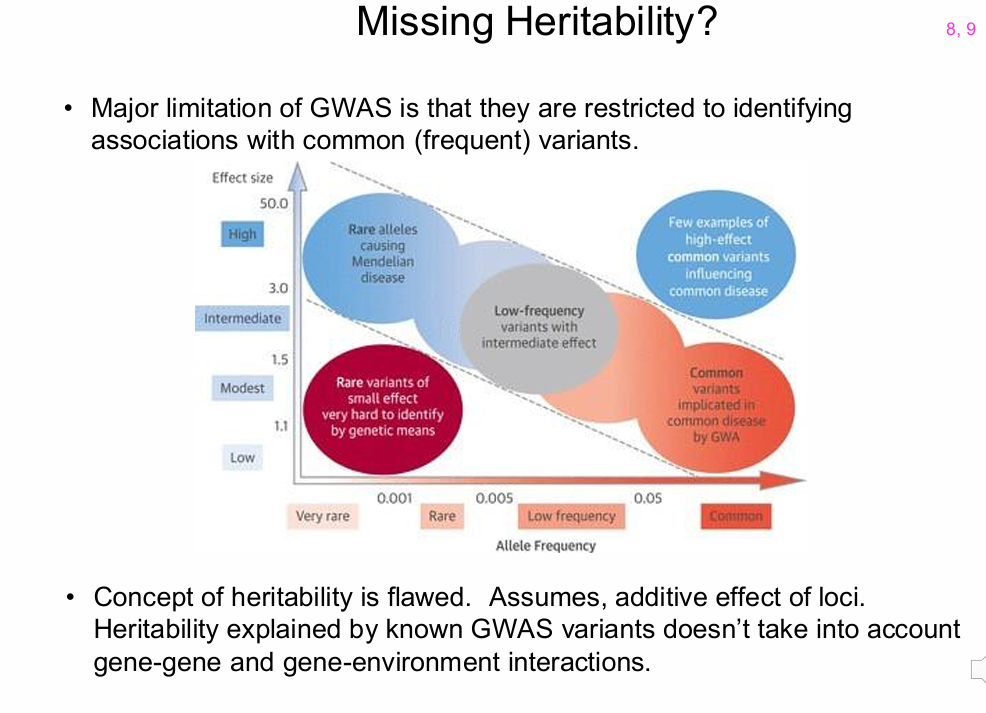
What possible sources of missing heritability were identified?
- Rare variants not captured by common-SNP GWAS
- Gene-gene interactions
- Gene-environment interactions
- The simplifying assumption that loci act additively
- Other genetic architecture not well represented by standard GWAS
Why are rare variants poorly captured by classic GWAS?
Rare variants:
- Often arose more recently.
- Are not well represented by ancient common haplotype blocks.
- May not be tagged by common SNP arrays.
.
Classic GWAS:
- Is optimised for common variants, not rare ones.

Why might rare variants be more useful than common GWAS variants for individual risk prediction?
Common GWAS variants:
- Usually have small effects.
- Often add little beyond existing clinical markers such as lifestyle or cholesterol.
.
Rare variants:
- May have much larger effects.
- One or two such variants may substantially increase risk.
Therefore:
Rare variants could be more informative for personal risk prediction.
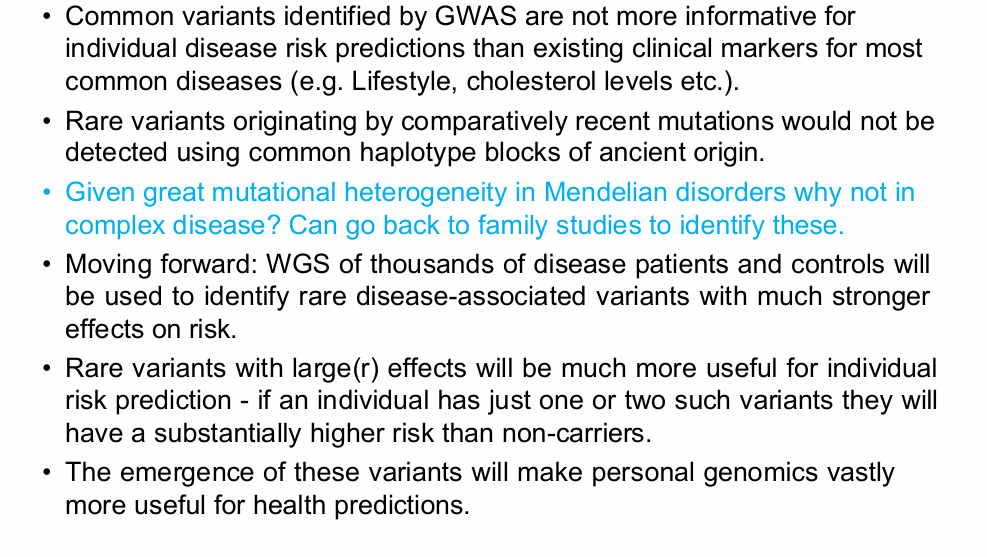
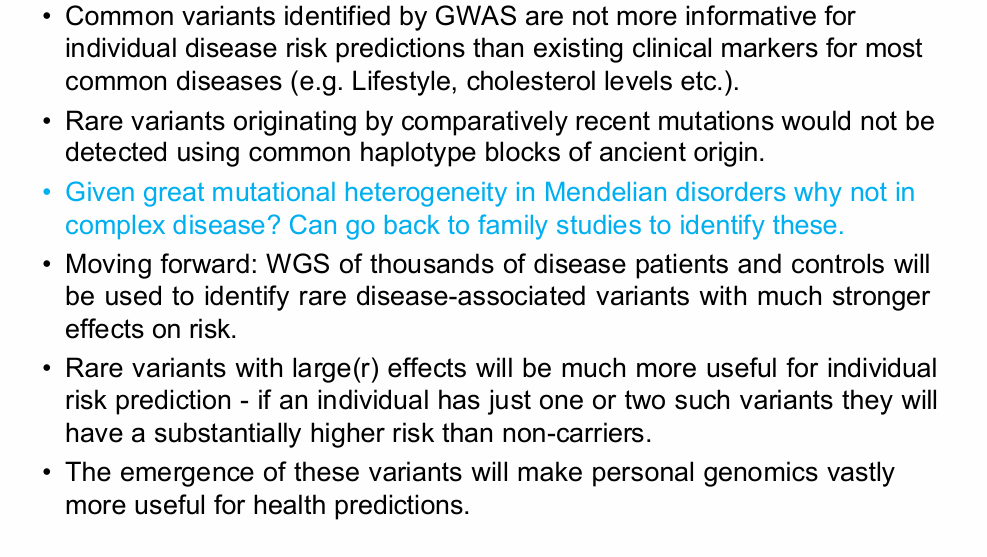
What future strategy did the lecturer describe for identifying rare complex-disease variants?
Whole-genome sequencing (WGS) of:
- Thousands of disease patients
- Thousands of controls
.
Purpose:
- Detect rare variants with larger effects
- Complement SNP-array GWAS
- Improve individual risk prediction
Family studies may also help identify rare, heterogeneous variants.

What are the possible genetic architectures of complex disease described in the lecture?
Complex disease may involve:
- Many common risk loci with individually small effects that collectively disrupt pathways
- Rare variants with larger effects
- Copy-number variants (CNVs)
- Different combinations of risk factors in different individuals
- Epistatic gene-gene interactions
- Tissue-specific variant effects
- Gene-environment interactions
There is no single universal genetic cause.
Why can the same complex disease arise through different genetic routes in different individuals?
Different people may carry different combinations of:
- Common risk alleles
- Rare large-effect variants
- CNVs
- Protective alleles
- Epistatic interactions
Lecturer explanation:
"Many roads lead to Rome" — the same phenotype can arise through different underlying genetic architectures.
How can tissue specificity complicate interpretation of complex-disease variants?
A variant may:
- Be associated with disease in one tissue
- Have the opposite effect in another tissue
.
Consequence:
- Results can be difficult to interpret.
- Tissue context can confound broad genetic associations.
What is the final take-home message about the causes of complex disease?
Genes alone are not the major cause.
Complex disease reflects interaction among:
- Many genetic variants
- Rare and common variants
- Gene-gene interactions
- Tissue-specific effects
- Environmental conditions
- Lifestyle and behavioural factors
Lecturer explanation:
Future progress will rely on large biobanks, improved phenotyping, whole-genome sequencing and integration of genomic with clinical data.