Module 2: Sampling and Introduction to Bivariate Regression
1/52
There's no tags or description
Looks like no tags are added yet.
Name | Mastery | Learn | Test | Matching | Spaced |
|---|
No study sessions yet.
53 Terms
Samples provides estimates of
Population parameters
Whilst samples can be used to make inferences about the population of interest, they can also give…
Biased estimations
Different estimates
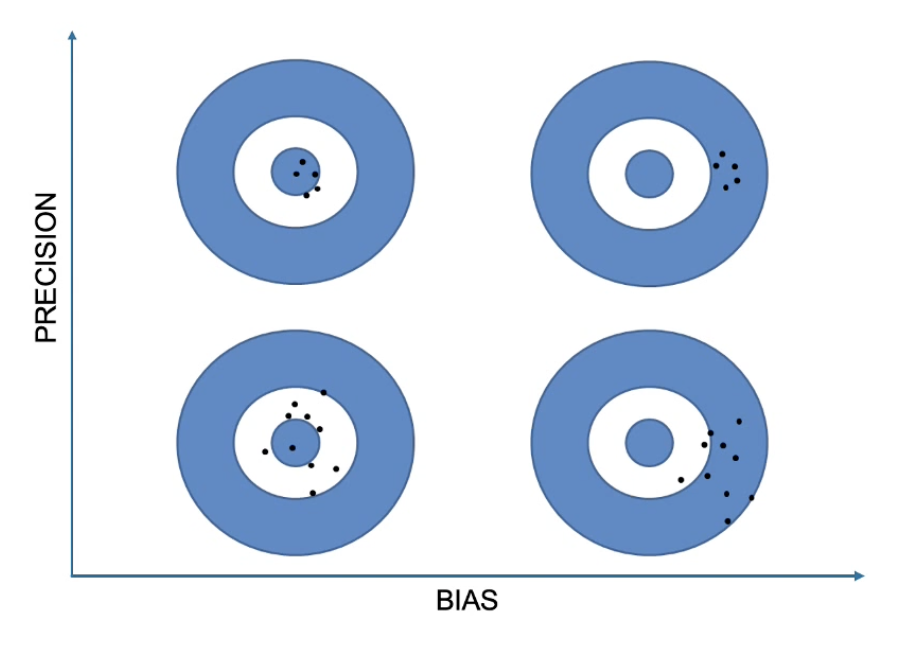
Bias
Refers to accuracy
Aggregated means from samples should equal the population mean
Suggests that the sampling approach tends to zero in on the true underlying parameters
Important for external validity
Think: In a perfect world, if we measured the mean reading abilities of year 6 classes in a primary school, the school mean should be equal to the population mean of Australian year 6 students.
Bias is a function of _________.
Sampling
Ensure to get a sample that best represents the population of interest
Precision
Refers to spread of scores (i.e how much they deviate from the mean)
Measured by standard deviation
High precision means that on average, estimates from each sampling occasion are not far from the mean.
High standard deviation score suggests…
Low precision
Low standard deviation score suggests…
High precision
Precision is a function of…
Sample size
The larger the sample size, the more precise the estimate
Describe the concepts of precision and bias through a target practice analogy. What do the targets look like as precision and bias vary?
Bivariate Regression
Looks at the relationship between one predictor variable and one outcome variable
Think: CorrelationPRO
When conducted, a correlation statistic is obtained along with additional information inc. but not limited to
the slope
the intercept
Equation for a straight line
Y = a + bX
a = the intercept
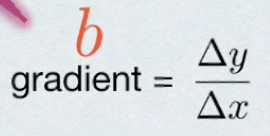
b = the gradient
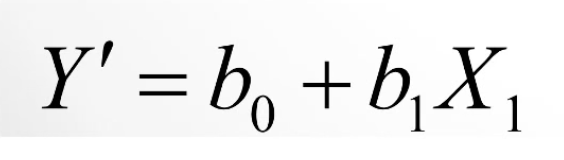
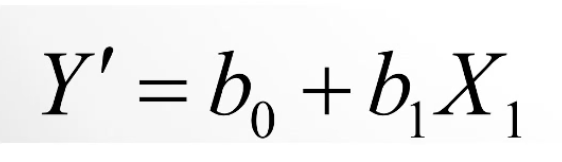
Formula for Line of Best Fit (Regression Line)
Y’ = predicted value of Y
b0= INTERCEPT of the regression line (predicted Y value when x = 0)
b1 = SLOPE of regression line
Y’
Predicted value of Y
b0
INTERCEPT of the regression line (predicted Y value when x = 0)
b1
SLOPE of regression line
Think: Are you thinking what I’m thinking B1? = slippery slope to anarchy
Formula for the gradient
b = (difference between y scores) / (difference between x scores)
Bivariate Regression: The Slope
The rate at which Y changes with each 1-unit change in X
Denoted as b1
Bivariate Regression: The Intercept
Where the line cross the y axis
represented as a
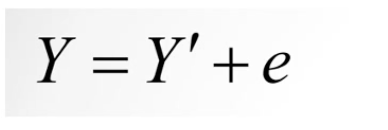
Why is the straight line equation modified in bivariate regressions?
To include a systematic and random component
Called ‘line of best fit’
Systematic Component of line of best fit in bivariate regressions
Shows relationship with predictor variable
Random component of line of best fit in bivariate regressions
Unrelated to predictor
Where do you find the b0 and b1 values in SPSS output?
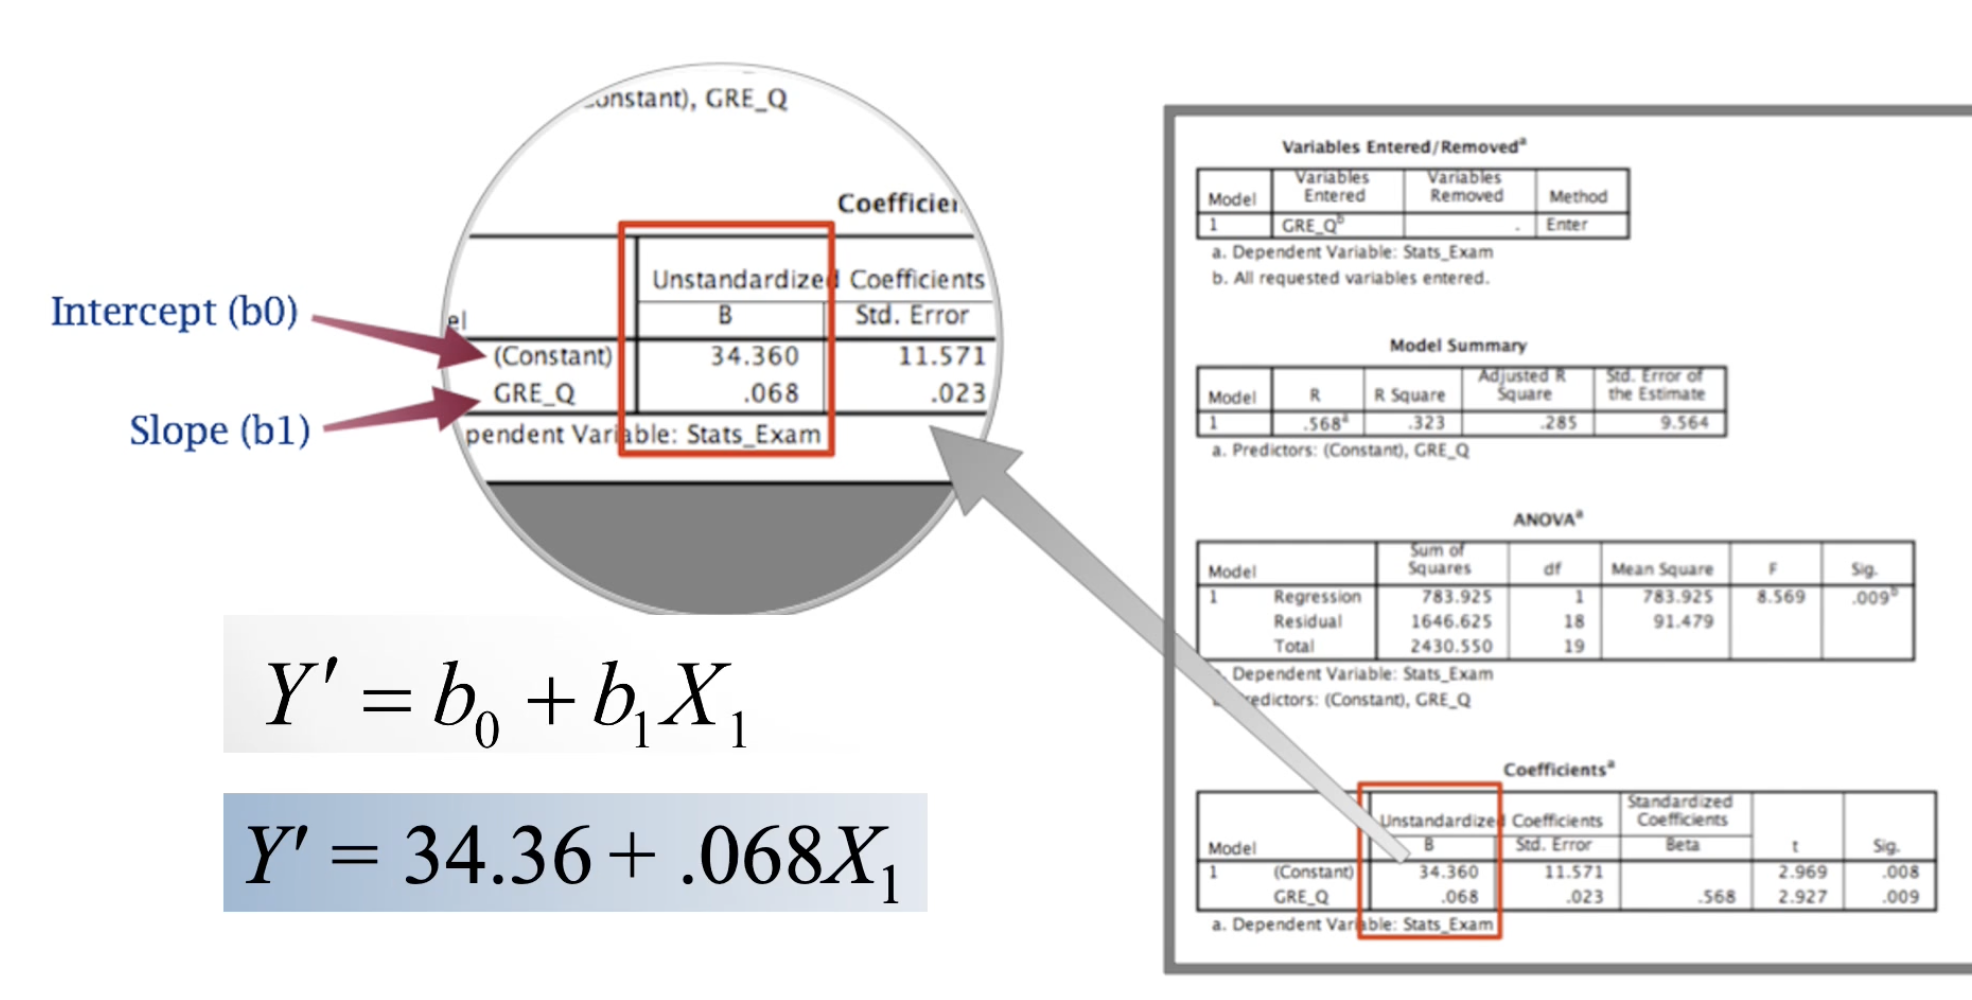
What value in SPSS output from a bivariate regression is the same as the correlation value?
Beta coefficient in the coefficient table
Located next to the b0 and b1 values
Syntax for Bivariate Regression in SPSS
regression var = variable1 variable2
/dep = responsevar
/enter = predictorvar.How can you use the slope and intercept values from SPSS to predict scores?
Find your slope and intercept
Substitute them into the Y’ = b0 + b1X1 equation
Put your x value (predictor value) into X1
Y’ will be your predicted score, which is a plotted point on the line of best fit
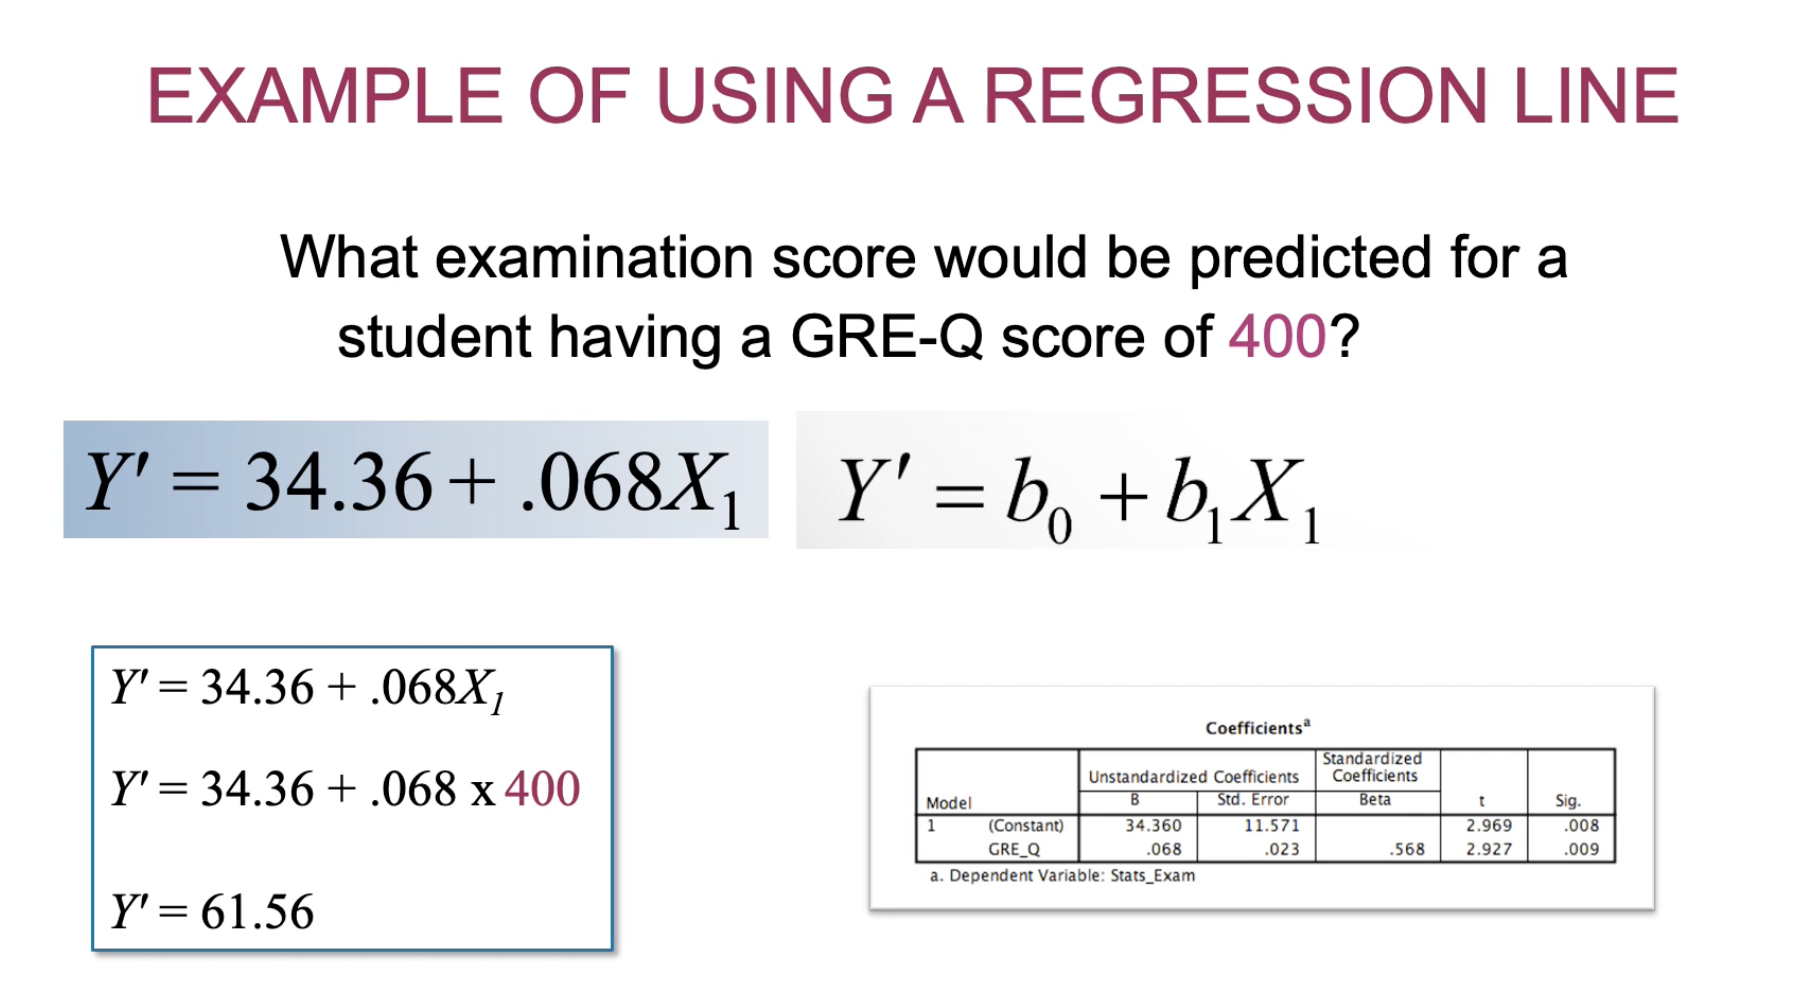
The basic purpose of regression is…
Prediction
Think: A regression is basically a correlation, but if that’s the case, why don’t we just use correlation? Regressions give us the correlation score and a bit more, like the intercept and slope. We can plot a line of best fit on a regression, which gives predictive qualities where there are no data points (not infallible though)
When can errors in prediction arise?
When the residual is not ± 1
r ≠ ± 1
Residual
The difference between the actual score and predicted score
AKA error
Predicted scores are susceptible to error when the residual is more than ± 1
When we are sampling, we are selecting a ______ of a population.
Subset
Using different sampling plans or approaches will ensure….
Accuracy to a certain level in the long run if it is representative.
Define and explain universalistic sampling approaches*
Testing specific theories or hypotheses about the relationships between variables
Research questions are:
How does this work?
What is the mechanism?
Think: The ones we usually do where we are trying to find causation
Define and explain particularistic sampling approaches*
Primary goal is statistical estimation
Try to capture the range of the underlying parameters
Descriptive hypotheses
Research questions include:
How many people think like this?
How many people have this disorder?
How many people would benefit from this treatment?
Think: Trying to find information about the variable, not the relationship between them.
Probability Sampling
Based on random sampling approaches such as:
Simple Random Sampling
Stratified sampling
Cluster sampling
Simple Random Sampling (SRS)
Every member of the population has an equal and known chance of being selected
Gold standard but requires very large samples
Can be expensive and not always feasible
Think: Dury Duty is serious (SRS)
Every adult in the population sample frame) can be selected for dury duty and they know this
Stratified Sampling
The population is divided into subpopulations in some meaningful way to ensure all populations are sampled appropriately
Strata (subgroups) are created based on particular characteristics
Age, gender, profession, etc
You should sample proportionally to the population
I.e. If 70% of psych students are female and that is your population of interest, in a sample of 100, 70 should be female.
Cluster Sampling
Uses subgroups in the population, but samples the entire subgroup rather than basing it on subgroup proportions
Think: If you were interested in Year 9 attitudes towards university, you would sample the subgroup of ‘year 9 students’ from a range of schools.
Advantages of Probability Sampling
We have a known or estimated probability of inclusion for each sample element which can be factored into final sample
Lower risk of sampling bias
Greater external validity
Disdvantages of Probability Sampling
Expensive
Often not feasible
Non-probability sampling approaches*
Uses non-random approaches and therefore not every person in the population of interest has an equal and known chance of being included.
Includes:
Convenience sampling
Purposive sampling
Snowball sampling
Quota sampling
Convenience Sampling
Involves recruiting from a sample of participants that the researcher has access to
Recruiting whoever we can get
Most widely used type of sampling in psychology
Unknown bias can be controlled by increasing precision through sample size
Purposive Sampling
Judgement sampling or known groups sampling
Researcher makes a judgement based on their expertise to select the best sample
Snowball Sampling
Involves having participants recruit other participants with an increasing number of participants
Think: Pyramid scheme
Quota Sampling
Effectively the same as stratified sampling but using a non-random approach
Think: If 10% of the population in your community were teachers, so you surveyed a bunch of teachers outside of a teacher’s convention. You’d meet your 10% quota but because they travelled to the place, they would not represent the views of teachers in that community.
Advantages of Non-probability samples
Cheaper
Easier to access
Larger samples affords greater precision
Disadvantages of Non-probability samples
Probability of inclusion is unknown and cannot be calculated
High risk of unknown bias
Bias results in abiguity of results
limits external validity (generalisability)
Define a sampling frame*
A list of people from a population of interest from which we can draw our sample
List should include the entire population and only those in the population
Key to probability sampling
Serves as a conduit to the population
Think: Phone book, class list, electoral role
Dummy Variables
Categorical variables that have values of 0 and 1
Dummy Variable Conventions
Largest category is assigned as value ‘1’
Name the dummy variable after the category assigned variable ‘1’
Cronbach’s Alpha
A measure of internal consistency/reliability.
a = >0.70 → adequate reliability
a = >0.80 → good reliability
a = >0.90 → excellent reliability
0.7 is the benchmark! If it’s less; forget it
3 Strategies for making coding easier in a questionnaire
Put answer blocks in left margin
Have respondents put their answers on a separate answer sheet
Have Ps put their responses on a coding sheet that can be marked electronically
In what sampling method do people have an equal chance of being selected?
Random sampling
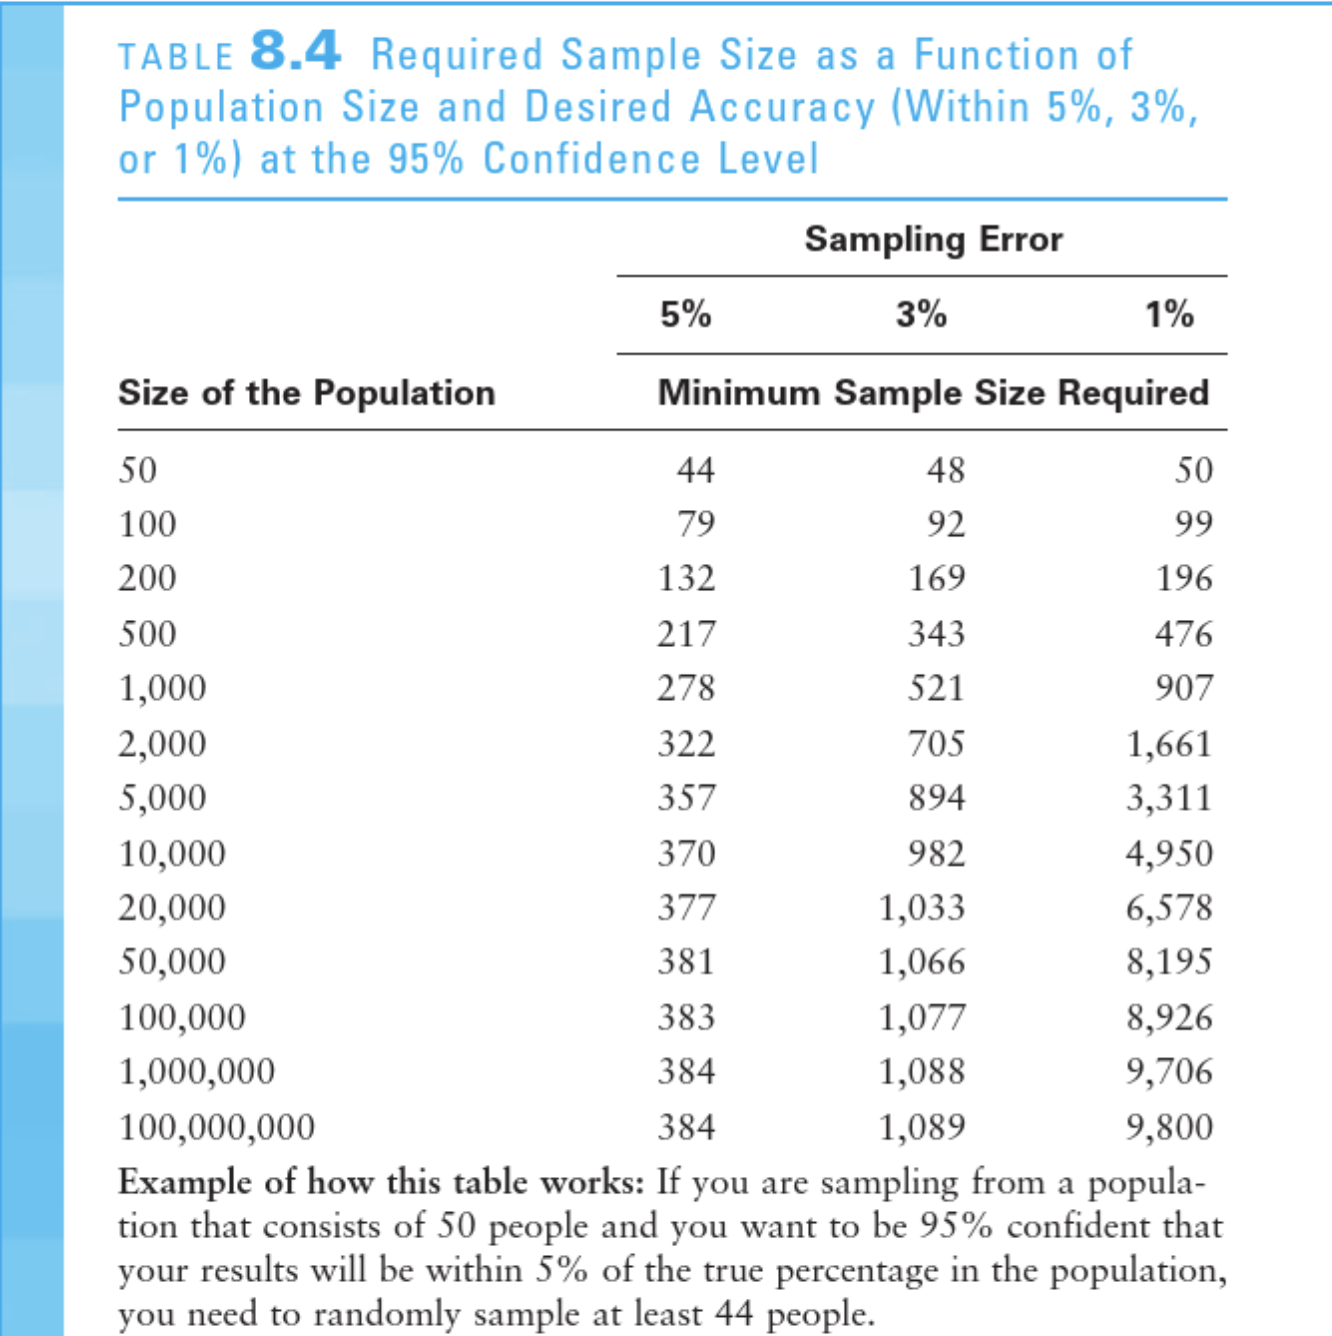
When determining the required sample size for random sampling methods, what happens to the sample size as the confidence level increases (error margin decreases)?
The required sample size increases
Rank the following sampling techniques in order of most representative samples to least
Quota sampling
Proportionate stratified random sampling
Random sampling
Convenience sampling
Proportionate stratified random sampling
Random sampling
Quota sampling
Convenience sampling