Kin 483-Ch.2: Organizing and Displaying Data
1/6
Earn XP
Description and Tags
Exam 1
Name | Mastery | Learn | Test | Matching | Spaced |
|---|
No study sessions yet.
7 Terms
Organizing Data: 3 Types of Distribution Tables
What happens if you collect data on: weight, height, gender, physical activity, muscular strength, muscular power?
You must organize raw data to get valuable information
Distributions tables can help! (not a statistical procedure)
3 Types of Distribution Tables:
Rank Order Distribution
Simple Frequency Distribution
Grouped Frequency Distribution
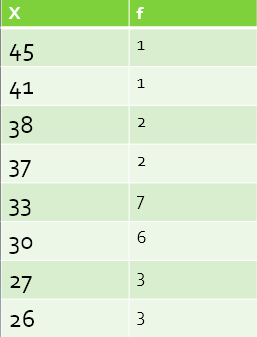
Rank Order Distribution
Ordered listing of data (low to high, high to low) in a single column
Good for small data or when data can be viewed on 1 page
Can easily view the range
Range: numerical value from highest to lowest
Formula: Range = Highest Value – Lowest Value
X represents a variable (vertical jump)
N (number of observations) = 9
H = 45
L = 26
Range = 45-26=19

Simple Frequency Distribution
Used with larger data sets
N > 20
R ≤ 20
Contains 2 columns: 1 for the variable, 1 for the frequency
Allows you to fit data on 1 page = easier viewing
X = Variable of Interest
f = number of cases at each value of X
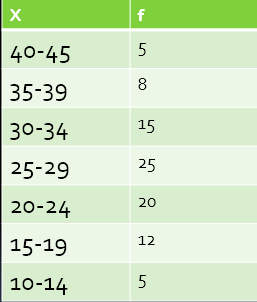
Grouped Frequency Distribution
Used for data with large ranges
Contains 2 columns: 1 for groups of the variable of interest, 1 for the frequency
No specific rule for sizes
Don’t make groups too big – hides information
Don’t make groups too small – defeats the purpose of grouping
Disadvantages:
information about individual is lost
No distribution if you look within a group
What if you have decimals?
Round up & down
84.4 = 84
84.5 = 85
Graphs
Visual representations of data
We can use a variety of graphs to display data in various ways
Bar Graph or Histogram
Line Graph or Frequency Polygon
Cumulative Frequency Graph
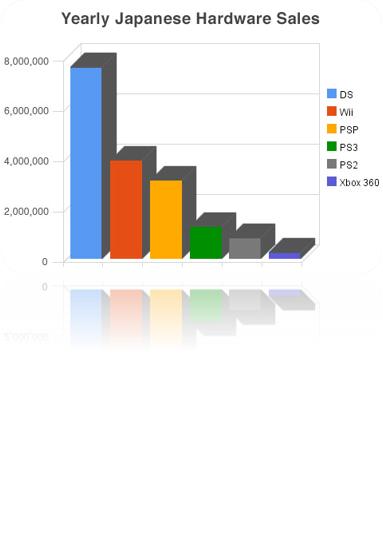
Bar Graph or Histogram
Bars on the x-axis represent the groups
Frequency is plotted on y-axis
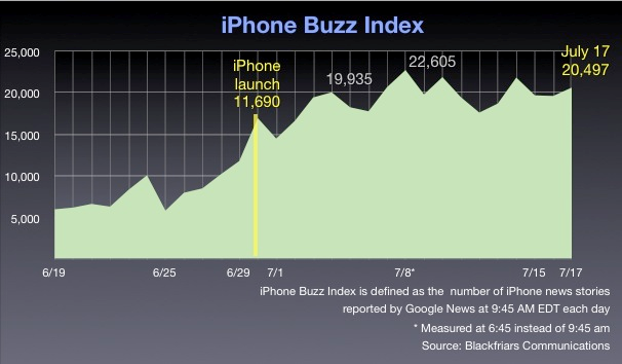
Line Graph or Frequency Polygon
Amount of articles written about iPhone in 1 month period of time
Dip when iPhone launches so that writers could review iPhone