Unit 9 (STATS - 1000)
1/58
There's no tags or description
Looks like no tags are added yet.
Name | Mastery | Learn | Test | Matching | Spaced | Call with Kai |
|---|
No analytics yet
Send a link to your students to track their progress
59 Terms
Summary of Learning Outcomes
Sampling distribution of a sample proportion
Confidence intervals and hypothesis tests for a population proportion
Sample size calculation for estimating a population proportion
What did we do in unit 5
we studied the sampling distribution of the sample mean ¯X
What do we do with sample proportions in unit 9?
Now, suppose that instead of being interested in the mean of some variable X , we are interested in the proportion of individuals in some population who possess some characteristic
What are we interested in (unit 9)
Interested in the proportion of individuals in some population who possess some characteristic
Example: We might be interested in...
The proportion of people with brown eyes
The proportion of defective items produced in a large factory
The proportion of voters who support the NDP
What is the population proportion denoted as?
p
What is the sample proportion denoted as?
p^(p-hat)
how do you find p^
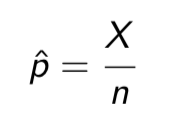
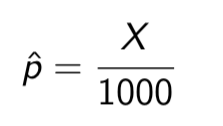
Take a sample of size n, and count the number of individuals X who possess some characteristic (we call X the number of “successes”).
Then the sample proportion is
Is p a parameter or a statistic?
p is a parameter.
is p^ (p~hat) a parameter or a statistic?
p^ is a statistic
What do we let p^ be in (distribution of a sample proportions)
be the sample proportion of successes in a simple random sample drawn from a large population having population proportion p of successes.
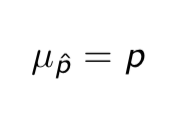
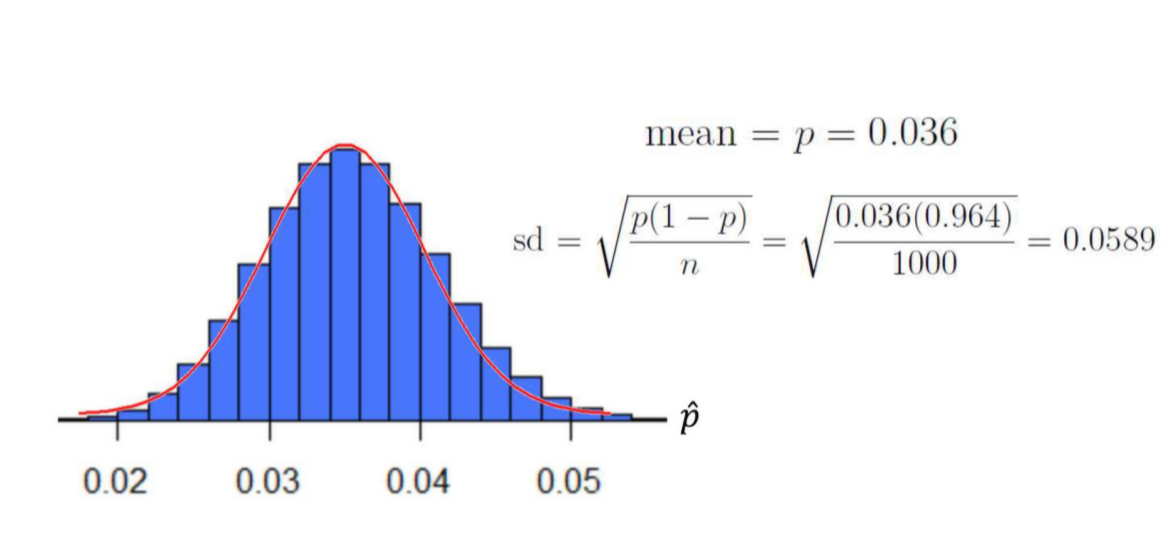
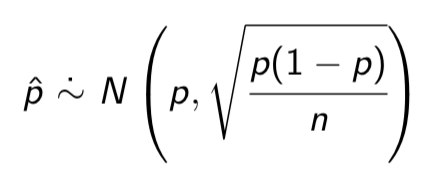
Mean of p^
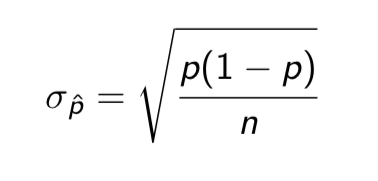
Standard deviation p^
Example: The true proportion of Canadians who live in Manitoba is p = 0.036.
Suppose we didn’t know this true proportion, and wanted to estimate it (our populations of interest are often very large, so we often won’t know the true value of p)
We could take a sample of n = 1000 Canadians, and count the number of people X in our sample who live in Manitoba. The sample proportion of Manitobans in the sample is then
illustrate the sampling distribution of ˆ p:
Imagine taking millions of random samples of 1000 Canadians and calculating the sample proportion of Manitobans ˆ p for each sample
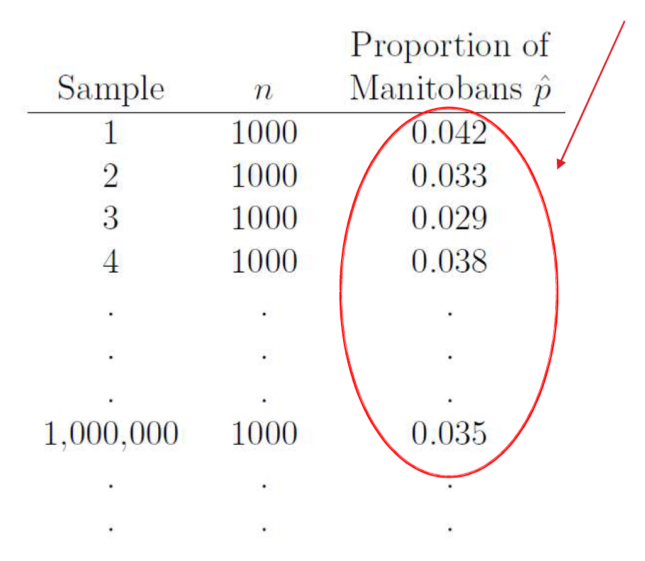
Imagine taking millions of random samples of 1000 Canadians and making a histogram
What do we notice? (About millions of random samples of 1000 Canadians)
Sampling distribution of ˆp is approximately normal!!
The Central Limit Theorem says that if a variable represents a sample mean, then the sampling distribution of the variable is approximately normal when n is high.
What do we think of ˆp
Type of sample mean, because they are calculated similarly
how do you calculate ˆp
we are adding up the number of successes and dividing by the sample size n
When the sample size (n) is high (How high??)
We can safely use this approximation provided that np ≥ 10 and n(1 – p) ≥ 10, and that the population is very large compared to the sample.
Probability that sample proportion ˆp falls in a particular interval
equal to the area underneath the density curve corresponding to that same interval.
How do we find the area underneath the density curve corresponding to that same interval?
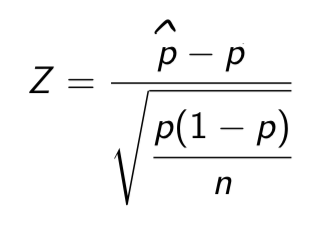
To find these areas, we standardizeˆp (i.e. turn it into Z ):
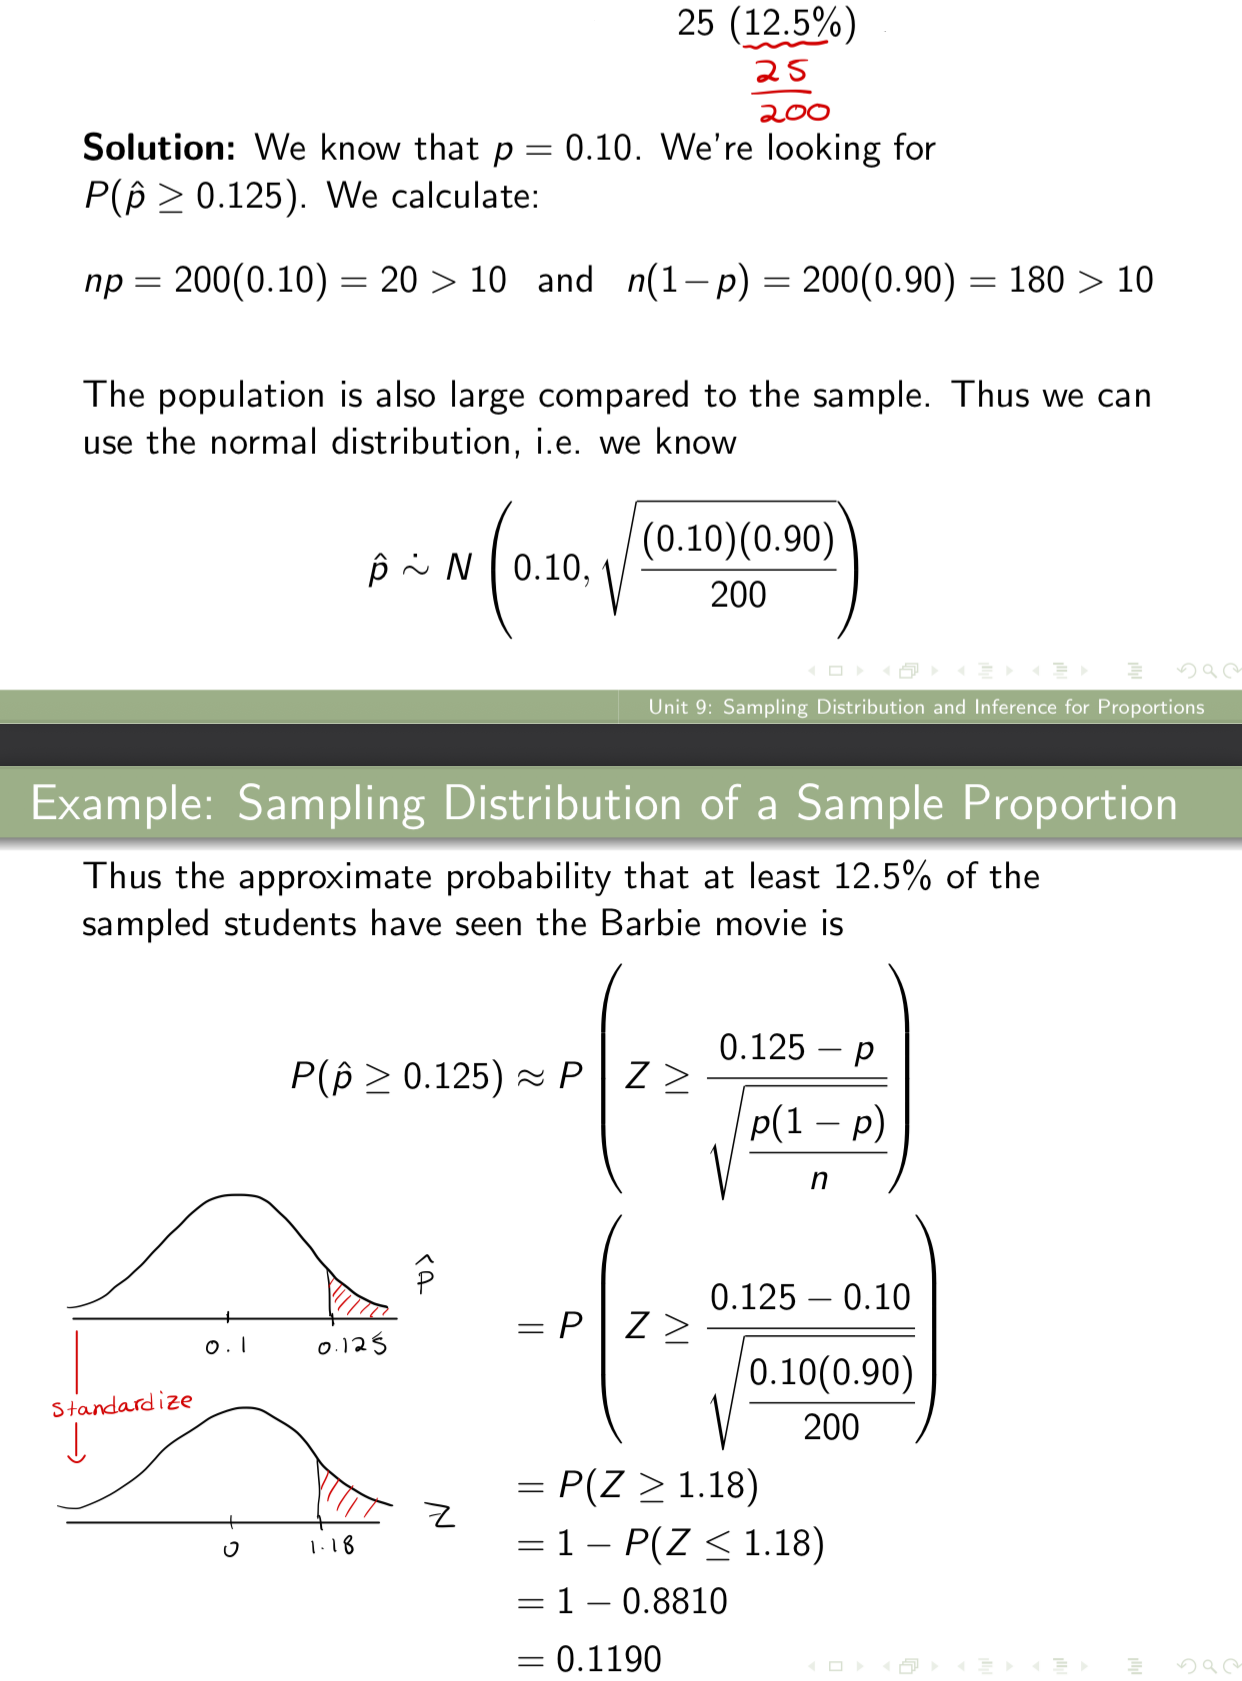
Example: Suppose we randomly select 200 UM students and ask them whether they watched the Barbie movie. Assuming 10% of all UM students have seen the Barbie movie, what is the approximate probability that at least 25 (12.5%) of the sampled students have seen the Barbie movie?
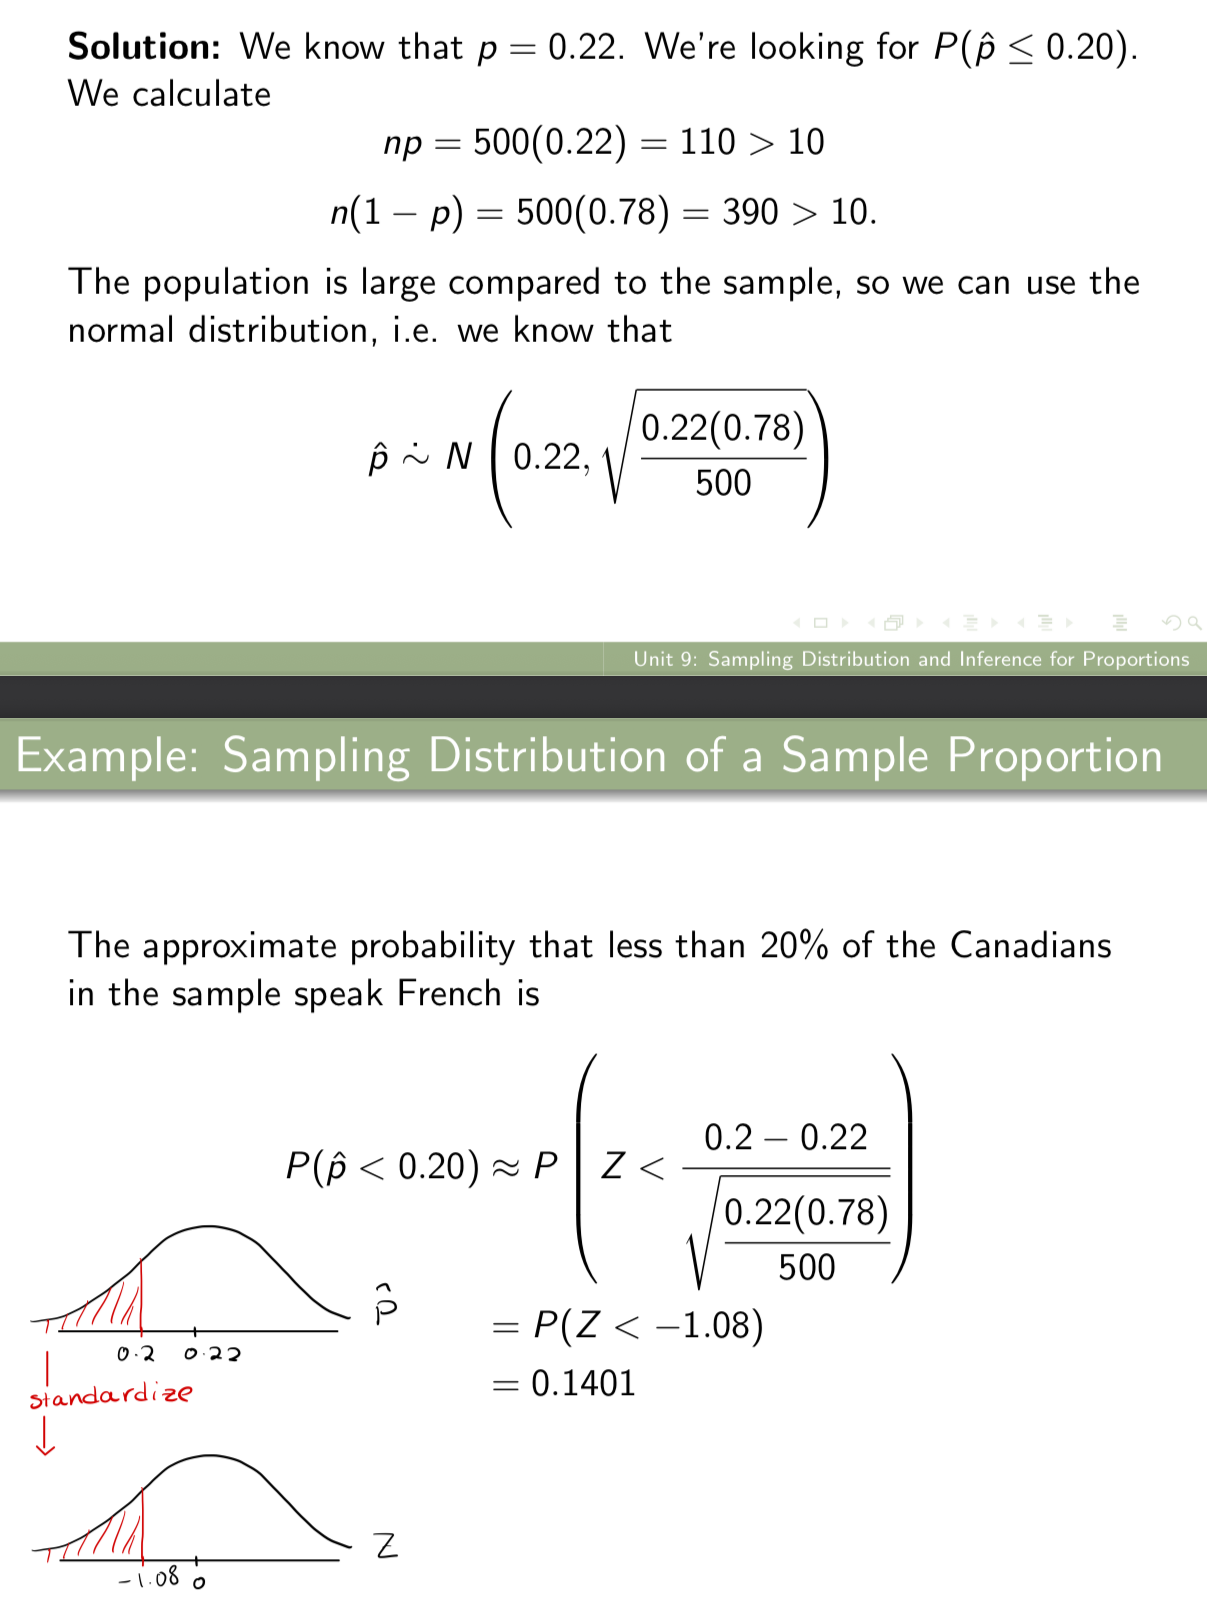
Example: Suppose it is known that 22% of Canadians speak French. If we take a random sample of 500 Canadians, what is the approximate probability that less than 20% of them speak French?
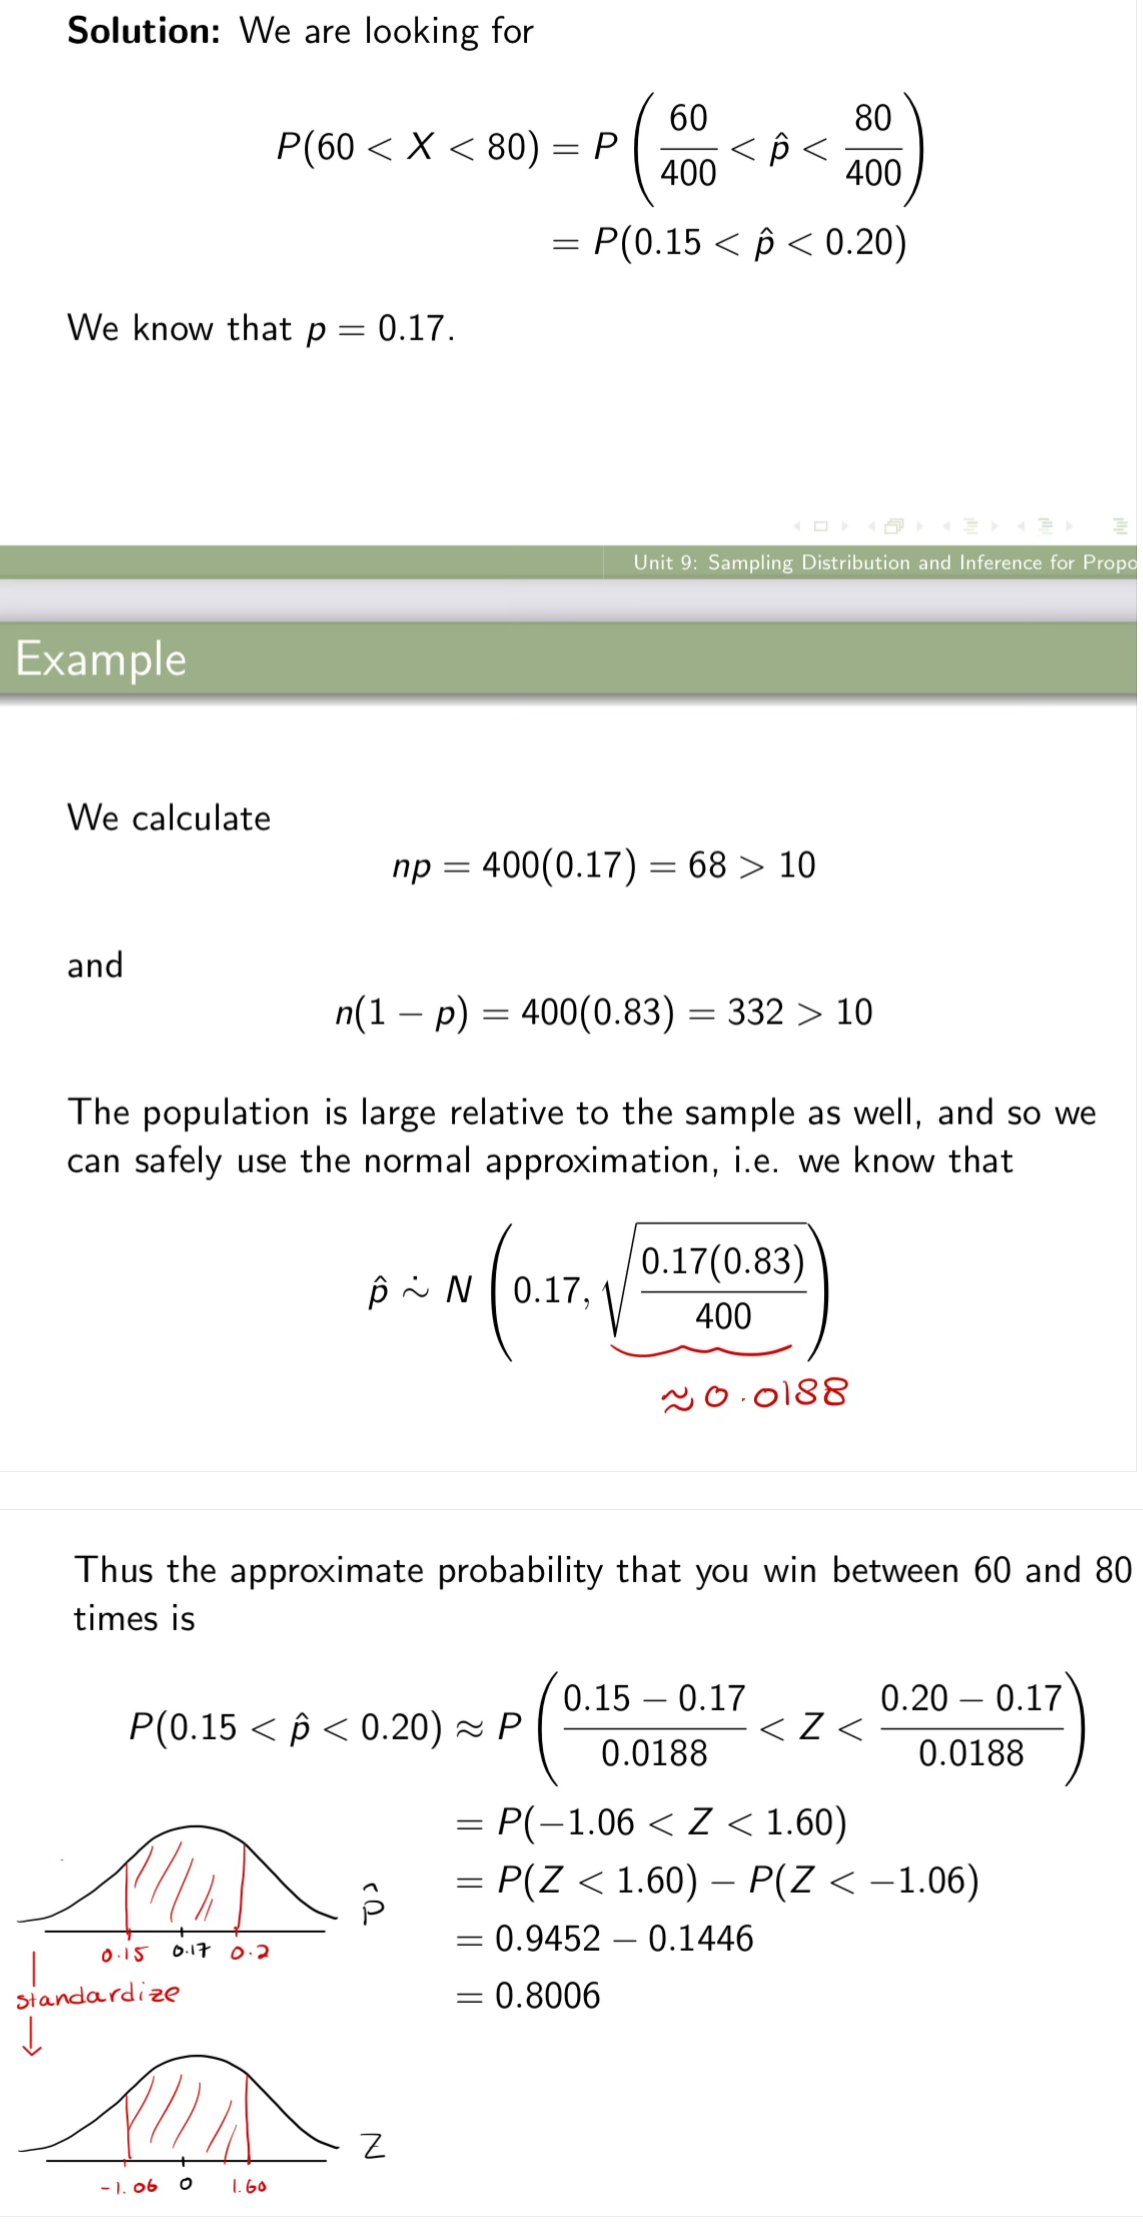
Example: A slot machine wins on 17% of all spins. If you spin the slot machine 400 times, what is the approximate probability you win between 60 and 80 times?
Examining interference methods (confidence intervals and hypothesis testing)
For the case where the parameter of interest is some population proportion p (instead of the population mean µ)
Recall: In order to use the normal distribution when doing probability calculations for ˆp
we required that np ≥ 10, And n(1 — p) ≥ 10, and that the population was large relative to the sample.
In interference are we expected to verify the np ≥ 10, And n(1 — p) ≥ 10
You are not expected to formally verify this when performing inference for p: you may assume these conditions hold, and thus the use of normal distribution will be justified.
Suppose that we take a SRS of n individuals and calculate the proportion ˆp that possess some characteristic of interest.
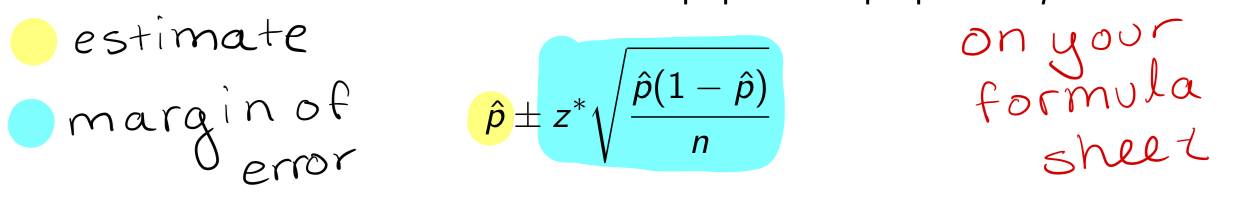
A level C confidence interval for the population proportion p is
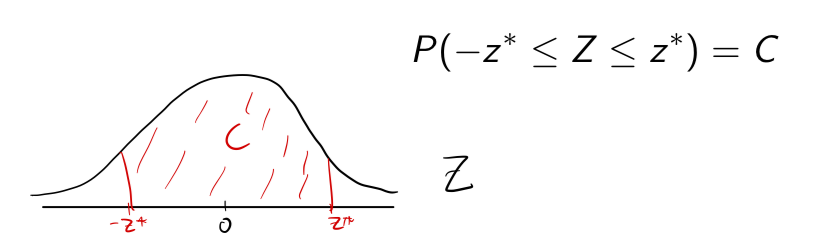
where z* is the value of Z such that
A level C confidence interval for the population proportion p is (SRS of n individuals)
where z* is the value of Z such that
where z* is the value of Z such that (SRS of individuals)
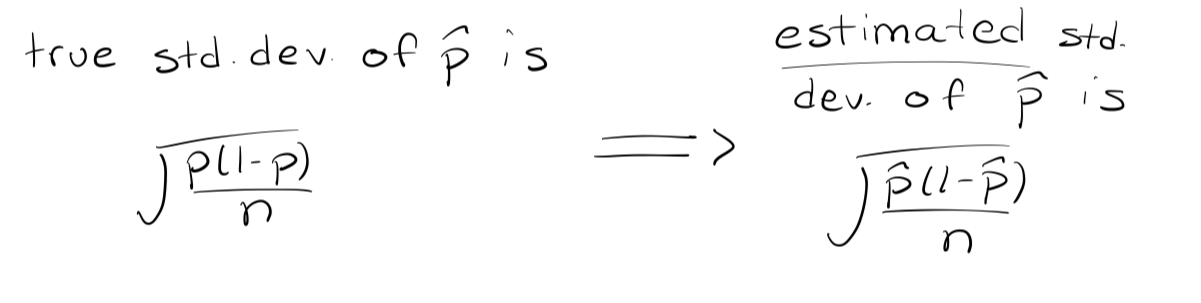
What would we ideally like to use in the formula?
we would like to use the true standard deviation of ˆ p in the formula.
Standard error of p^
is an estimate of the standard deviation of the sampling distribution of the sample proportion, computed using the sample size and the sample proportion itself.
But we don’t know p so what do we do?
so we estimate it by ˆ p, and we estimate the standard deviation by the standard error of ˆ
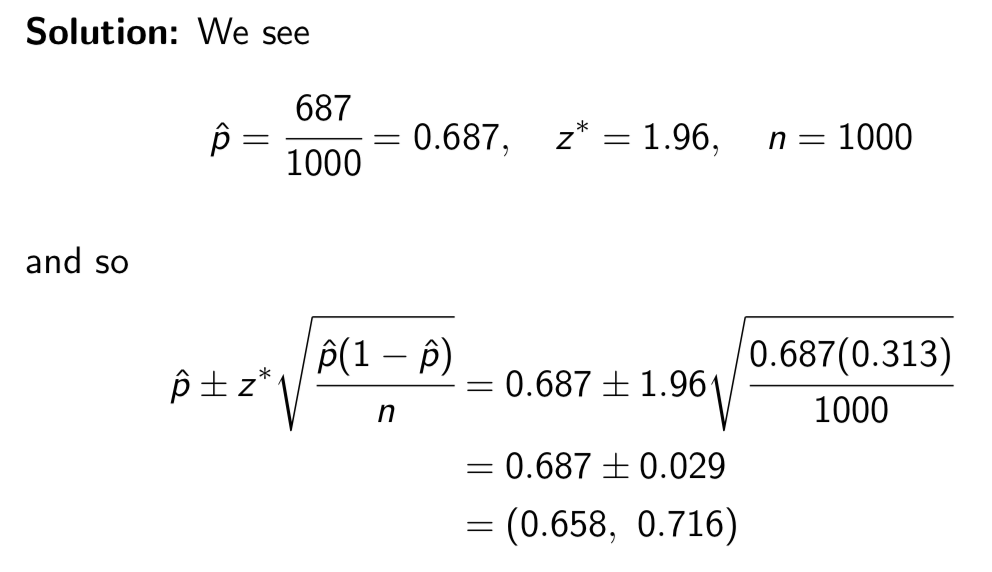
Example: In a survey of 1000 American voters, 687 said they support stronger gun control laws. Calculate a 95% confidence interval for the true proportion of American voters who support stronger gun laws.
Interpretation: “If we repeatedly selected random samples of 1000 American voters and constructed the confidence interval in a similar manner, then 95% of such intervals would contain the true proportion of voters who support stronger gun control laws”
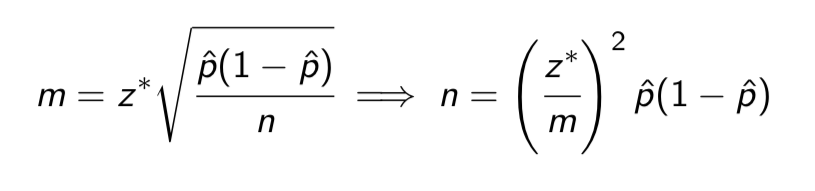
select a sample of individuals large enough to estimate some population proportion p to within a specified margin of error m, with a given level of confidence.
But we have a problem here! We have not yet selected any sample. So we couldn’t possibly know the value of ˆ p!
We will have to use some other value p* to estimate the population proportion p
We will have to use some other value p* to estimate the population proportion p
Use an educated guess for p*, or
Use a conservative estimate p* = 0.5
Why do we use a Use an educated guess for p*, or Use a conservative estimate p* = 0.5?
This will result in a margin of error no greater than m, regardless of the sample proportion ˆp
i. e. if p^ ends up being far from 0. 5 then the, Conf . interval we calculate would have a margin of error even smaller than what we wanted
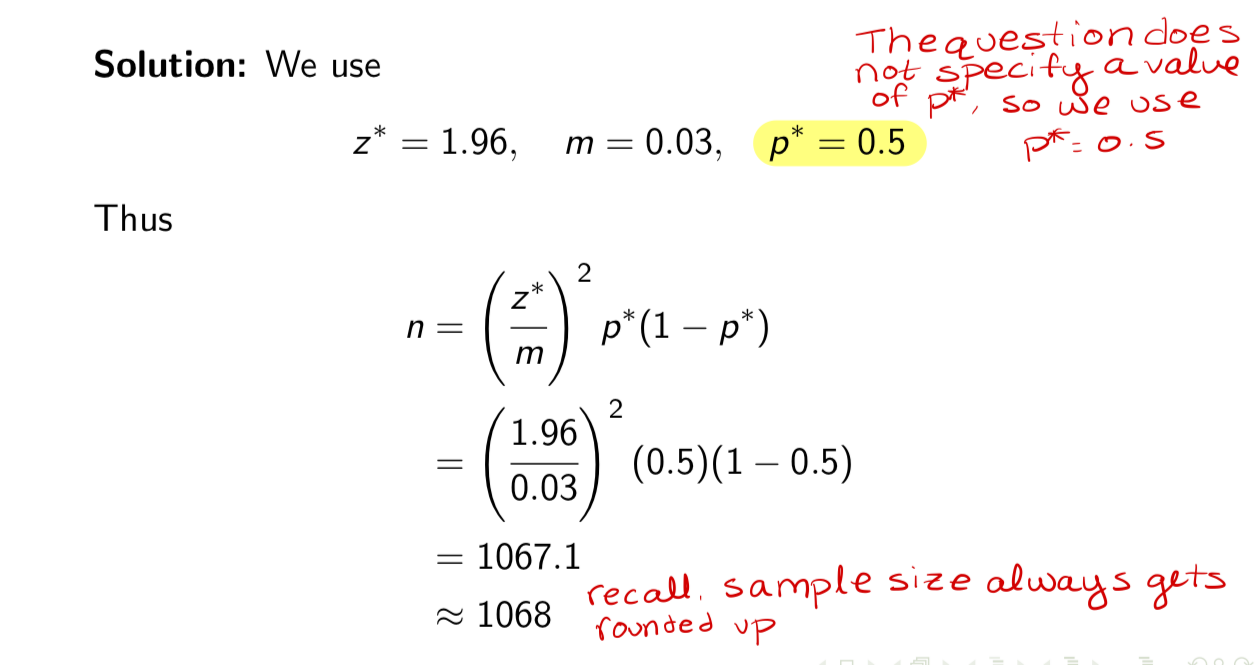
STAT 1000 rule: if we do not tell you what value of p*
Then you should always use p* = 0.5
Example: Suppose we would like to take a sample large enough to estimate the true proportion of all consumers who prefer Pepsi over Coke to within 3% with 95% confidence. What sample size is required?
Note: Using the conservative estimate p* = 0.5 in this case does not result in a much higher sample size than if we had used an educated guess such as p* = 0.3 or p* = 0.7, for which the sample size would have been n = 897 (exercise: check this!!)
However, if we know the sample proportion will be quite far from 0.5, we may want to use an educated guess for p*
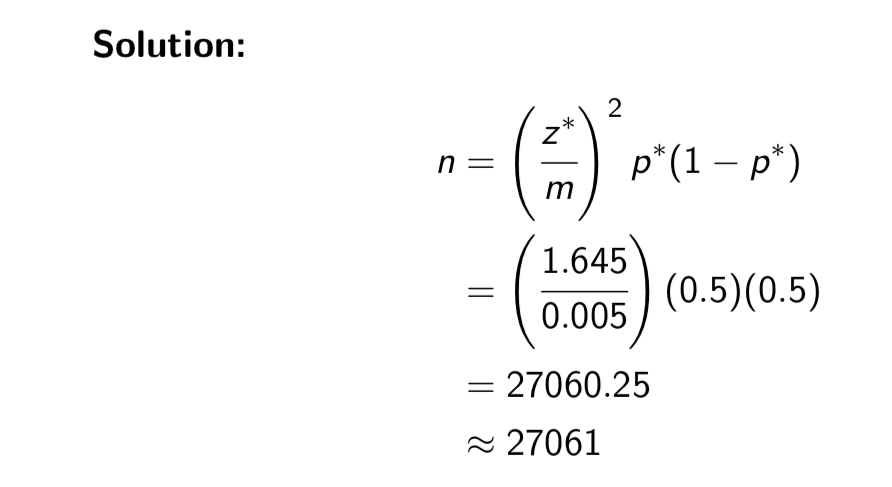
Example: Suppose we would like to estimate the true proportion of all Canadians who are military Veterans to within 0.005 with 90% confidence.
If we use p* = 0.5, what sample size do we require?
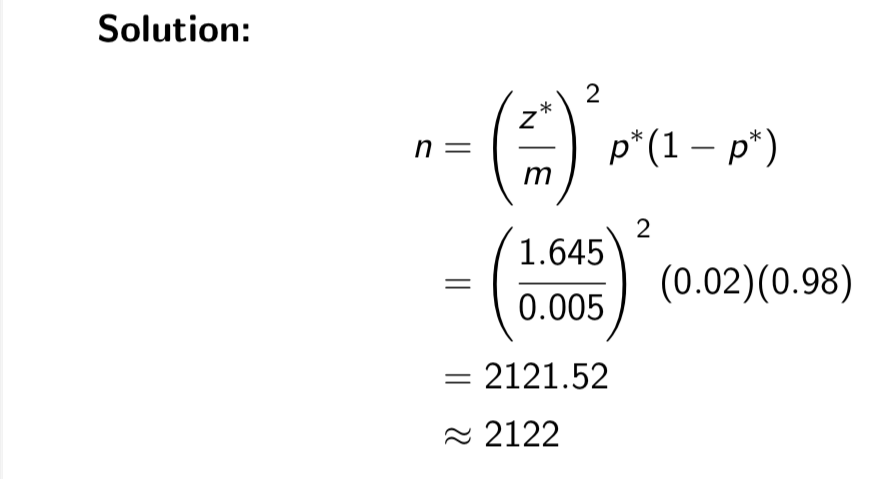
Realistically, we know that the proportion of people who are Veterans is much lower than 0.5. Suppose we believe the true proportion is somewhere close to 0.02. What sample size do we require?
Example: Suppose we would like to estimate the true proportion of all Canadians who are military Veterans to within 0.005 with 90% confidence.
If we use p* = 0.5, what sample size do we require?
Example: Suppose we would like to estimate the true proportion of all Canadians who are military Veterans to within 0.005 with 90% confidence.
Realistically, we know that the proportion of people who are Veterans is much lower than 0.5. Suppose we believe the true proportion is somewhere close to 0.02. What sample size do we require?
this tells us we should use p*= 0. 02
We see that we would be taking a much larger sample if we used
p* = 0.5.
Sometimes we see that we would be taking a much larger sample if we used p* = 0.5.
This would end up giving us a confidence interval with a margin of error much smaller than what we originally wanted
A small margin of error is good, but we had decided we were happy estimating the true proportion to within 0.5%.
We see that if we use a more reasonable value of p* (0.02), we need to sample more than ten times fewer individuals (which is a good thing!!!! This saves a lot of time, money, and work)
What also can we do for a population proportion?
We can also conduct hypothesis tests for a population proportion p, using the P-value method
conducting hypothesis tests for a population proportion p, using the P-value method
The overall steps are the exact same as in unit 7
Our hypotheses will always be in terms of p
Our test statistic will always be Z
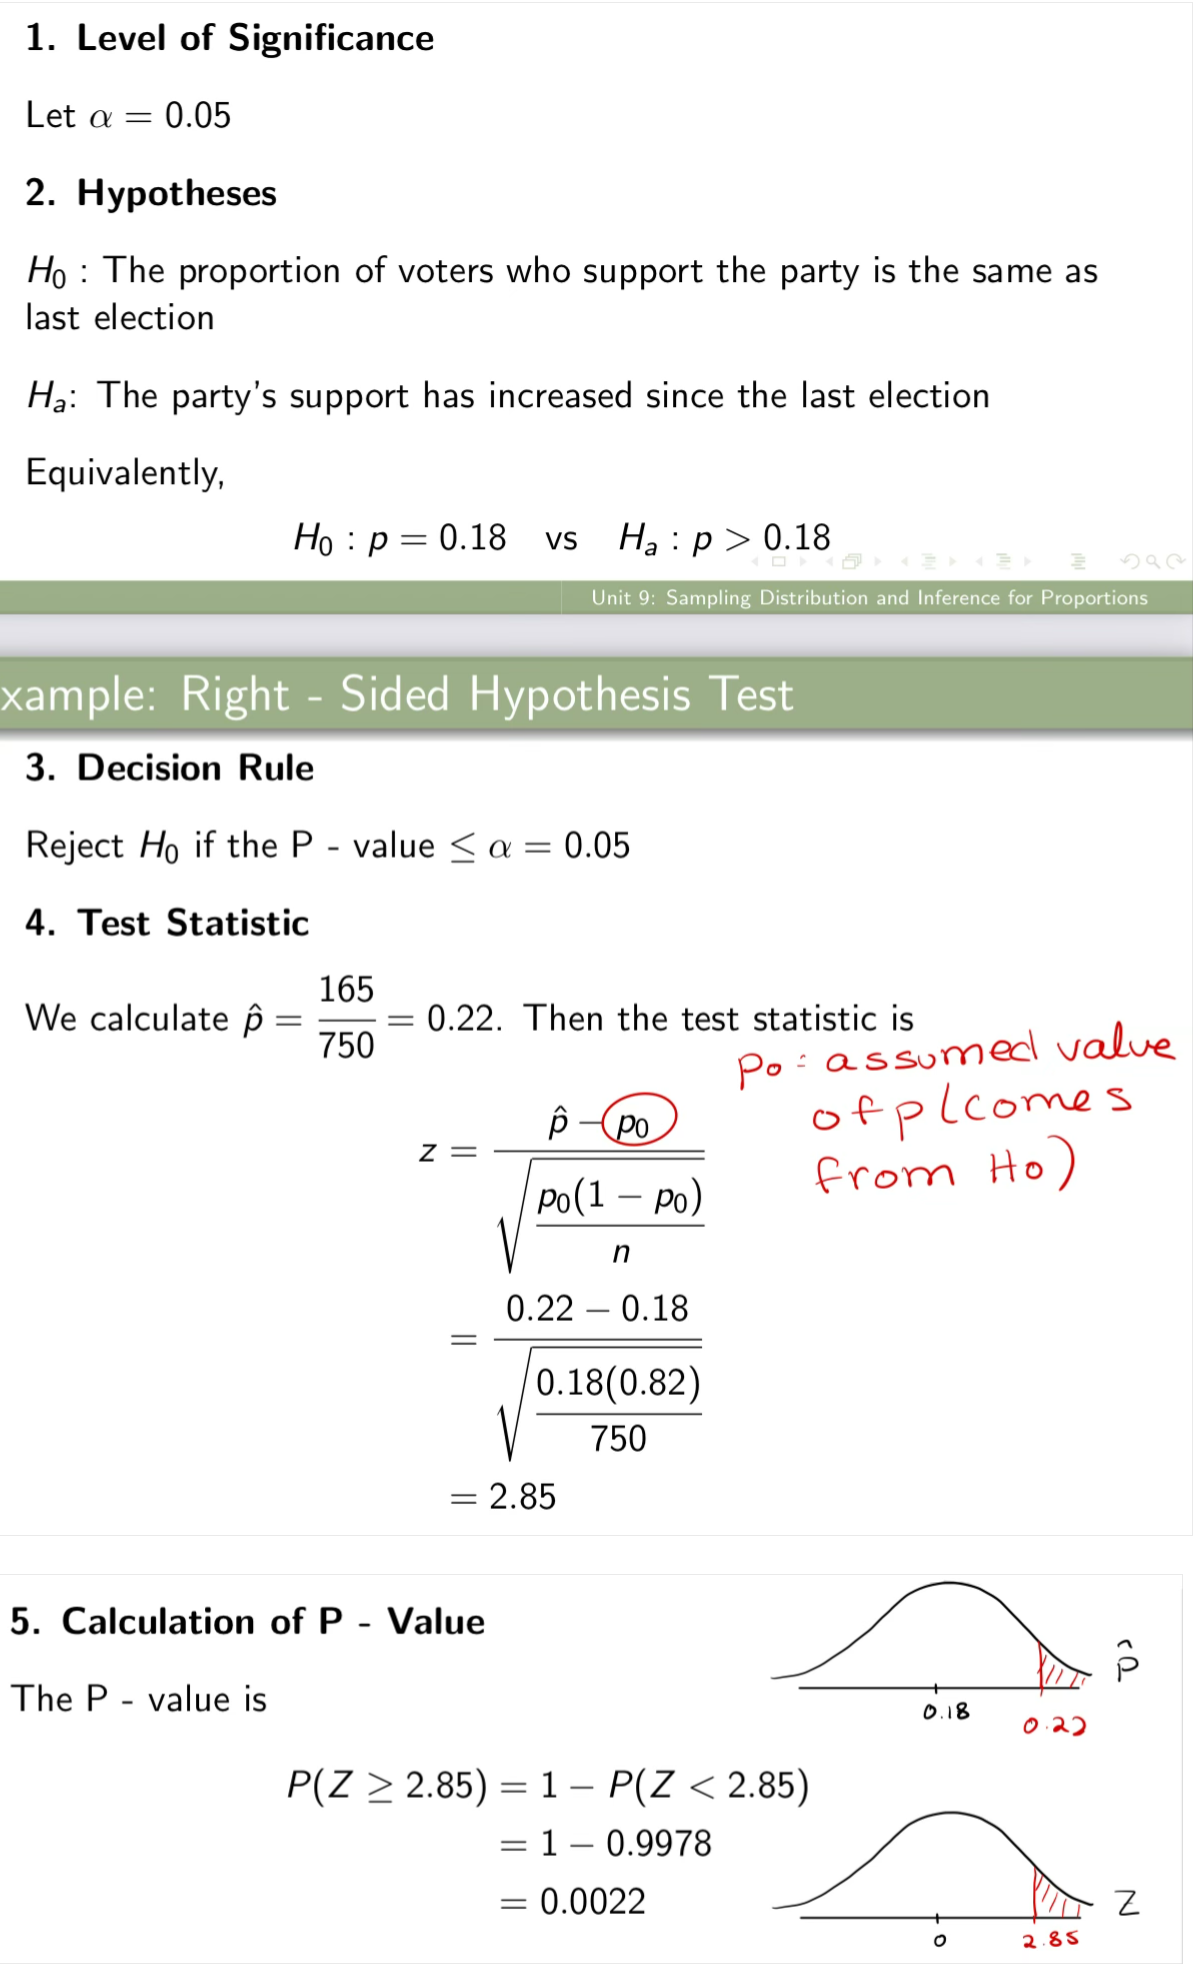
Example: A political party would like to know if their support has increased since the last election, when they received 18% of all votes. In a random sample of 750 voters, 165 say they support the party today. Conduct a hypothesis test to determine if the party’s support has increased since the last election. Use α = 0.05.
is this a left, right, or two sided hypothesis test?
This is a right-sided hypothesis test.
Example: A political party would like to know if their support has increased since the last election, when they received 18% of all votes. In a random sample of 750 voters, 165 say they support the party today. Conduct a hypothesis test to determine if the party’s support has increased since the last election. Use α = 0.05.
Note
Interpretation of P-value
Conclusion
Example: A political party would like to know if their support has increased since the last election, when they received 18% of all votes. In a random sample of 750 voters, 165 say they support the party today. Conduct a hypothesis test to determine if the party’s support has increased since the last election. Use α = 0.05.
Note:
We are assuming that p= p0 (the assumed population proportion, i.e. the value of p from H0) in the calculation of the test statistic, just like we assumed µ= µ0 in calculating the test statistic when conducting a test for a population mean.
We always calculate the test statistic assuming H0 is true
Example: A political party would like to know if their support has increased since the last election, when they received 18% of all votes. In a random sample of 750 voters, 165 say they support the party today. Conduct a hypothesis test to determine if the party’s support has increased since the last election. Use α = 0.05.
P-value Interpretation
“If the party’s support was the same as last election, the probability of observing a sample proportion at least as high as 0.22 would be 0.0022
Example: A political party would like to know if their support has increased since the last election, when they received 18% of all votes. In a random sample of 750 voters, 165 say they support the party today. Conduct a hypothesis test to determine if the party’s support has increased since the last election. Use α = 0.05.
6. Conclusion
Since the P - value = 0.0022 < ε = 0.05, we reject the null hypothesis. At the 5% level of significance, we have sufficient evidence that the party’s popular support has increased since the last election.
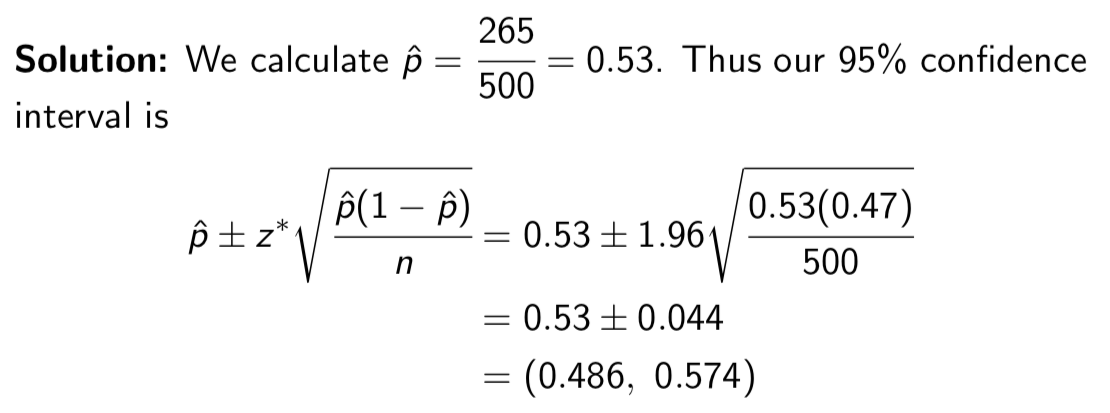
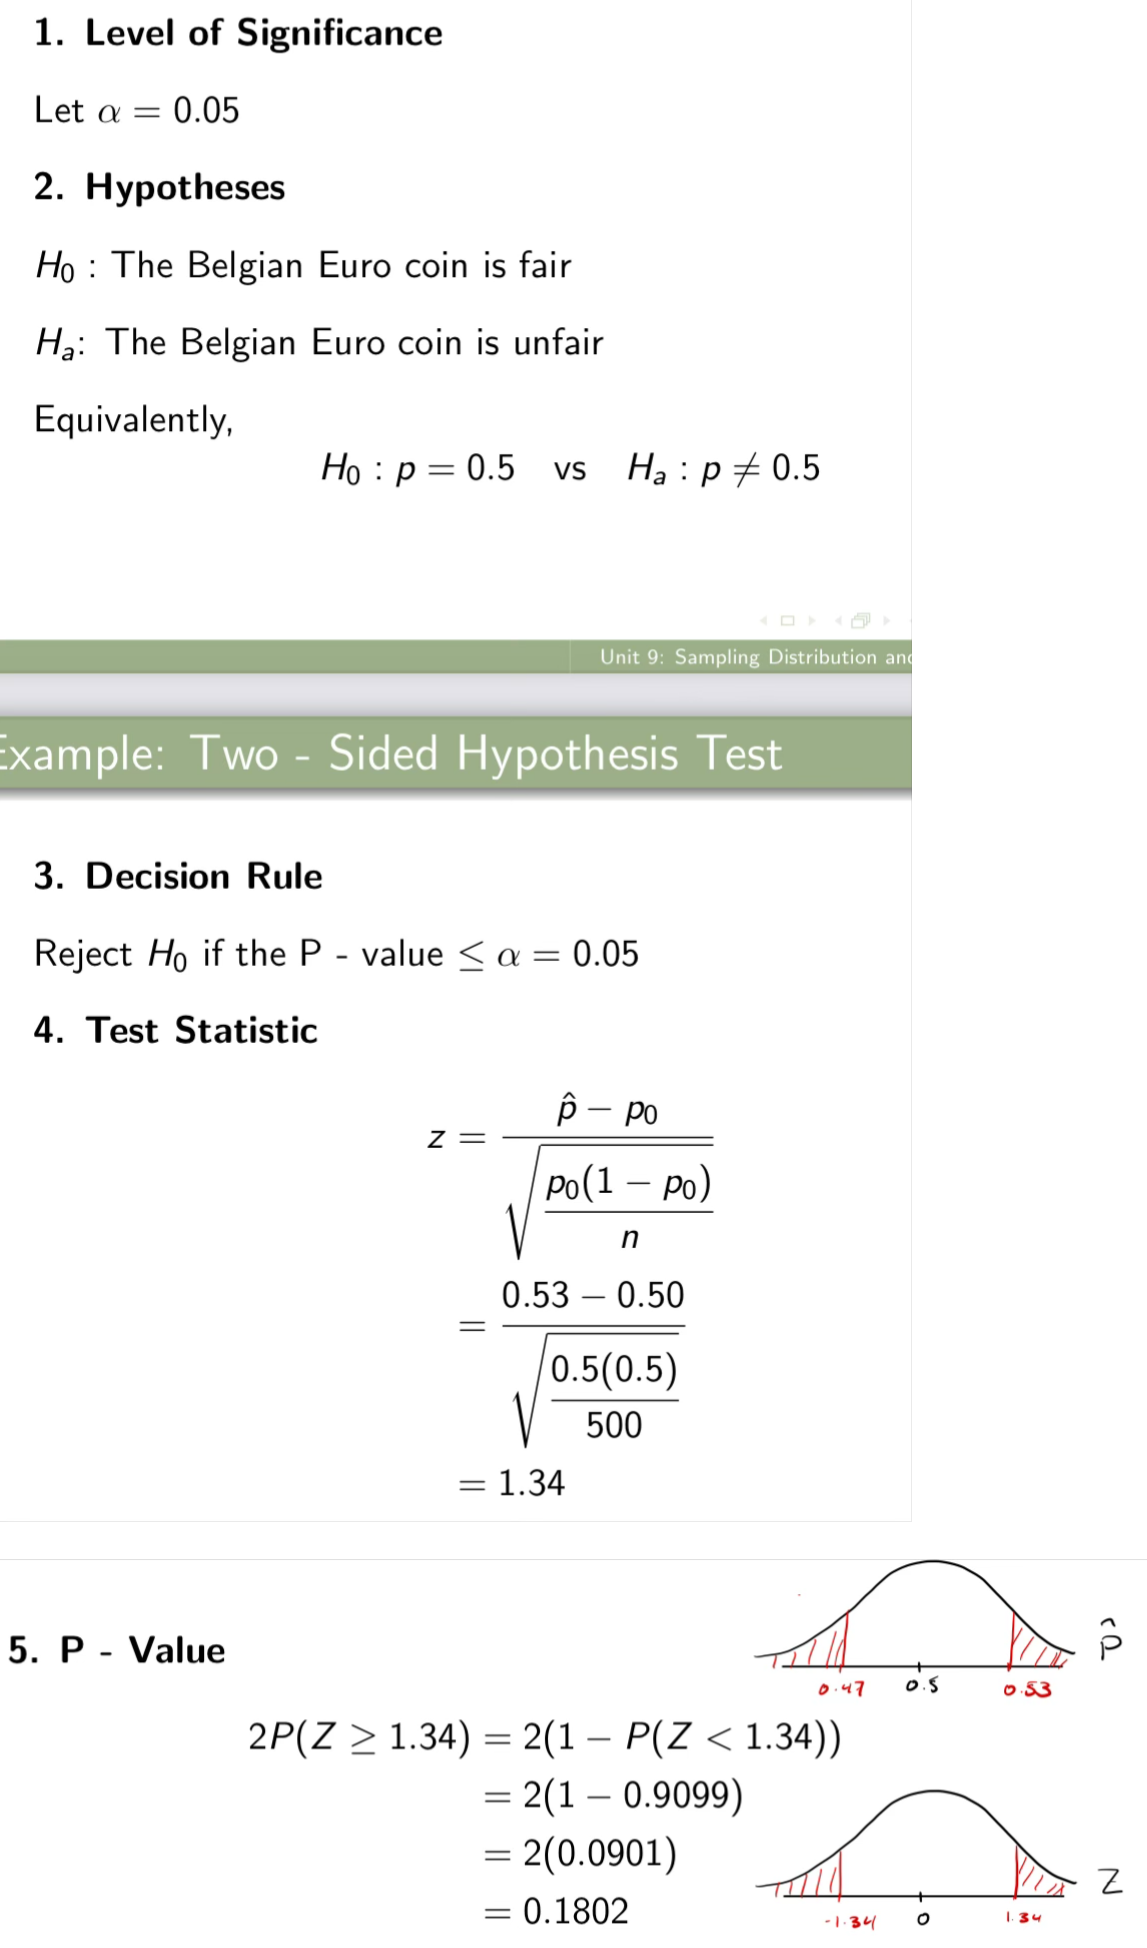
Example: Shortly after the introduction of the Euro coin in Belgium, newspapers published articles claiming the coin was unfair (i.e. that when the coin was flipped, heads and tails were not equally likely). We investigate the claim by flipping the Belgian Euro coin 500 times, and we observe 265 heads.
is this a left, right, or two sided hypothesis test?
This is a two-sided hypothesis test
Example: Shortly after the introduction of the Euro coin in Belgium, newspapers published articles claiming the coin was unfair (i.e. that when the coin was flipped, heads and tails were not equally likely). We investigate the claim by flipping the Belgian Euro coin 500 times, and we observe 265 heads.
Calculate a 95% confidence interval for the true proportion of all flips of the coin that land on heads
Conduct a hypothesis test to determine whether there is evidence that the Belgian Euro coin really is unfair. Use α = 0.05.
Example: Shortly after the introduction of the Euro coin in Belgium, newspapers published articles claiming the coin was unfair (i.e. that when the coin was flipped, heads and tails were not equally likely). We investigate the claim by flipping the Belgian Euro coin 500 times, and we observe 265 heads.
Calculate a 95% confidence interval for the true proportion of all flips of the coin that land on heads
Example: Shortly after the introduction of the Euro coin in Belgium, newspapers published articles claiming the coin was unfair (i.e. that when the coin was flipped, heads and tails were not equally likely). We investigate the claim by flipping the Belgian Euro coin 500 times, and we observe 265 heads.
Conduct a hypothesis test to determine whether there is evidence that the Belgian Euro coin really is unfair. Use α = 0.05.
P-value interpretation
Conclusion
Example: Shortly after the introduction of the Euro coin in Belgium, newspapers published articles claiming the coin was unfair (i.e. that when the coin was flipped, heads and tails were not equally likely). We investigate the claim by flipping the Belgian Euro coin 500 times, and we observe 265 heads.
P-value interpretation
“If the Belgian coin was fair, the probability of observing a sample proportion at least as extreme as 0.53 would be 0.1802”
Example: Shortly after the introduction of the Euro coin in Belgium, newspapers published articles claiming the coin was unfair (i.e. that when the coin was flipped, heads and tails were not equally likely). We investigate the claim by flipping the Belgian Euro coin 500 times, and we observe 265 heads.
6. Conclusion
Since the P - value = 0.1802 > α = 0.05, we fail to reject H0. At the 5% level of significance, we have insufficient evidence to conclude that the Belgian Euro coin is unfair.
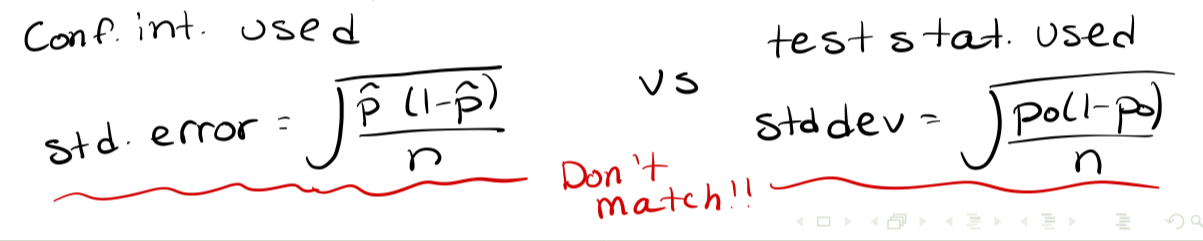
Note: about confidence intervals and two sided tests
Note: We previously constructed a 95% confidence interval, and then we conducted a two - sided test with a 5% level of significance.
Unlike inference methods for µ, we cannot use confidence intervals to conduct hypothesis tests for p.
This is because the formulas for the confidence interval and test statistic use different versions of the formula for the standard error/standard deviation

Can we use confidence intervals to conduct hypothesis tests for p?
no, we cannot
Why can’t we use confidence intervals to conduct hypothesis tests for p?
This is because the formulas for the confidence interval and test statistic use different versions of the formula for the standard error/standard deviation