Chi Square
1/13
There's no tags or description
Looks like no tags are added yet.
Name | Mastery | Learn | Test | Matching | Spaced |
|---|
No study sessions yet.
14 Terms
The chi-square test can be used as a test for ________
independence
What does a chi-square test do
It uses a contingency table to compare two categorical variables
It tests whether there is a difference in proportions between the two sets of data
For what kind of data are chi square tests used
The chi-square test can be used when both variables are nominal or when one variable is nominal and the other one is ordinal
What are HO and HA
HO: The two variables are independent (no association)
HA: The two variables are NOT independent (association)
Difference between observed and expected test statistic
Observed: refers to the count observed in a cell (what the data say)
Expected: refers to the count that would be expected if Ho is true.
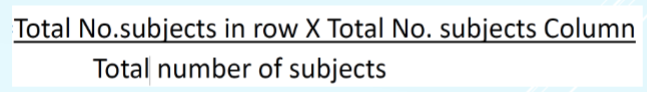
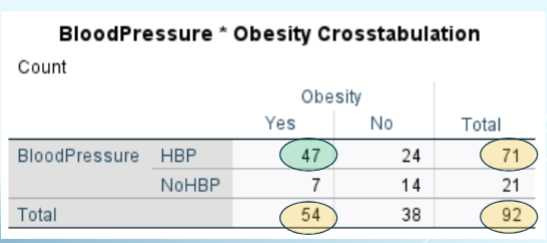
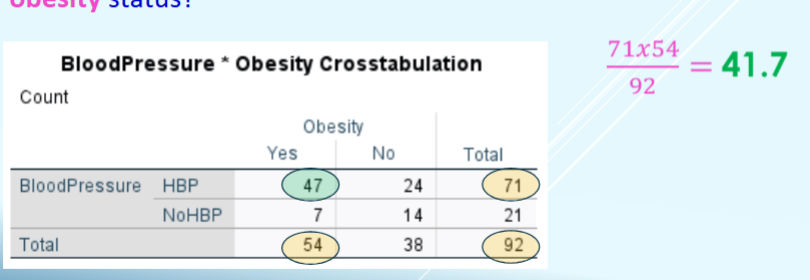
Calculate the expected count
Meaning of a significant p value
P-value < 0.05 = Significant p-value and therefore evidence against the null hypothesis of no association
Give steps for finding the standard deviation
1. Find mean of values
2. Minus mean from each value
3. Square new values
4. Find mean of new values
5. Square root new mean
standard deviation measures _________
spread
Central tendency uses what metrics
mean, median & mode
What is a p value
A p value is the probability that you got the correlation between these 2 data sets (e.g. people who smoke & people who have cancer) completely by chance. What’s the probability that smoking actually didn’t have an effect on cancer but you have these figures anyway? The Ho assumes that there is no relationship between the 2 variables. If p<0.05 Ho is wrong. If p>0.05, there isn’t enough evidence to declare Ho false. Ha assumes there is a correlation between the 2 variables
The median is a robust measure of
central tendency in the presence of outliers.
The mean is a measure of central tendency that is sensitive/not sensitive to outliers
The mean is a measure of central tendency that is sensitive to outliers
What are the preferred measures of central tendency and variability for skewed distributions.
The median and interquartile range