Normality of Distribution
1/23
There's no tags or description
Looks like no tags are added yet.
Name | Mastery | Learn | Test | Matching | Spaced |
|---|
No study sessions yet.
24 Terms
Parametric Statistics require that the variables being studied are..
Normally Distributed
Step 1 of Distribution
Look at all the possible values and then see how many times they repeat (put them from smallest to largest)
Frequency Table
Listing every possible value in the 1st column of numbers the frequency of each value as the 2nd column
Step 2 of Distribution
Create an ungrouped frequency distribution
Ungrouped Frequency Distribution
Researchers list all categories of the variable on which they have data and tally each datum on the listing
Step 3 of Distribution
Group ages into ranges of value (must be exhaustive: each age will fit into at least one category)
Theoretical Normal Curve
Expression of Statistical Theory (mean, median and mode are equal) (symmetrical, unimodal, and continuous values)
Skewness (aka asymmetrical)
Any frequency distribution that is not symmetrical
In a skewed distribution, the mean/median/mode are
Not Equal
What does skewness interfere with?
Validity of the many statistical analyses
Positively Skewed
Largest portion of data is below the mean (the mean is greater than the median which is greater than the mode)
Negatively Skewed
Largest portion of data is above the mean (The mean is less than the median which is less than the mode)
Kurtosis
Explains the degree of the peak of the frequency distribution (related to the spread/variance of scores)
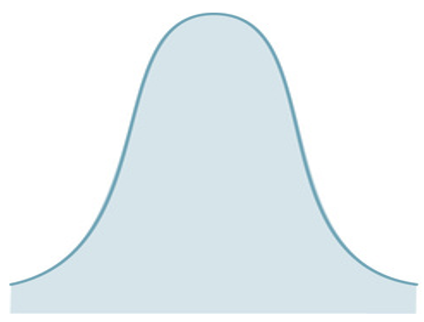
Leptokurtic
Extremely peaked distribution
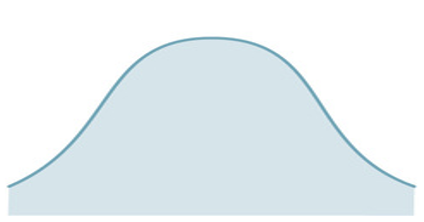
Mesokurtic
Intermediate degree of kurtosis
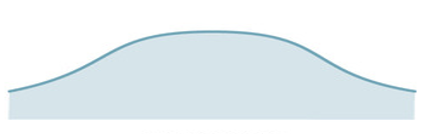
Platykurtic
Relatively flat distribution
Extreme kurtosis can affect the validity of
Statistical analysis because the scores have little variance
What does kurtosis of zero indicate?
Curve = Mesokurtic
What does kurtosis values above zero indicate?
Curve = Leptokurtic
What does kurtosis values below zero indicate?
Curve = Platykurtic
What should be assessed prior to statistical analysis?
Skewness and Kurtosis
What skewness and kurtosis values are severe and impacts outcomes from parametric analysis techniques?
≥ +1 or ≤ -1 (Since it is this severe, nonparametric testing should be considered)
Shapiro-Wilk’s W Test
Assesses whether a variable’s distribution is skewed and/or kurtotic
How does the Shapiro-Wilk’s W Test have the ability to calculate both skewness and kurtosis?
By comparing the shape of the variable’s frequency distribution to that of a perfect normal curve