Week 6 Lecture - More Research Methods and Statistics
 Call Kai
 Learn
Learn Practice Test
 Spaced Repetition
 Match
Match Flashcards
 Knowt Play
1/28

There's no tags or description
Looks like no tags are added yet.
Name | Mastery | Learn | Test | Matching | Spaced | Call with Kai | Chat |
|---|
No analytics yet
Send a link to your students to track their progress
29 Terms
Multiple Linear Regression
Predicts one interval/ratio outcome using multiple predictors of any level.
Logistic Regression
Predicts one categorical outcome with exactly two levels using one or more predictors.
Multinomial Logistic Regression
Predicts one categorical outcome with multiple levels using one or more predictors.
Ordinal Logistic Regression
Predicts one ordinal outcome with multiple levels using one or more predictors.
Internal Consistency
How closely related the items in an outcome measure are as a group.
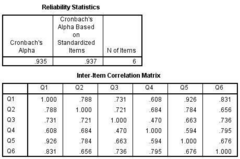
Cronbach's Alpha (α)
Statistic measuring internal consistency, calculated from average pairwise correlations; ranges from 0-1.
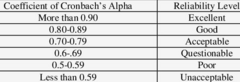
Cronbach's Alpha Interpretation
0.7 is acceptable, 0.8 is good, and 0.9 is excellent.
Non-Parametric Statistics
Used for nominal/ordinal data, or interval/ratio data that fail parametric assumptions.
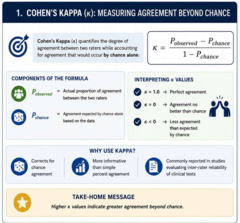
Kappa (K) Statistic
Measure of association used for inter-rater agreement with nominal data.
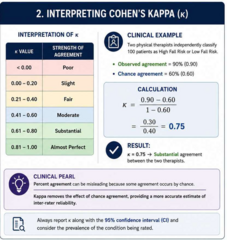
Kappa Interpretation
1 indicates perfect agreement; 0 indicates agreement equivalent to chance.
Chi-Square Test for Independence
Tests whether two nominal variables are independent of one another.

How do you write a Chi-Square Test
You can write it to determine difference or you can write it to determine relationship
Exploratory Factor Analysis (EFA)
Determines the number of underlying constructs (factors) in a questionnaire by explaining the correlations between variables.
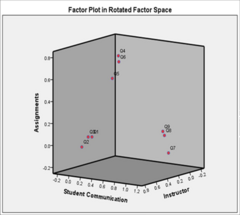
EFA Clinical Utility
Demonstrates construct validity and helps revise or shorten clinical tools.
Standard Error of the Mean (SEM)
Difference between a sample's mean and the true population mean.
Standard Error of Measurement (SEm)
How repeated measures of a person's score vary around their true score.
Minimal Detectable Change (MDC)
Minimal change falling outside measurement error; represents real, but not necessarily meaningful, change.
Minimally Clinically Important Difference (MCID)
Minimal change in a score that is meaningful to the patient.
Sensitivity
True positive rate; probability that a test is positive if disease is present.
SNOUT
Highly sensitive tests rule OUT disease when the result is negative.
Specificity
True negative rate; probability that a test is negative if disease is absent.
SPIN
Highly specific tests rule IN disease when the result is positive.
Positive Predictive Value (PPV)
Probability that a patient truly has the condition given a positive test.
Negative Predictive Value (NPV)
Probability that a patient truly lacks the condition given a negative test.
Prevalence effect on PPV
As disease prevalence increases, Positive Predictive Value (PPV) increases.
Prevalence effect on NPV
As disease prevalence increases, Negative Predictive Value (NPV) decreases.
Likelihood Ratio (LR)
How much a test result changes the probability that a patient has a condition.
Positive Likelihood Ratio (LR+)
Sensitivity / (1 - Specificity); higher values are better for ruling in.
Negative Likelihood Ratio (LR-)
(1 - Sensitivity) / Specificity; lower values are better for ruling out.