Statistics Ch. 12
1/10
There's no tags or description
Looks like no tags are added yet.
Name | Mastery | Learn | Test | Matching | Spaced |
|---|
No study sessions yet.
11 Terms
Regression Analysis
a statistical technique to quantify associations and begin the process of predicting future events
Linear Regression
used to identify a relationship between a single independent variable (x axis) and a single dependent variable (y axis) at the interval or ratio level
if there is a linear relationship when these variables are graphed, you can use the slope of the line to tell you how much the predicted value of the dependent variable changes when there is a one unit change in the independent variable
Residual
the difference between where the data actually falls and where the linear regression line predicts they will fall
also called prediction error
lower residuals mean a better fit of the prediction line and the data
Multiple Regression
used when you wish to examine the relationship between multiple independent variables (X1, X2…) and a continuous dependent variable (Y) at the interval or ratio level
Y = a - b1X1 + b2X2 + e
Y = value of independent value
a = constant value when x = 0
b = beta value; value of the regression coefficient, the rate of change in the outcome for every one unit increase in the independent variable
X1 = value of first independent value
X2 = value of second independent value
e = error term
Beta Values in Multiple Regression
beta values are the rate of change in the dependent variable for every one unit increase in the independent variable holding the other independent variables constant
when beta value is positive there is an increase in the dependent variable when the independent variable is increased
when beta value is negative there is a decrease in the dependent variable when the independent variable is increased
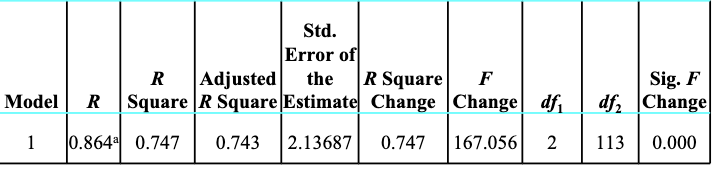
R2
tells you the percentage of the variance in the dependent variable that is explained in your regression model
if R2 is 0.747, that means the variables you have included in your regression model explain 75% of the variance in the dependent variable you are studying. R2 always increases when additional independent variables are included in the model even if the added independent variables are not significant.
the adjusted R2 is a more conservative estimate of the R2 and is a better option when a large number of independent variables are included with a small sample size
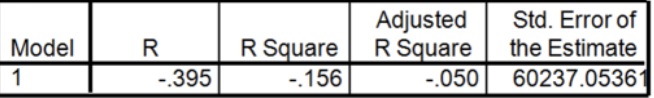
Standard Error of the Estimate
Tells you the average amount of error there will be in the predicted outcome using your specific regression model
how much your prediction would be off by
you would like to minimize this to make your prediction as accurate as possible so the closer the standard error of the estimate is to zero, the better.
Determining Significance
it is a little trickier than previous tests but still has some underlying principles
look at your R2 and find the corresponding p value
is that significant (<alpha)?
then look at each of the independent variables for significance as well. you can have a significant R2 with an independent variable included hat doesn’t add anything to your model
Is the R2 change significant for each added independent variable?
If not, it means when you controlled for the other independent variables the insignificant variable no longer added to the ability to predict the outcome
The Beta Value for Each Independent Variable
there is one column i SPSS for unstandardized coefficients. these are the bets coefficients for the independent variables included in the regression equation
a one unit change in variable X1 will produce a change in the dependent variable equal to the beta for variable X1
For example, if the beta for X1 is 2.3, that means when you control for all the other independent variables, a one unit increase in X1 would produce a 2.3 unit increase in your dependent variable
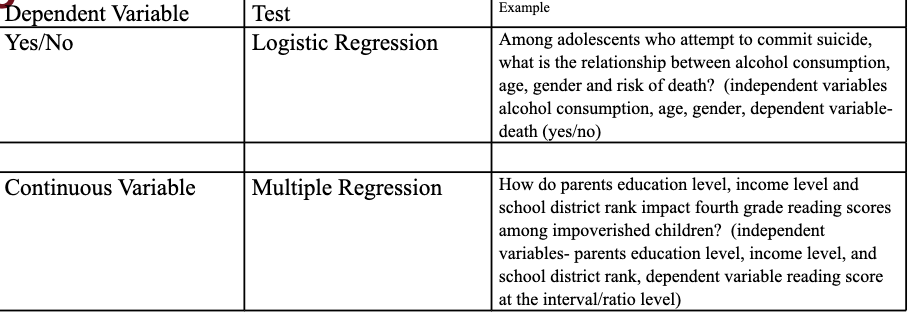
Logistic Regression
examines the relationship between multiple independent variables with a dependent variable that is binary (nominal or ordinal with only two categories) such as yes/no, alive/dead.
generates an odds ratio (OR) which is frequently helpful for explaining results to the public. it is the probability of the outcome occurring divided by the probability of the outcome not occurring.
Tests That Control for the Impact of More than One Independent Variable on a Single Dependent Variable
multiple and logistic regression allow the researcher to examine the effect of multiple independent variables on a single dependent variable.