Lecture 3
 Call Kai
 Learn
Learn Practice Test
 Spaced Repetition
 Match
Match Flashcards
 Knowt Play
1/19

There's no tags or description
Looks like no tags are added yet.
Name | Mastery | Learn | Test | Matching | Spaced | Call with Kai | Chat |
|---|
No analytics yet
Send a link to your students to track their progress
20 Terms
Mean
Mean= sum of the observations/ number of observations
Median
The level below (or above) half of the observations fall (50 percentile).
1. Arrange your numbers in numerical order
2. Count how many numbers you have
3. If you have an odd number of values, its the # in the middle
4. If you have an even number, its the average of the two middle numbers
Most
The number that appears the most
Example of Mean, Median, Mode
1, 1, 2, 3, 4, 5, 24
Sum= 40
Mean is 6.66
Median is 3
Mode is 1
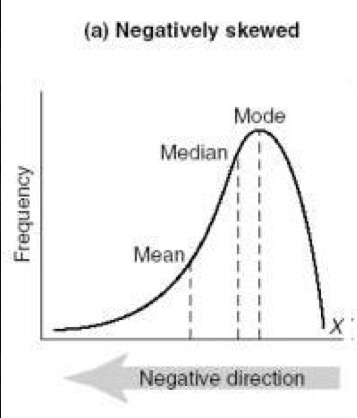
Negatively Skewed
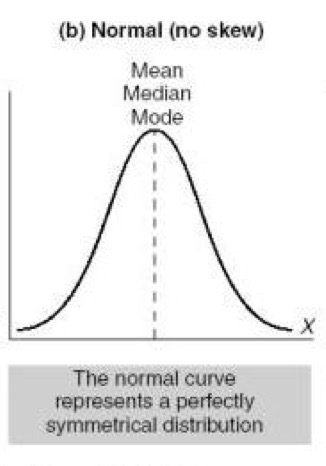
Normal (No Skew)
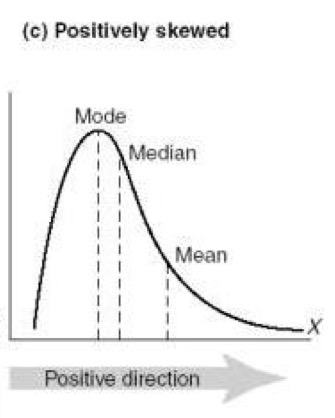
Positively Skewed
Medians versus Mean?
Median is better than mean for skewed data. Outliers can greatly skew the mean.
In what direction is the skew?
The tail
Probability (Pr)
The numerical expression of the likelihood of a measurable event happening. Expressed in fractions, decimal fractions, or percent
Simple Probability
Looks at the likelihood of one event occurring (or not)
EX: What is the probability of throwing a 3 with one roll of one die?
1/6 or 16.6%
Conditional Probability
Looks at two events occurring in relation to each one. Assesses the probability of a second event occurring based on the probability of the first event occurring.
EX: 120 people attended a banquet, 100 attendees ate turkey, of those 100 80 people got sick
What is the probability of getting sick, given that a person ate turkey?
80/100=80%
Target Population
The collection of individuals, items, or measurements on which we want to study and develop inferences
Measurement Error
The initial goal is to make a study that is accurate, but all measurements are susceptible to error. The 2 types of error are: Random (imprecision) and Systematic (bias)
Standard Error of Measurement (random error)
Standard Error of Measurement is the variability of a sample measure… based on when, how and by whom the samples are obtained
Courses of variations:
Natural variations (ex. morning vs night)
Imprecise instruments
Individual difference (ex. subjective pain rating)
Sampling Error
A bias in which a sample is collected in such a way that some members of the intended population have a lower or higher sampling probability than others
EX:
Self-selection bias
Survivorship bias
healthy worker bias
Random Sampling
Attempt to replicate the characteristics of the Target Population within the drawn sample. This reduced systemic bias.
Confidence Intervals (CI)
A confidence level is a measure of the degree of reliability of a confidence interval of a variable under study. The most frequently used confidence levels are 90%, 95%, and 99%.
What P value gets papers published?
0.05, 5%
What is the lowest fraction of error P value?
0.01, 1%