genomics - single cell genomics
1/52
There's no tags or description
Looks like no tags are added yet.
Name | Mastery | Learn | Test | Matching | Spaced | Call with Kai |
|---|
No analytics yet
Send a link to your students to track their progress
53 Terms
advantages of sc sequencing over bulk sequencing
-obtain genomic information for every cell
-understand cell heterogeneity within the tissue
-distinguish cell population changes vs gene expression changes
scRNA seq applications
-resolve cellular heterogeneity
-identify rare cell populations
-trace lineage and developmental relationships between heterogeneous, yet related, cellular states
-mechanism of heterogenous drug response
sc technology challenges
-amount of rna present in a single cell is lower than the amount needed for successful signal detection
-application of sequencing based expression profiling to single cells required either increased sensitivity or amplification of input RNA
single cell rna seq (Tang, 2009)
-modified from sc microarray protocol, inc rt incubation and pcr extension
-full length first strand cdnas
-used SOLiD sequencing system from applied biosystems
-allowed the detection of thousands of genes and hundred of new splice junctions more than a standard microarray experiment
Limitations of Tang 2009 method
-pronounced 3’ bias with the majority of reads mapping to the 3’ terminal portion of the transcripts
-severe limitation for the study of transcriptional start sites (TSS) as well as in the analysis of the different splice variants
-inefficiencies in the enzymatic reactions resulted in decreased sensitivity w consequent loss of lowly expressed transcripts
-throughput: only 6 cells were sequenced
technologies developed to increase throughput
multiplexing → integrated fluidic circuits → liquid handling robotics → nanodroplets → picowells → in situ barcoding
GEMs
Gel beads in Emulsion
10x genomics
-use microfluidic partitioning to capture single cells and prepare barcoded, NGS cDNA libraries
-cells are loaded at a limiting dilution in order to maximize the number of GEMs containing a single cell (doublet formation)
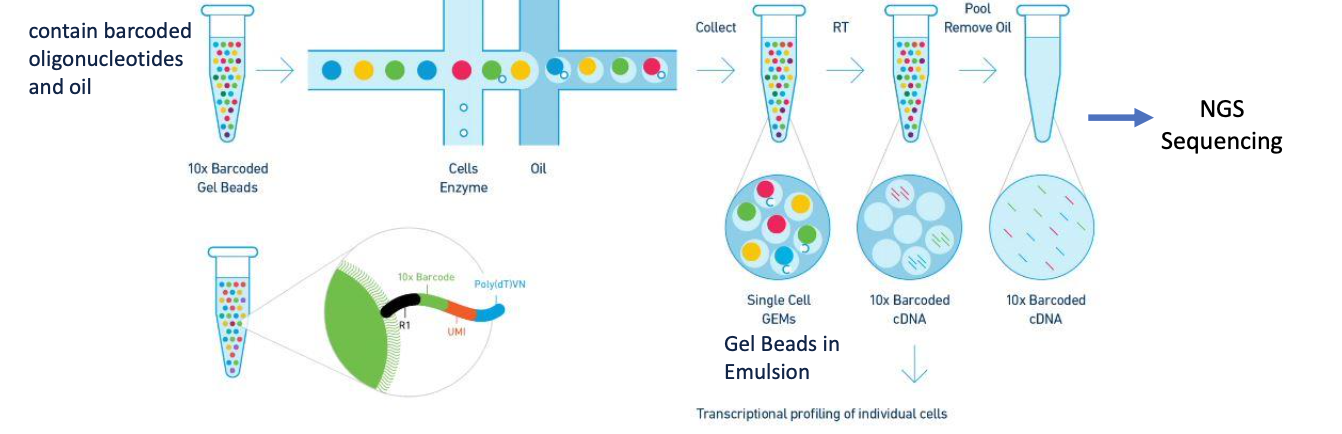
UMIs
Unique molecular identifiers
-random short nucleotide sequences with a very low likelihood of a duplicate UMI within a single bead
-each molecule has a unique UMI
distinguish PCR duplicates vs true biological diversity
Smart-seq2 technology
-low-throughput (96 or 384 well plate)
-more expensive
-full length cDNA sequencing
-physical separation of cells into well plates using a laser
single cell limitations
-single cell datasets are sparse and suffer dropout
-low sensitivity: lowly expressed transcripts more likely to escape detection
-very easy to produce poor qual datasets from poor cell handling
-easy to create artifacts/cell multiplets
-loss of spatial, temporal and lineage information
dropout
a gene is observed at a low or moderate expression level in one cell but is not detected in another cell of the same cell type
Cell Ranger
-software for 10x genomics
-input raw data in fastq format and reference transcriptome
source of technical noise
-bias of transcript coverage
-low capture efficiency
-sequencing depth differences
-dropout events
low quality cells
-cells that are broken or dead
-doublets and multiple cells
technical noise and low quality cells lead to what
-forming distinct, misleading clusters
-inflating variance estimates in dimensionality reduction
library size
total rna counts per cell
-low counts indicate rna loss or prep inefficiencies
-vary by protocol and dataset (commonly >1000 for 10x genomics)
expressed genes
number of genes with non-zero expression
-low values suggest incomplete transcript capture
-vary by protocol and dataset (commonly >500 for 10x genomics)
mitochondrial percentage
proportion of reads from mitochondrial genes
-high values point to cytoplasmic rna loss during cell damage
-commonly <10% for human and <5% for mouse mitochondrial reads
spike-in percentage
proportion of reads mapping to spike-ins(control probes)
-elevated levels indicate endogenous rna loss
primary goal of single-cell normalization
remove the influence of technical effects in the underlying molecular counts, while preserving true biological variation
dimensionality reduction
the transformation of data from a high-dimensional space into a low dimensional space so that the low dimensional representation retains as much meaningful properties of the original data as possible
-to learn the underlying manifold of the data in order to place similar cells together in low-dimensional space
-reduce noise, computational complexity, and enable visualization
PCA
a linear dimensional reduction algorithm
-creates a new set of uncorrelated variables (principal components), via an orthogonal transformation of the original dataset
t-SNE
T-distributed stochastic neighbor embedding
-graph based, non-linear dimensionality reduction technique
UMAP
uniform manifold approximation and projection
-graph based, non-linear dimensionality reduction technique
-the fastest run times, the highest reproducibility and the most meaningful organization of cell clusters than other dimensionality reduction approaches
cell clustering
-to group cells based on similarity in gene expression profiles
-to identify biologically meaningful groups in high-dimensional scRNA-seq data
supervised clustering methods
use a set of known markers in clustering
unsupervised clustering methods
for de novo identification of cell populations
cell clustering methods
k-means
hierarchical clustering
density-based clustering
graph-based clustering
cell annotation
the process of assigning biological meaning to clusters of cells, usually based on their gene expression profiles
goal is to map clusters to known cell types, states, or lineages based on expression patterns and marker genes
why is cell annotation important?
-provides biological context for identified clusters
-helps interpret cellular diversity in tissues or developmental stages
-facilitates comparative analysis across datasets, conditions, or diseases
differential expression analysis
-to distinguish different cell types or subpopulations
-helps to understand developmental processes
-reveal biological insights into cell-type-specific responses to treatment or disease conditions
-essential for identifying biomarkers or therapeutic targets
snRNA-seq input
nuclei
snRNA-seq tissue
fresh, lightly fixed, or frozen tissues, hard-to-dissociate tissues (brain, heart)
snRNA-seq cells
difficult to isolate cells
snRNA-seq dissociation protocol
quick and mild
snRNA-seq measurement
nuclear transcripts
snRNA-seq cons
cannot capture RNA in the cytoplasm (gene isoforms, RNA in mitochondria and chloroplast)
scRNA-seq input
whole cell
scRNA-seq tissue
fresh tissue
scRNA-seq cells
easy to isolate cells
scRNA-seq dissociation protocol
extended incubations and processing
scRNA-seq measurement
both cytoplasmic and nuclear transcripts
scRNA-seq cons
technical artifacts from heating, protease digestion
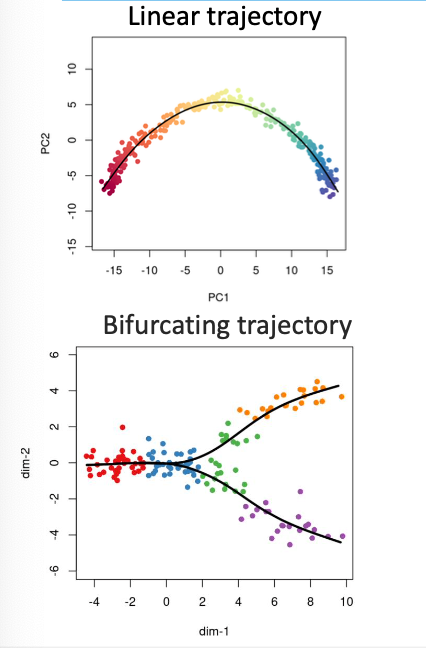
trajectory/pseudotime analysis
-the cells in many biological systems exhibit a continuous spectrum of states and involve transitions between different cellular states
-such dynamic processes within a portion of cells can be computationally modeled by reconstructing the cell trajectory/pseudotime based on scRNA-seq data
pseudotime
an ordering of cells along the trajectory of a continuous process in a system, which allows the identification of the cell types at the beginning, intermediate, and end states of the trajectory
trajectory topology
-reveal gene expression dynamics across cell states
-identification of the factors triggering state transitions
gene co-expression network inference
-gene co-expression network (GCN): undirected graph where each node corresponds to a gene, and a pair of nodes is connected with an edge if there is a significant co-expression relationship between them
-can be constructed by looking for pairs of genes which show a similar expression pattern across samples, since the transcript levels of 2 co-expressed genes rise and fall together across samples
-co expressed genes could be controlled by the same transcriptional regulatory program, functionally related, or members of the same pathway or protein complex
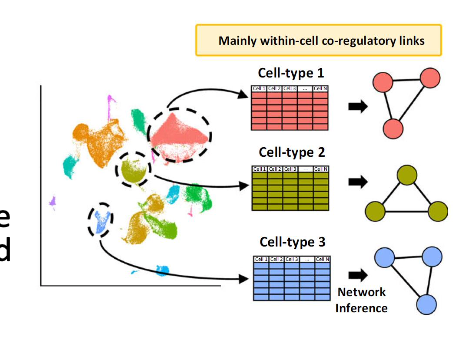
gene regulatory network inference
assumption that the genes highly correlated in expression could be co-regulated
ligand-receptor network analysis
-to identify the protein messages passed between cells and their associated pathways
-to understand the directionality, magnitude and biological relevance of cell-cell communication
LIANA+
re-implements and adapts eight ligand-receptor methods to infer interactions from single-cell data, along w a flexible consensus that can integrate any combination of these methods
single cell atac-seq
-uses a hyperactive tn5 transposase to insert sequencing adapters into accessible chromatin regions
-measuring chromatin accessibility = potential regulatory sequences
single cell proteomics
-proteomic differences poorly coorelate with corresponding transcriptomic differences between biological states
-post translational modifications
-mass spec based single cell proteomics
-not that accessible right now