Ch 7 - Data Flow Diagrams
1/41
There's no tags or description
Looks like no tags are added yet.
Name | Mastery | Learn | Test | Matching | Spaced |
|---|
No study sessions yet.
42 Terms
Data flow diagrams (DFDs)
graphical representation of data processes thoughout an organization
Useful in agile and SDLC
conceptualize how data move through the organization, the process or transformation that the data undergo, and what the outputs are
Inputs (value creators), processes, outptus (value consumers)
Conventions Used in Data Flow Diagrams
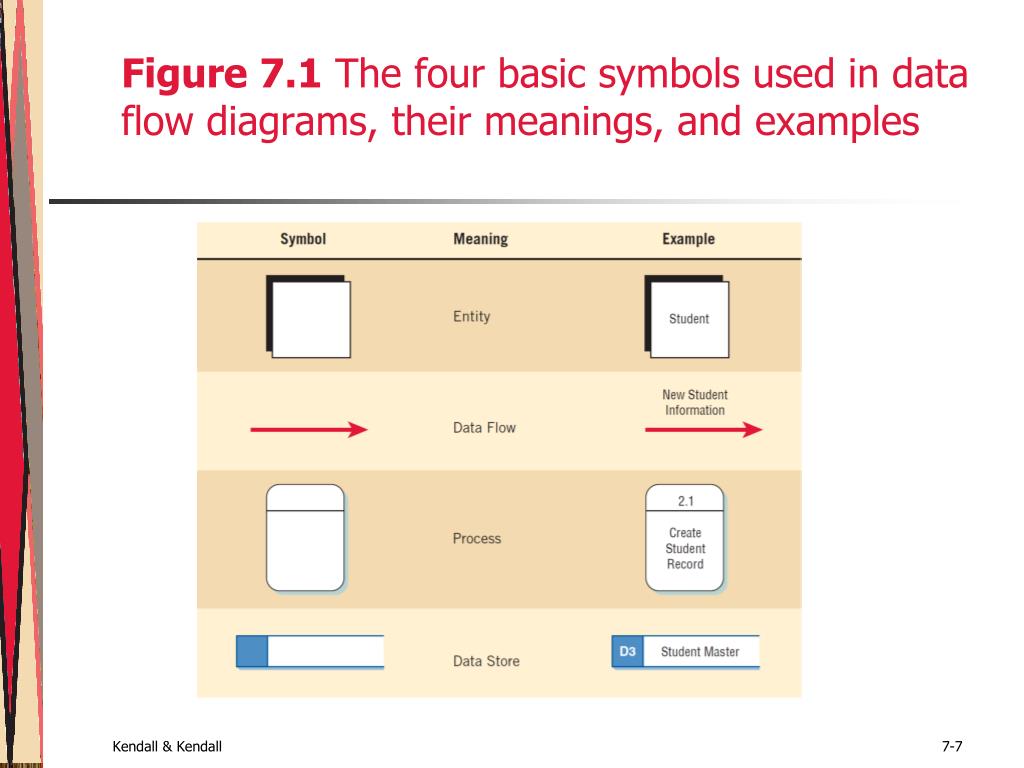
Double Square (Entity)
Depict an external entity (another department, a business, a person, or a machine) that can send data to or receive data from the system
Source or destination of data
Arrows
Shows movement of data from one point to another, head of arrow pointing toward the data’s destination
Double parallel arrows
Shows simultaneous movement
Rectangle w/ rounded corners (Process)
Occurrence of a transforming process
Denote a change in or transofrmation of data
Unique identifying # that indiciates its level. inthe diagram
Naming convention:
Open-ended rectange (data store0
Data at rest
filing cabinent or a computerized file or database
where info is accessed
Developing Data Flow Diagrams Steps
List of business activities and use it to determine various
External entities
Data flows
Processes
Data stores
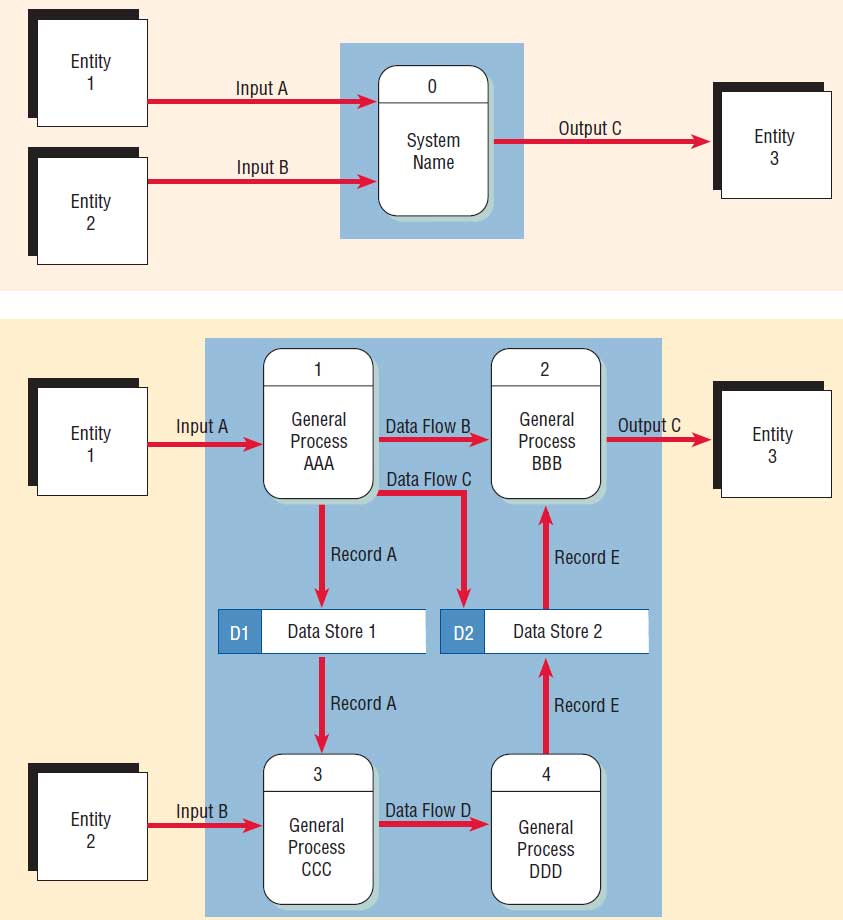
Context diagram
Draw Diagram 0
Create a child diagram for each of. the processes in Diagram 0
Check for errors and make sure the labels you assign to each process and data flow are meaningful
Develop a physical data flow diagram from the logical data flow diagram
Partition the physical data flow diagram by separating or grouping parts of the diagram in order to faciliate programming and implementation
Developing Data Flow Diagrams Step #2 Context Diagram
Data flow diagram that depicts the context of what’s going on in an org
Con: doesn’t provide info of opportunities
Guidelines
Must have at least one process
Must receive at least one data flow
Data store should be connected to at least one process
External entities should not be connected to each other
Developing Data Flow Diagrams Step #1
External entities
Data flow
Process
Data store
Creating the Context Diagram: Top-down approach
Context diagram is the highest level and contains only one process, representing the entire system
DFDs move from general to specific
does not show detailed processes or data stores
Developing Data Flow Diagrams Step #3: Drawing Diagram 0 (The Next Level)
Explod DFDs into subprocesses to fill. inthe details about data movement
Each process is numbered w/ an integer, starting from upper left hand corner to right hand
Drawing Diagram 0; Decomposition
“Exploding the diagrams”
Close-ups of 3. -9 processes and showing data stores and new lower-level data flows
Questions to ask:
What happens to the data entering the system?
Examine the output fields
Examine the data flow to or from a data store
Analyze well-defien process
Take not of any unclear areas
Developing Data Flow Diagrams Step #4: Creating child Diagrams (More Detailed Levels)
The processses on the child diagram are numbered using the parent process number, a decimal point, and a unique number for each child process
process numbered in diagram 3 are 3.1,3.2,3.3,etc
Process may or may nont exploded depending on their elevl of complexity
Parent Process
Process on Diagram 0 that is exploded
Child diagram
Diagram that results from Diagram 0
Entities must be consistent with its parents
Vertical balancing
dictates that a child diagram cannot produce output or receive input that the parent process does not also produce or receive
Interface data flow
Data flow that matches the parent flow
Functionally primiive or primitive process
When a process is not exploded
Developing Data Flow Diagrams Step #5: Checking Diagrams for Errors
Common errors:
Forgetting to include a data flow or pointing an arrow in the wrong direction
Connecting data stores and external entities directly to each other
Incorrectly labeling processes or data flow
Including more than nine processes on a DFD
Omitting data flow
Creating unbalanced decomposition (or explosion) in child diagrams
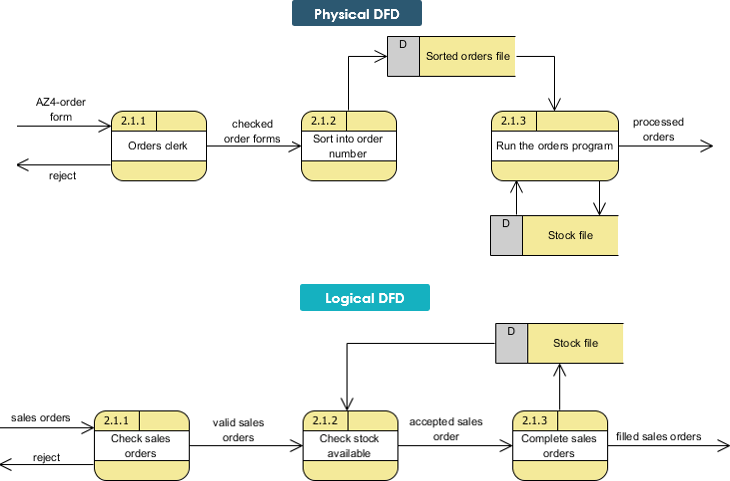
Features Common in Logical vs Physical Data flow Diagram
Features | Logical | Physical |
|---|---|---|
Model | How the business operates | How the system will be implemented |
Process | Essential sequence | Actual sequence |
Data store | Collections of data | Physical files and databases, manual files |
Type of data store | Permanent data collections | Master files, transaction files |
System controls | Business controls | Controls for data validation, record status, system security |
Logical data flow diagrams
focus on business and how it operates. This conceptual diagram describes the business events that take place and the data required and produced by each event
processes represent the business activities
data stores represent the collection of data regardless of how the data are stored
Physical data flow diagram
how the system will be implemented, including hardware, software, files, and people
programs, program modules, manual procedures
data stores represent the physical files and databases
show controls for validating input data, for obtaining a record
Contents:
Manual process
Proceses for adding, deleting, changing and updating
Data entry and verifying processes
Validation processes
Sequencing processes
Process to produce every unique system output
Intermediate data stores
Actual file names used to store data
Controls to signify completion of tasks or error conditions
The progression of Models from Logical to Physical
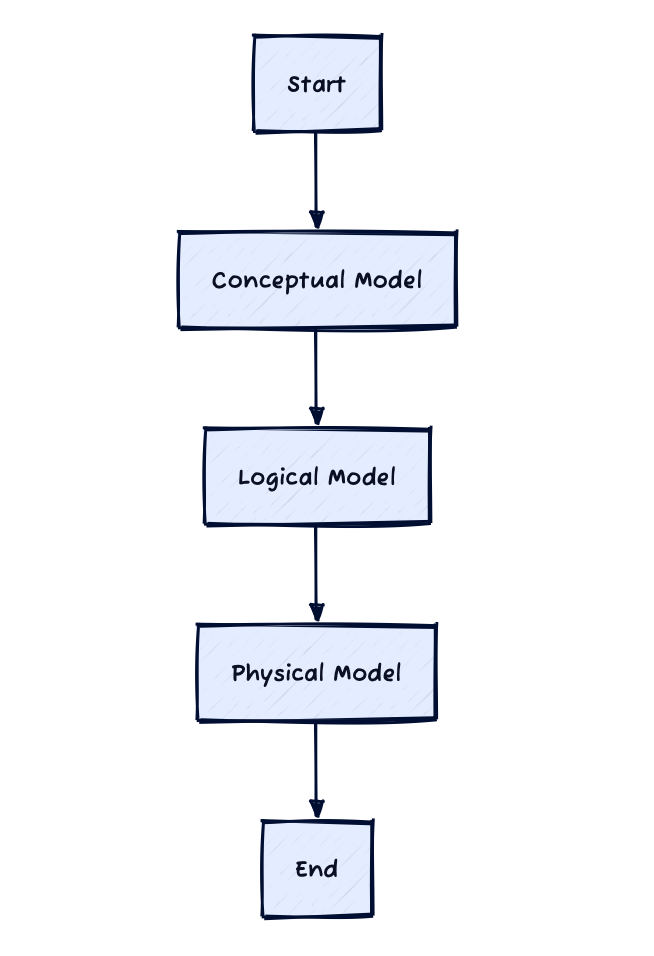
Logial vs Physical DFD
Advantages of Logical DFD
Better communication w/ users
More stable systems
Better understanding of the business by analysts
Flexibility and maintenance
Elimination of redundancies and easier creation of the physical model
Advantages of Physical DFD
Clarifying which processes are performed by humans and which are automated
Describing processes in more detail than logical DFDs
Sequencing processes that must be done in a particular order
Identifying temporary data stores
Specificying actual names of files, database tables, and printout
Adding controls to ensure th processes are done properly
CRUD matrix (create, read, update, and delete)
Tool to represent where each of these processes occurs in a system
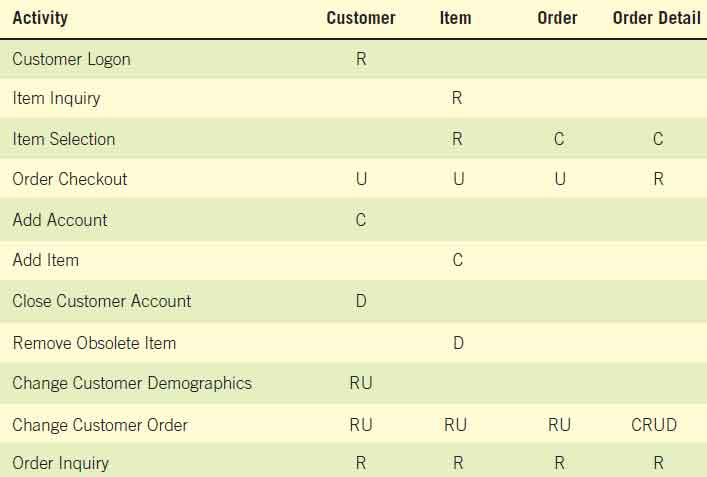
transaction data store
required to link each tasks in Physical DFD
Activties would be represented by proces on a physical DFD
base elements
data fields or elements that need to be keyed
Data Dictionaries
Reference guide about data (metadata)
Collects and coordinates data terms, and confirms what each term means to different people in the organization
derived elements
elements that are not keyed but are rather the result of a calculation or logical operation
Event Modeling and Data Flow Diagrams
The process of creating a simple data flow diagram fragment for each unique system trigger
Triggers
Start activities and processes, which in turn use data or produce outputs
Event Response Table
A table that summarizes events.
Characteristics:
DFD fragment is represented by row in the table
Rows are combined to form Diagram 0
Trigger and Response become inoput and output data flows and activity becomes the process
Must determine data stores
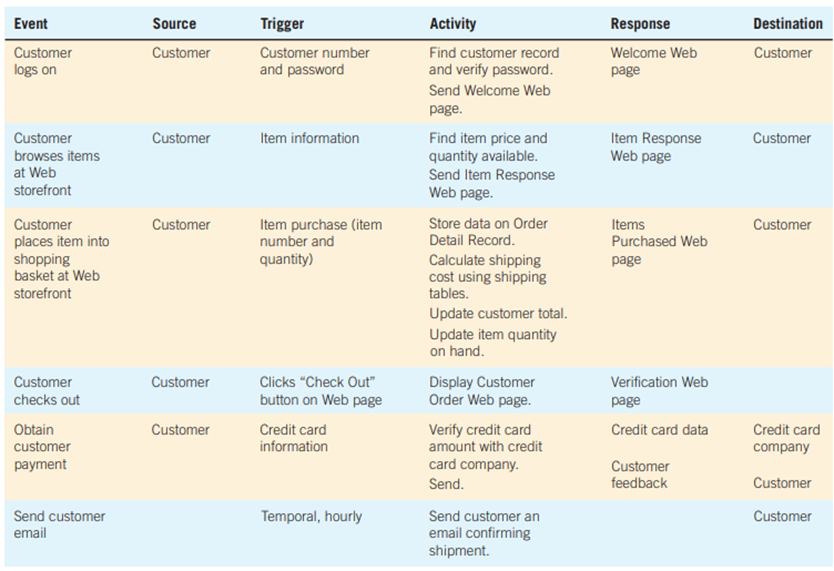
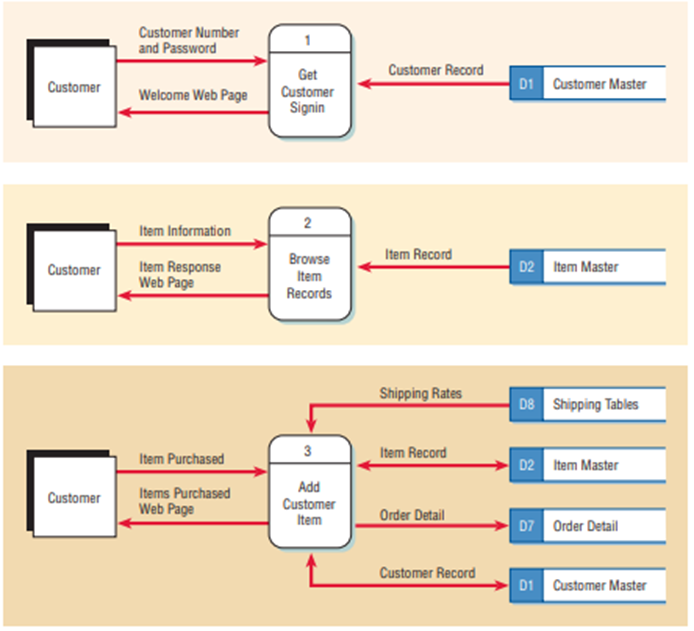
Data Flow Diagram for First Three Rows
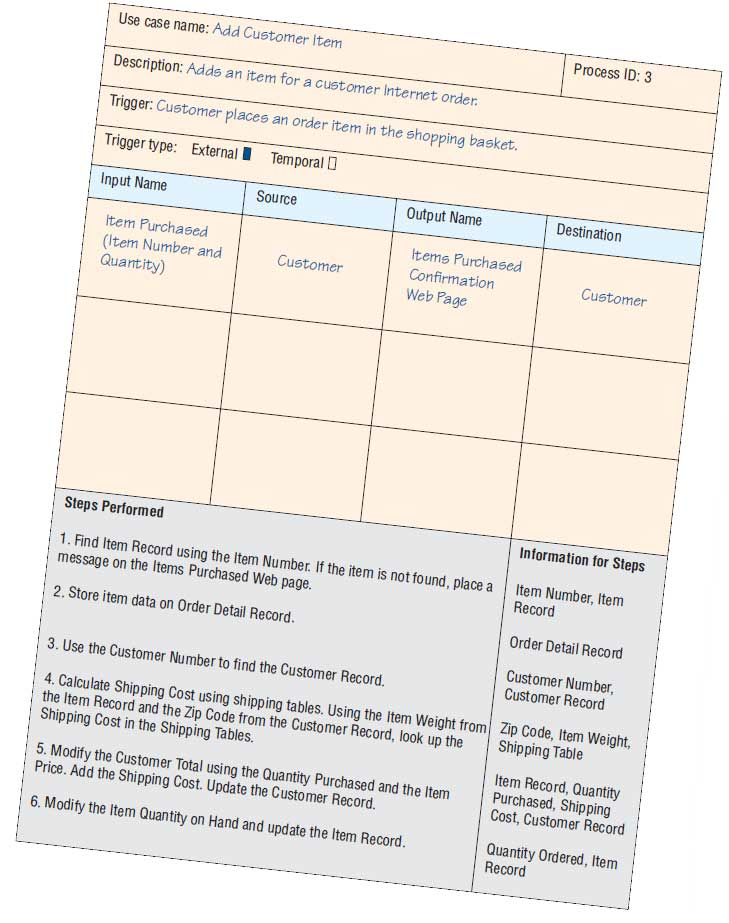
Use Case
Summarizes an event and has a similar format to process specifications
Defines one activity and its trigger, input, and output
Partitioning
The process of examining a DFD and determining how it should be divided into collections of manual procedures and collections of computer applications
Six reasons for partitioning DFDs:
Different user groups
Timing
Similar tasks
Efficiency
Consistency of data
Security
Step for Data Flow Diagram
Develop the list and summary of business activities
Crete a context-level DFD as shown
Drawing Diagram 0
Add as many processes and data stores
Draw data flows between them and the external entities
number processes and data stores
check errors
Creating a Child Diagram
Level 1 diagram
Make a list of subprocesses
Does not have to be connected to external entities
Label them 1.1, 1.2, 1.3
Create a physical data flow diagram from the logical DFD
Partitioning the Physical DFD
Partitioning Websites
Web designers may divide a website into a series of web pages
Ajax
Combination of web application development technologies that make web applications more responsive to user interaction
Communicating Using Data Flow Diagrams
DFDs are used to document the system