AP Stats Unit 6 (6.1-6.9)
1/58
There's no tags or description
Looks like no tags are added yet.
Name | Mastery | Learn | Test | Matching | Spaced | Call with Kai |
|---|
No study sessions yet.
59 Terms
confidence interval
point estimate ± margin of error
point estimate
A+B/2
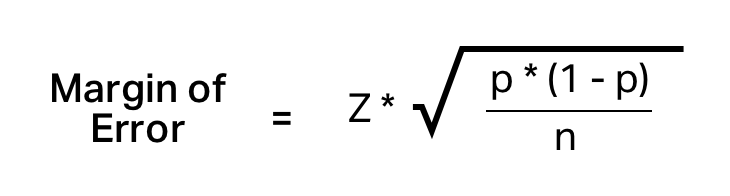
margin of error
B-A/2
interpret confidence INTERVAL
we are [C.L] confident that the interval from [A] to [B] captures the [true parameter in context]
interpret confidence LEVEL
if we take many samples and construct an interval for each, about [C.L]% of them will capture the true [parameter in context]
what does margin of error account for?
sampling variability
if confidence level increases, margin of error…
increases
what happens to the interval when you INCREASE the MOE?
widens/gets larger
if sample size increases, MOE…
decreases
what happens to the interval when you DECREASE the MOE?
narrows/gets smaller
what does MOE NOT account for?
bias
what 3 conditions must be checked?
randomness, independence/10%, large counts
why is random condition important?
to generalize data to population
why is 10%/independent condition important?
to use standard error of p-hat
why is LCC important?
to show sampling distribution is approximately Normal
general formula for confidence interval of p
point estimate ± MOE
specific formula for p
what are the 4 C’s
choose, check, calculate, conclude
what is needed in the choose step
procedure, define parameter, confidence level
what should you avoid in the calculate step
symbols
formula for MOE when choosing sample size
what is the conservative estimate
p-hat=0.5
when do we use the conservative estimate
when sample has not been taken and p-hat is unknown
what must the sample size (n) be
a whole number
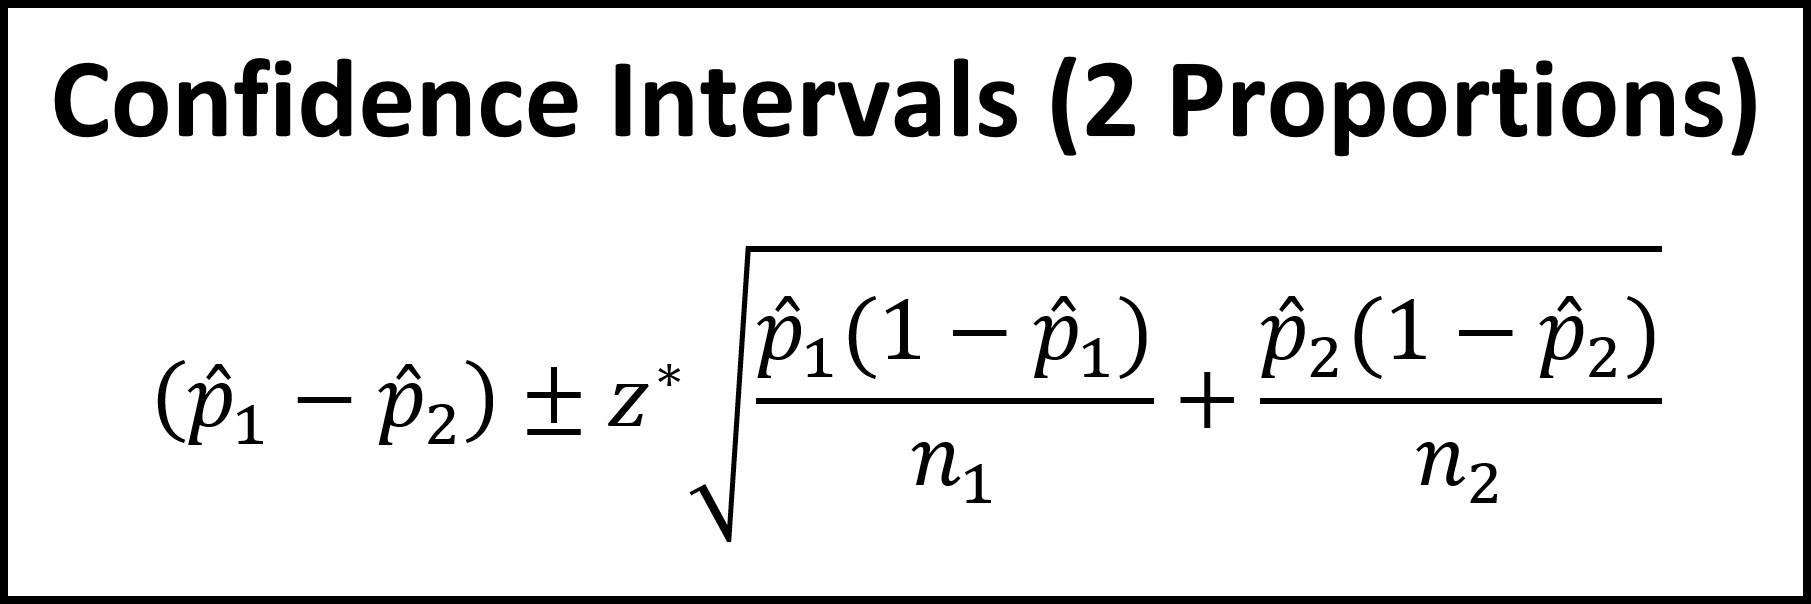
what is the procedure for a difference in proportions (p1-p2)
2 sample z interval for p1-p2
what is the procedure for a proportion
1 sample z interval for p
how many times do you need to check the conditions for a difference in proportions
twice
formula for a difference in proportions
what does a (+,+) confidence interval mean in terms of evaluating a claim
convincing evidence p1 is greater
what does a (-,-) confidence interval mean in terms of evaluating a claim
convincing evidence p2 is greater
what does a (-,+) confidence interval mean in terms of evaluating a claim
no convincing evidence of a difference
why does a (-,+) confidence interval mean no difference between proportions
because 0 is contained in the interval
what condition is skipped when there is no random sampling
10%/independence
what do you check in the Normal condition if the population distribution is not Normal
central limit theorem (CLT)
what if the CLT is still not met
quote or point from question that sample has no major skew or outliers
critical value for proportions
z*
critical value for means
t*
why do we use t* for means
because standard deviation is unknown
what do we use in Desmos for means instead of mean and standard deviation
degrees of freedom
degrees of freedom formula
df=n-1
as degrees of freedom increase, variance…
decreases
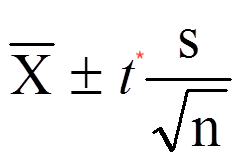
procedure for interval for means
1 sample t interval for μ
define μ
true mean of [parameter in context]
mean interval formula
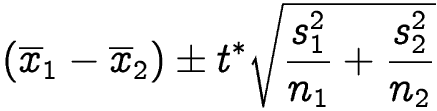
procedure for difference in means
2 sample t interval for μ1-μ2
define μ1-μ2
true difference in means of [parameter in context]
if have independent random sample and/or RA
need check 10% condition
formula for difference of means
for which μ do you use their degree of freedom
the smaller one
what are the ONLY 2 things needed to be written if using Desmos for calculating difference of means
confidence interval and degrees of freedom used
procedure for mean difference
1 sample t interval for μD OR paired t interval for μD
define μD
true mean difference of [parameter in context]
how to determine sampling method used
read context of the problem
what do you treat differences as
1 sample of differences
formula for mean difference
x-bar ± t* sD/√n
what is compared in difference of means
independent, unrelated samples
what is compared in mean difference
paired data
what IS mean difference
average of differences of paired samples
how to change bounds of an interval
multiply by new given sample size and other value