Significance Testing
1/9
There's no tags or description
Looks like no tags are added yet.
Name | Mastery | Learn | Test | Matching | Spaced |
|---|
No study sessions yet.
10 Terms
P-Value
The probability of the observed results if the null hypothesis is true
Type I Error
Rejecting a null hypothesis thats actually true
reporting a difference when one doesn’t exists
consequences: wasted time in replication, discredited, bad science
Type II Error
Failing to reject a null hypothesis thats actually false
reporting no difference when one exists
caused by: sampling error, measurement error, small sample sizes (power)
consequences: stop studying interesting topic, new findings missed, truth uncovered
File Drawer Effect
Significant results get published, nonsignificant findings usually dont
Expanded steps for hypothesis testing
State hypothesis
set significance level
choose test
run the test to obtain a test statistic value
determine the critical value
compare your value to the critical value
if your value is greater than the critical value, reject the null hypothesis
if your value is less than the critical value, fail to reject the null hypothesis
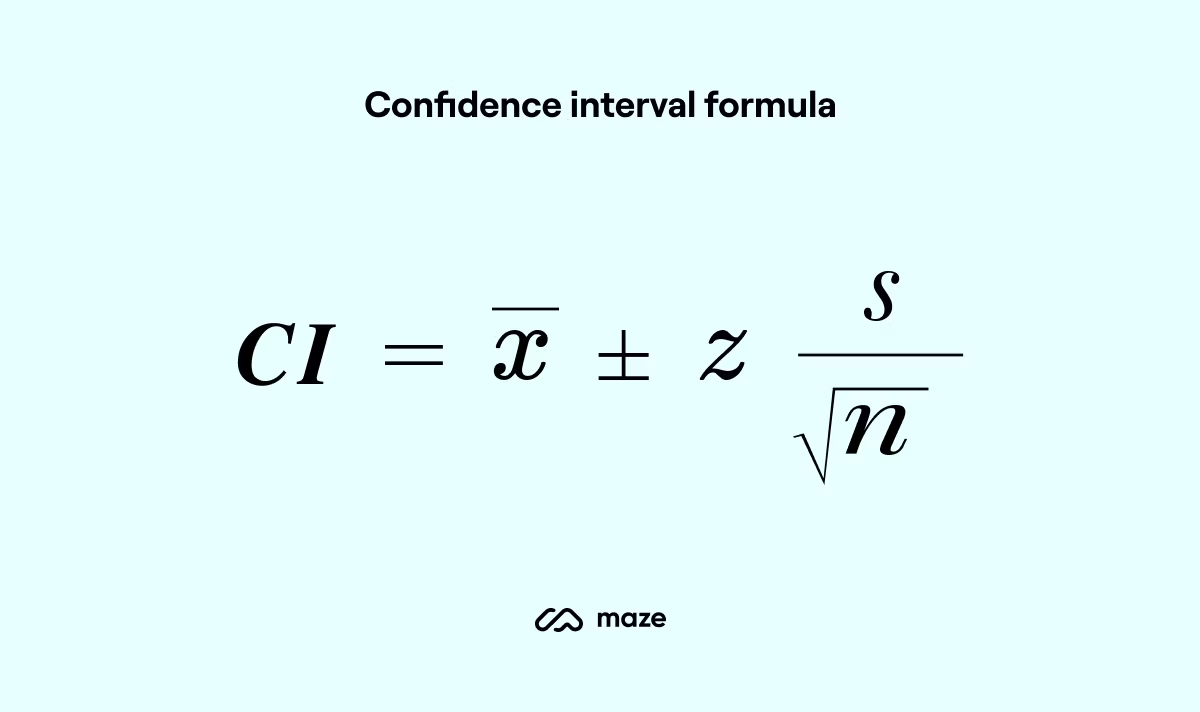
Confidence Intervals
Estimated range of a population mean, given sample statistic
Confidence Interval formula

90% confidence
1.645
95% confidence
1.96
99% confidence
2.58