SAM Exam Review
0.0(0)
0.0(0)
Card Sorting
1/13
Earn XP
Description and Tags
Last updated 12:05 PM on 12/13/22
Name | Mastery | Learn | Test | Matching | Spaced | Call with Kai |
|---|
No analytics yet
Send a link to your students to track their progress
14 Terms
1
New cards
Type 1 Error
Rejecting the Null Hypothesis when it was true
2
New cards
When is a poisson distribution used?
When the number of trials is large and the chance of success is small
3
New cards
Type II Error
Failing to reject the null hypothesis when it was false
4
New cards

\
Non-Constant Error Variance
5
New cards

Non-Independent Errors
6
New cards

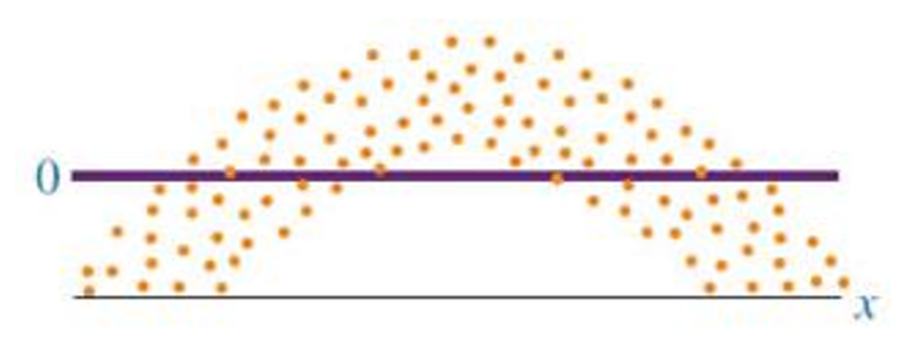
Non-Linear Residual Plot
7
New cards

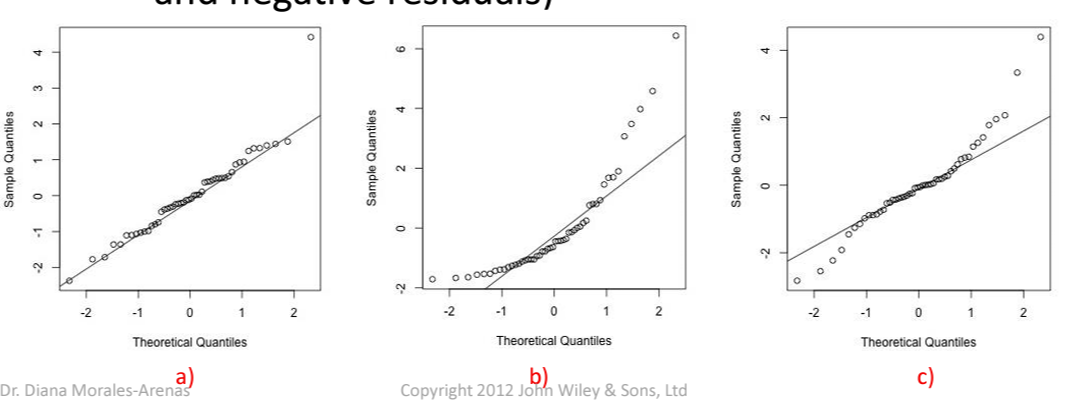
Not Normally Distributed
8
New cards
Coefficient of Determination r^2
The proportion of y variability accounted/explained by x
9
New cards
Correlation Coefficient r
Linear correlation between x and y, direction of the relationship between two variables
10
New cards
Central Limit Theorem
As the number of random variables being averaged increases the distribution of the average will approach a normal distribution. As Sample size increases the standard deviation decreases
11
New cards

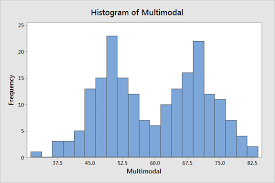
Vertical Bar chart of frequencies
Histogram
12
New cards

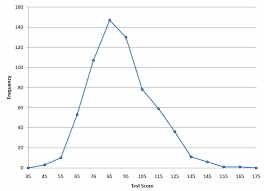
Line Graph of Frequencies
Frequency Polygon
13
New cards
Line graph of cumulative frequencies
Ogive
14
New cards
Bar & Line with bars in descending order and line showing cumulative total for each category
Pareto Chart