Chapter 9 - Aggregate Demand and Aggregate Supply
5.0(1)
Studied by 42 peopleCard Sorting
1/59
Last updated 4:58 PM on 4/1/23
Name | Mastery | Learn | Test | Matching | Spaced | Call with Kai | Chat |
|---|
No analytics yet
Send a link to your students to track their progress
60 Terms
1
New cards
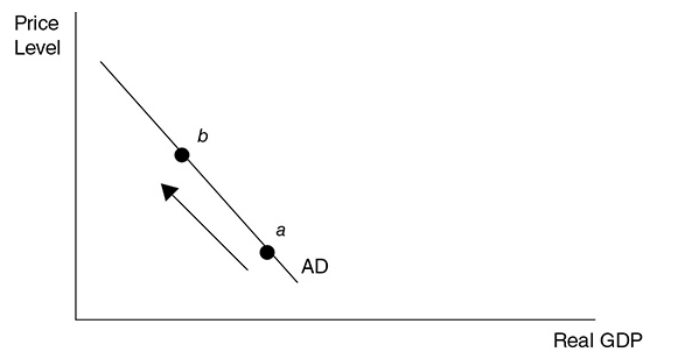
Aggregate demand (AD)
The inverse relationship between all spending on domestic output and the aggregate price level of that output
2
New cards
From how many sources does demand in macroeconomy comes from
Four general sources used to calculate real GDP
3
New cards
what does AD measures
AD measures the sum of consumption spending by households, investment spending by firms, government purchases of goods and services, and net exports (exports minus imports).
4
New cards
Foreign sector substitution effect
Goods and services produced in other nations
5
New cards
Interest rate effect
Goods and services in the future
6
New cards
Wealth effect
Money and financial assets
7
New cards
what does the combination of the foreign sector substitution, interest rate, and wealth effects predict
a downward-sloping AD curve
8
New cards
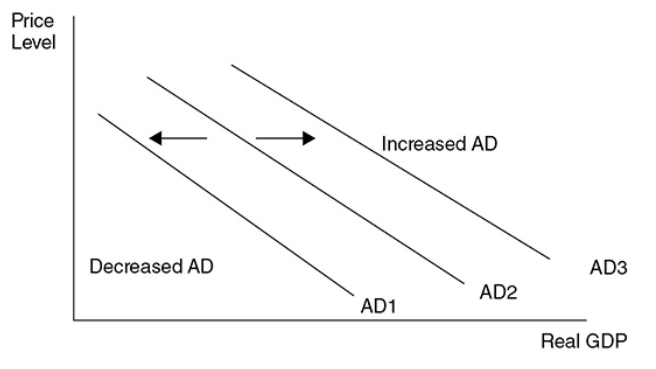
AD is the sum of the four components of domestic spending \[C, I, G, (X-M)\], if any of these components increases
AD increases increasing real GDP
9
New cards
If the AD components decrease
AD decreases decreasing real GDP

10
New cards
Components of AD
* Consumer Spending (C)
* Investment Spending (I)
* Government Spending (G)
* Net Exports (X-M)
* Foreign incomes
* Consumer tastes
* Exchange rates
* Investment Spending (I)
* Government Spending (G)
* Net Exports (X-M)
* Foreign incomes
* Consumer tastes
* Exchange rates
11
New cards
Aggregate supply (AS)
The relationship between the aggregated price level of all domestic output and the level of domestic output produced
12
New cards
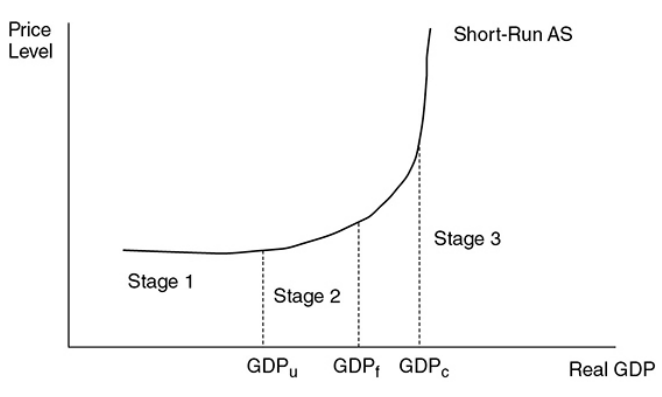
Short-run aggregate supply (SRAS)
The positive relationship between the level of domestic output produced and the aggregate price level of that output
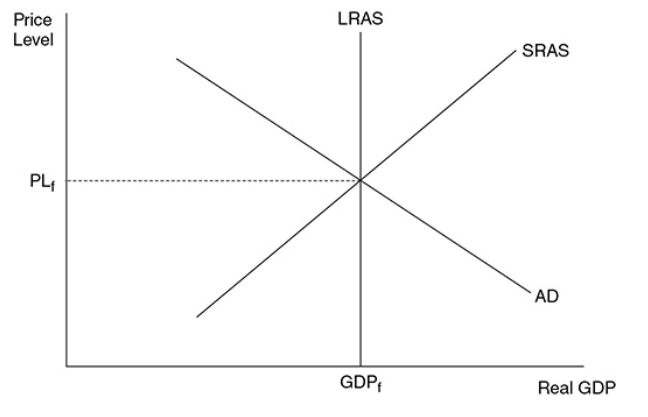
13
New cards
What happens in the macroeconomic short run period of time
The prices of goods and services are changing in their respective markets, but input prices have not been adjusted to those product market changes.
\
The curve is drawn as upward sloping.
\
The curve is drawn as upward sloping.
14
New cards
GDPu
Low production
15
New cards
GDPf
Full employment
16
New cards
GDPc
Nation’s productive capacity
17
New cards
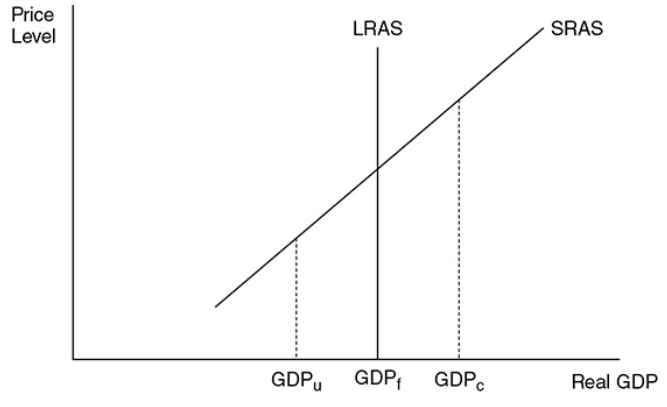
What happens in the macroeconomic long run
The input prices have enough time to fully adjust to market forces. Here all product and input markets are balanced, and economy is at full employment (GDPf)
18
New cards
Classical school of economics
Asserts that the economy always gravitates toward full employment.
19
New cards
what is the cornerstone of classical macroeconomics
A vertical AS curve.
20
New cards
Terms on vertical axis
Aggregate price level or PL
21
New cards
Terms on horizontal axis
Real output or real GDP
22
New cards
Most common factor that affects short-run AS
An economy-wide change in input (or factor) prices.
23
New cards
Short-Run Shifts
* Input prices
* Tax policy
* Deregulation
* Political or environmental phenomena
* Tax policy
* Deregulation
* Political or environmental phenomena
24
New cards
Input prices
If input prices fall economy-wide, the short-run AS curve increases without changing the level of full employment
25
New cards
Tax policy
If these “supply-side taxes” are lowered, short-run AS shifts to the right.
26
New cards
Deregulation
When the regulation of industries restrict their ability to produce, the short-run AS likely increases
27
New cards
Political or environmental phenomena
For larger nations, wars and natural disasters can decrease the short-run AS without permanently decreasing the level of full employment. For smaller ones, it could be a permanent decrease in the ability to produce.
28
New cards
Long-Run Shifts
* Availabity of resources
* Technology and productivity
* Policy incentives
* Technology and productivity
* Policy incentives
29
New cards
Availability of resources
A larger labor force, larger stock of capital, or more widely available natural resources can increase the level of full employment
30
New cards
Technology and productivity
Better technology raises the productivity of both capital and labor.
31
New cards
Policy incentives
If policy provides large incentives to quickly find a job, full-employment real GDP rises. If government gives tax incentives to invest in capital or technology, GDPf rises.
32
New cards
what indicates a shift to the right of LRAS
economic growth
33
New cards
Determinants of AS
AS is a function of many factors that impact the production capacity of the nation. If these factors make it easier, or less costly, for a nation to produce, AS shifts to the right. If these factors make it more difficult, or more costly, for a nation to produce, AS shifts to the left.
34
New cards
Macroeconomic equilibrium
Occurs when the quantity of real output demanded is equal to the quantity of real output supplied.
35
New cards
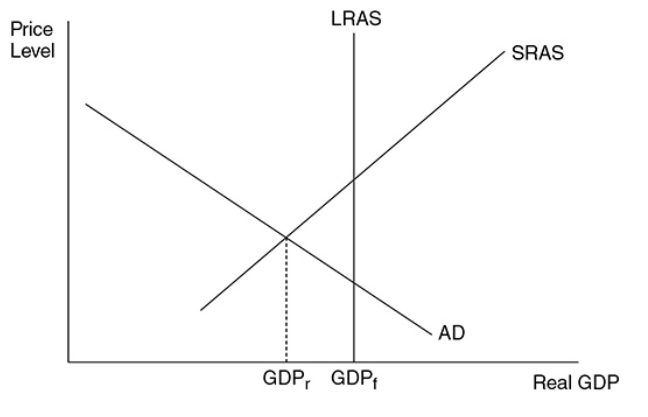
Recessionary gap
The amount by which full-employment GDP exceeds equilibrium GDP
36
New cards
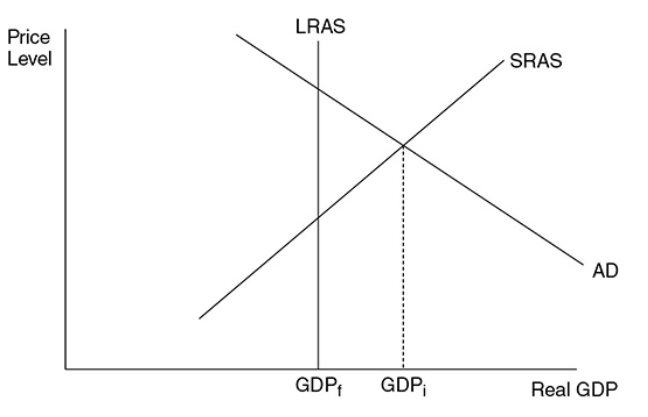
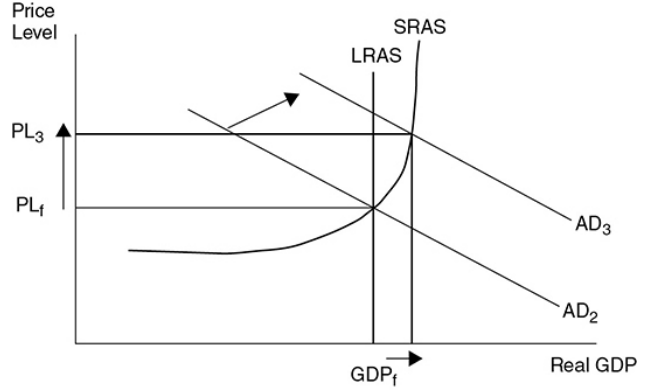
Inflationary gap
The amount by which equilibrium GDP exceeds full employment GDP
37
New cards
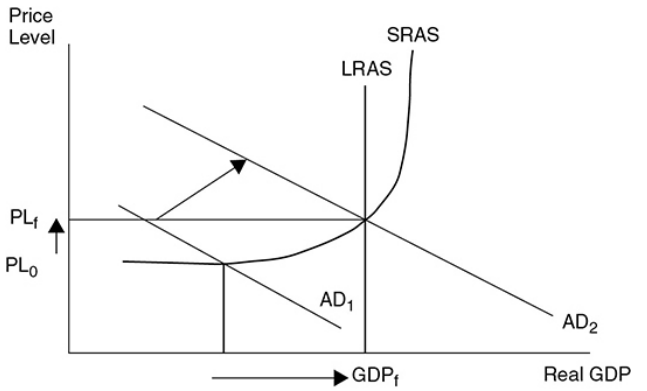
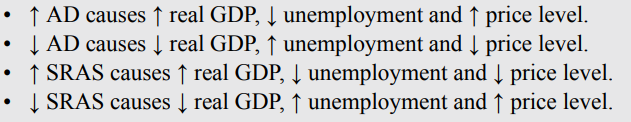
Demand-pull inflation
This inflation is the result of stronger consumption from all sectors of AD as it continues to increase in the upward-sloping range of SRAS.
38
New cards
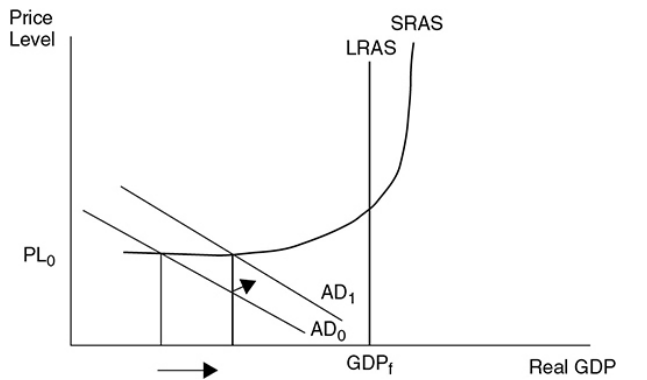
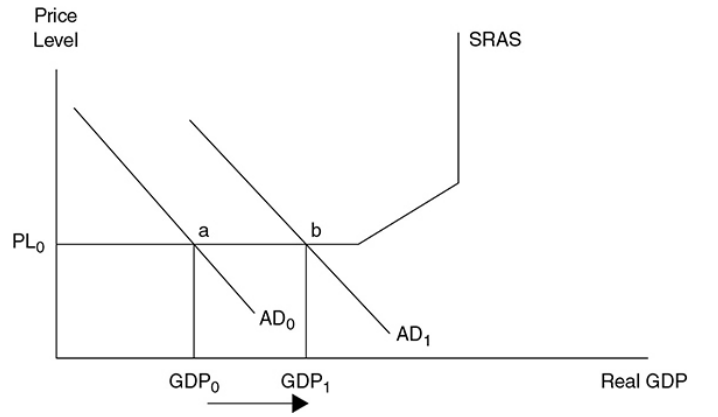
what happens when AD increases from 0 to 1
The price level may only slightly increase, while real GDP significantly increases and the unemployment rate falls.
39
New cards
what happens when AD increases from 1 to 2
The price level begins to rise and inflation is felt in the economy.
40
New cards
what happens when AD increases past 3
Inflation is quite significant and real GDP experiences minimal increases.
41
New cards
Recession
In the AD and AS model, a recession is typically described as falling AD with a constant SRAS curve. Real GDP falls far below full employment levels and the unemployment rate rises.
42
New cards
Deflation
A sustained falling price level, usually due to severely weakened aggregate demand and a constant SRAS
43
New cards
Most common cause of recession
Falling AD because it lowers real GDP and increases unemployment rate.
44
New cards
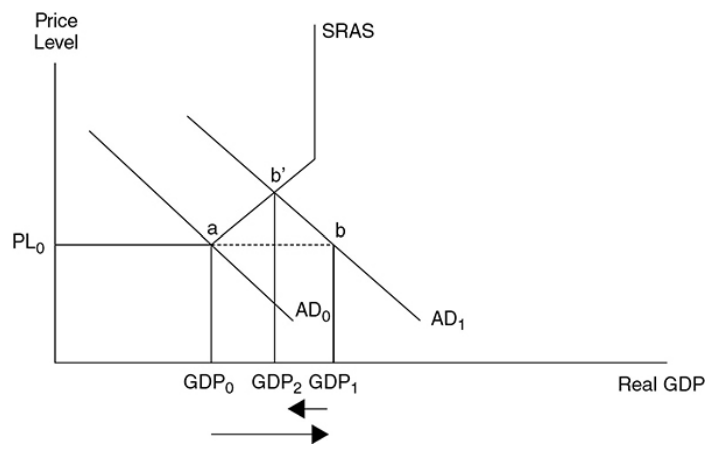
when is the full multiplier effect only observed
when the price level does not increase
45
New cards
when is the full multiplier effect not observed
when there’s no increase in the price level
46
New cards
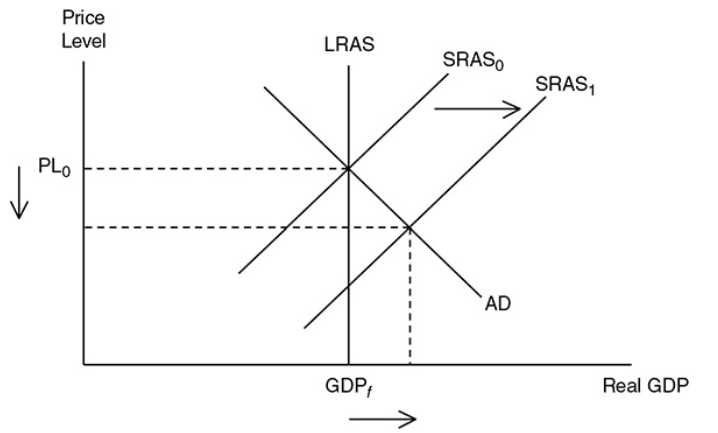
Supply-side boom
When the SRAS curve shifts outward and the AD curve stays constant, the price level falls, real GDP increases and the unemployment rate falls
47
New cards
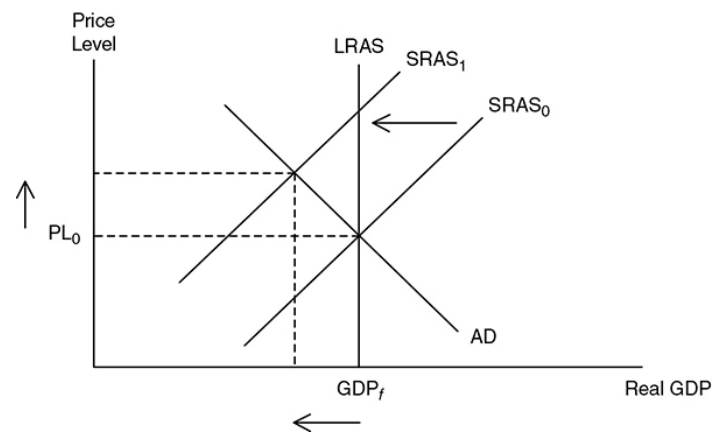
Stagflation (Cost-push inflation)
A situation in the macroeconomy when inflation and the unemployment rate are both increasing.
48
New cards
whats the cause of falling SRAS when AD is constant
stagflation
49
New cards
best possible macroeconomic situation
an increase in SRAS
50
New cards
one of the worst possible macroeconomic situation
decrease in SRAS
51
New cards
what does a decrease in SRAS create
Inflation, it lowers real GDP and increases unemployment rate.
52
New cards
Supply shocks
An economy-wide phenomenon that affects the costs of firms and the position of the SRAS curve, either positively or negatively
53
New cards
Positive supply shocks
It’s the result of higher productivity or lower energy prices
54
New cards
Negative supply shocks
Usually occur when economy-wide input prices suddenly increase.
55
New cards
One of the hallmarks of a recession
a decreased demand for many factors of production
56
New cards
what happens if AD rises
price level and real GDP rises
57
New cards
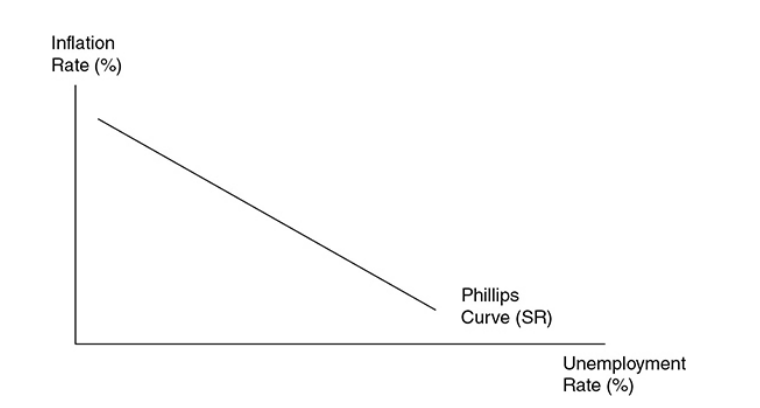
Phillips curve
A graphical device that shows the relationship between inflation and the unemployment rate. It shows the inverse relationship between inflation and unemployment rate.
58
New cards
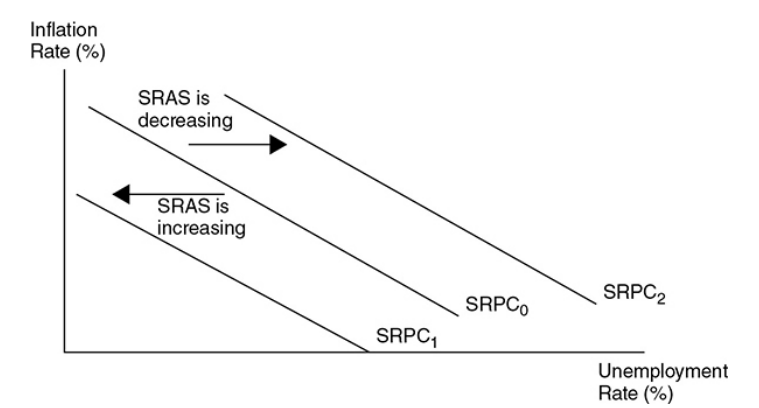
effect of supply shocks on the phillips curve
Supply shocks shift the Phillips curve inward when SRAS shifts to the right and outward when SRAS shifts to the left.
59
New cards
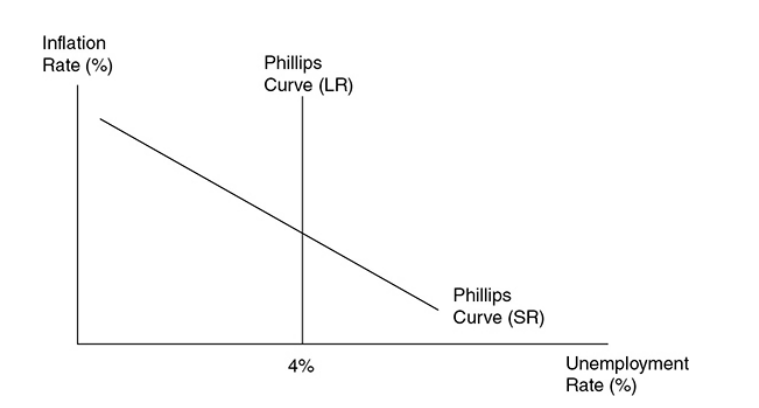
whats the phillips curve like at the natural rate of employment
vertical
60
New cards
Natural rate of employment
The unemployment rate where cyclical unemployment is zero