SCHM 2301 Exam 2
0.0(0)
Studied by 2 peopleCard Sorting
1/105
Earn XP
Description and Tags
Last updated 11:18 PM on 10/31/22
Name | Mastery | Learn | Test | Matching | Spaced | Call with Kai | Chat |
|---|
No analytics yet
Send a link to your students to track their progress
106 Terms
1
New cards
demand planning
- why is forecasting important?
- what can/should be forecast? (besides sales)
- which departments use forecasting?
- how often is forecasting done?
- what can/should be forecast? (besides sales)
- which departments use forecasting?
- how often is forecasting done?
2
New cards
types of forecasts
point forecasts and range forecasts
3
New cards
which forecast is more accurate?
range forecast, but point is still used because as a manager, you have to act on a certain number
4
New cards
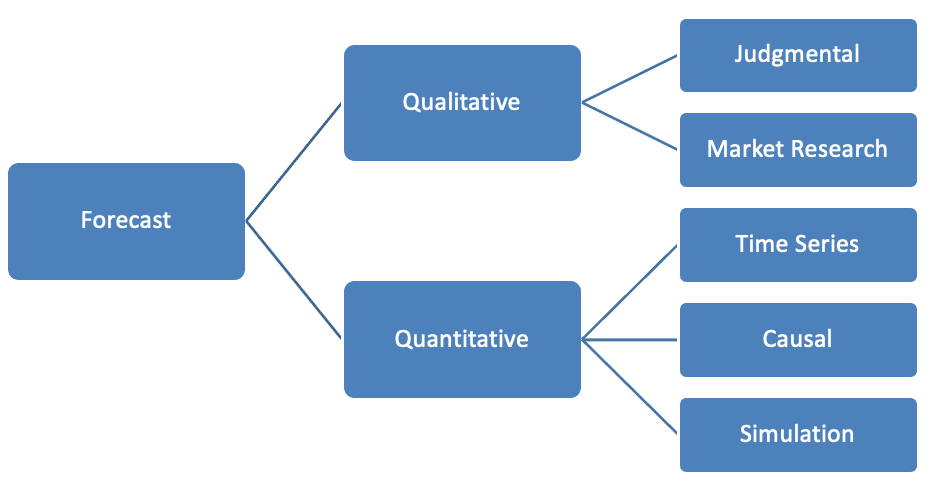
forecasting method chart
5
New cards
grassroots
input from those close to products or customers
6
New cards
executive judgment
input from those with experience (and power!)
7
New cards
historical analogy
assume past demand is a good predictor of future demand
8
New cards
delphi method
input from panel of experts
9
New cards
marketing research
examine patterns of current customers (focus groups, customer surveys)
10
New cards
qualitative forecast methods
- grassroots
- executive judgment
- historical analogy
- delphi method
- marketing research
- executive judgment
- historical analogy
- delphi method
- marketing research
11
New cards
quantitative forecasting methods
- time series analysis
- causal modeling
- simulation models
- causal modeling
- simulation models
12
New cards
time series analysis
- forecasts are based solely on past historical demand
- identifies and measures patterns in data
- assumes that patterns will continue int he future
- "black box" approach
- identifies and measures patterns in data
- assumes that patterns will continue int he future
- "black box" approach
13
New cards
causal modeling
- assumes demand is influenced by one or more factors
- identified important factors and measures their effects
- identified important factors and measures their effects
14
New cards
simulation models
- sophisticated techniques that allow for the evaluation of multiple business scenarios
15
New cards
qualitative vs quantitative forecasting methods
qualitative
- subjective and judgmental
- can integrate "soft" data
- can be used for new products
- better w one-off events
quantitative
- objective and statistical
- can handle large data sets
- consistent
- efficient
- requires "hard" data
- subjective and judgmental
- can integrate "soft" data
- can be used for new products
- better w one-off events
quantitative
- objective and statistical
- can handle large data sets
- consistent
- efficient
- requires "hard" data
16
New cards
advantages of causal modeling
- better fro long-range forecasting
- typically better for predicting shifts (or turning points) in data patterns
- can generate a better understanding of the mechanisms influencing sales/demands
- typically better for predicting shifts (or turning points) in data patterns
- can generate a better understanding of the mechanisms influencing sales/demands
17
New cards
disadvantages of causal modeling
- requires more data
- requires special expertise that many managers don't have
- requires special expertise that many managers don't have
18
New cards
time series analysis
- multiple identifiable patterns in demand
- random fluctuations
- trend
- seasonality
- cyclicality
- typically multiple patterns coexist but can be separated and identified
- goal: extrapolate
- random fluctuations
- trend
- seasonality
- cyclicality
- typically multiple patterns coexist but can be separated and identified
- goal: extrapolate
19
New cards
simple moving average
- simple average places same weight/emphasis on all past demand periods
- method works well when demand is fairly stable over time
- decreasing the number of periods in forecast, creates a more responsive forecast
- forecast lags demand because of averaging effect
- as such, this method doesn't do a good job of forecasting when trends are present in the data
- method works well when demand is fairly stable over time
- decreasing the number of periods in forecast, creates a more responsive forecast
- forecast lags demand because of averaging effect
- as such, this method doesn't do a good job of forecasting when trends are present in the data
20
New cards
weighted moving average
- weighted moving average allows greater emphasis to be placed on more recent data points to reflect changes in the demand
- weights used can be used based on forecaster's experience
- decreasing the numbers of periods in forecast and/or increasing the size of the weights, creates a more responsive forecast
- forecast still lags the demand because of averaging effect
- as such, this method doesn't do a good job of forecasting when trends are present in the data
21
New cards
evaluating forecasts
- quality of a forecast depends on:
- accuracy (how close is the foercast to actual/observed demand?
- bias (are there systematic deviations from actual demand)
- evaluation of forecasting models- forecast errors are used to evaluate a forecasting model
- measures of forecasting errors
- absolute
- relative
- accuracy (how close is the foercast to actual/observed demand?
- bias (are there systematic deviations from actual demand)
- evaluation of forecasting models- forecast errors are used to evaluate a forecasting model
- measures of forecasting errors
- absolute
- relative
22
New cards
formula for forecast error
𝑒𝑡=𝑑𝑡−𝐹𝑡
23
New cards
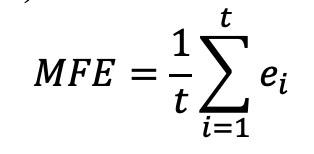
mean forecast error (MFE)
- average of forecast errors from period 1 to t (current period)
- measure of bias, but not accuracy
- smaller MFE = relatively unbiased forecasts
- larger MFE = biased forecasts, which indicates overestimation or underestimation
- measure of bias, but not accuracy
- smaller MFE = relatively unbiased forecasts
- larger MFE = biased forecasts, which indicates overestimation or underestimation
24
New cards
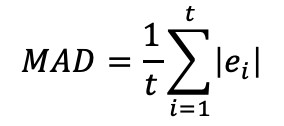
mean absolute deviation (MAD)
- average of absolute values of forecast errors
- measures the dispersion (variance) of forecasting errors
- positive and negative forecast errors do not cancel out each other
- smaller MAD = relatively more accurate forecasts
- larger MAD = relatively less accurate forecasts
- measures the dispersion (variance) of forecasting errors
- positive and negative forecast errors do not cancel out each other
- smaller MAD = relatively more accurate forecasts
- larger MAD = relatively less accurate forecasts
25
New cards
mean squared error (MSE)
- average of squared values of forecast errors
- MSE is similar to MAD in that
- another measure of dispersion (variance) of the forecasting errors
- positive and negative forecast errors do not cancel out each other
- smaller MAD = relatively more accurate forecasts
- larger MAD = relatively less accurate forecasts
- MSE is similar to MAD in that
- another measure of dispersion (variance) of the forecasting errors
- positive and negative forecast errors do not cancel out each other
- smaller MAD = relatively more accurate forecasts
- larger MAD = relatively less accurate forecasts
26
New cards
what are the differences between MSE and MAD?
- MSE penalizes larger forecasts errors to a greater degree
- MSE is sensitive to extreme forecast errors (outliers)
- MSE is sensitive to extreme forecast errors (outliers)
27
New cards
mean absolute percent error (MAPE)
- standardizes the forecast errors w respect to the actual demand
- measures the average relative magnitude of the forecasts errors
- express as a percentage of the actual demand
- very popular!
- measures the average relative magnitude of the forecasts errors
- express as a percentage of the actual demand
- very popular!
28
New cards
sales and operations planning (S&OP)
- process for integrating marketing and operations plan to develop a tactical plan
- attempt to balance supply and demand
- attempt to balance supply and demand
29
New cards
problems with sales and operations planning
- independent planning can lead to strategic misalignment
- sales and operations blame each other for problems, changing schedules, plans, etc
- big differences between budget and actual results
- low service levels or high cost of servicing customers
- capacity utilization, forecast accuracy, obsolete inventory, product-to-market time and transportation costs are not understood/measured, and corrective action plans are not developed
- new products regularly miss their launch dates
- product phase-outs are costly and generally involve inventory excess
- SKU proliferation
- promotional campaigns and activities cause major swings in inventory and service levels resulting in higher operational costs than budgeted
30
New cards
quantitative benefits of S&OP planning
- improved forecast accuracy
- higher customer service
- more stable supply
- better new product intro
- higher customer service
- more stable supply
- better new product intro
31
New cards
qualitative benefits of S&OP planning
- better org teamwork
- faster and better aligned decision making
- greater accountability for performance
- better business visibility
- faster and better aligned decision making
- greater accountability for performance
- better business visibility
32
New cards
sales & operations planning
- each firm has a slightly different S&OP process customized for industry and firm characteristics
- aggregate level
- product lines instead of individual SKUs
- ongoing planning process, monthly rolling horizon (12-24 months)
- structured meetings, standardized
- disciplined and repeatable
- cross-functional participation, acceptance
- continuity, updating, fine-tuning
- forecast, unconstrained demand plan
- draft supply plan and constrained demand plan
- demand and supply plans properly aligned, fine-tuned
- proper preparation for meetings
- participants empowered to make decisions
- executive support
33
New cards
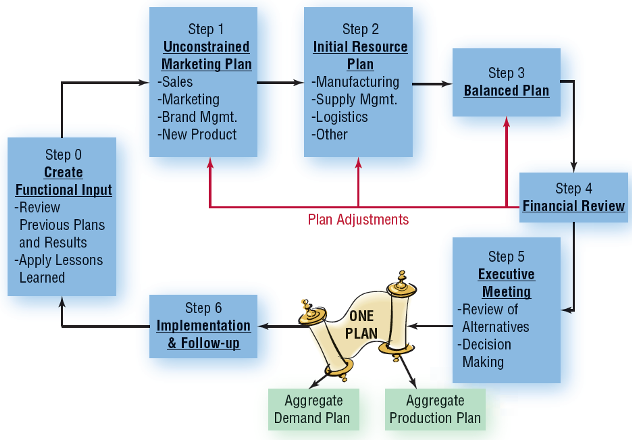
sales and operations planning steps
34
New cards
aggregate production planning
- schedule of production to meet demand
- focuses on finished goods inventory only
- raw material and WIP inventories are ignored
- capacity and labor can vary
- products are viewed aggregately at product line level (instead of individual SKU level)
- focuses on finished goods inventory only
- raw material and WIP inventories are ignored
- capacity and labor can vary
- products are viewed aggregately at product line level (instead of individual SKU level)
35
New cards
aggregate production planning balances the following costs
- inventory carrying (holding) cost
- regular production cost
- overtime cost (under current capacity)
- cost of increasing production (capacity)
- cost of decreasing production (capacity)
- backorder/lost sales
- subcontracting (outsourcing)
- regular production cost
- overtime cost (under current capacity)
- cost of increasing production (capacity)
- cost of decreasing production (capacity)
- backorder/lost sales
- subcontracting (outsourcing)
36
New cards
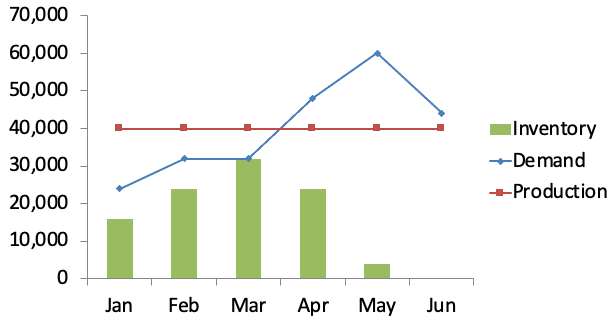
aggregate production planning level
produce at a constant rate, use changing inventory levels to buffer supply and demand
37
New cards
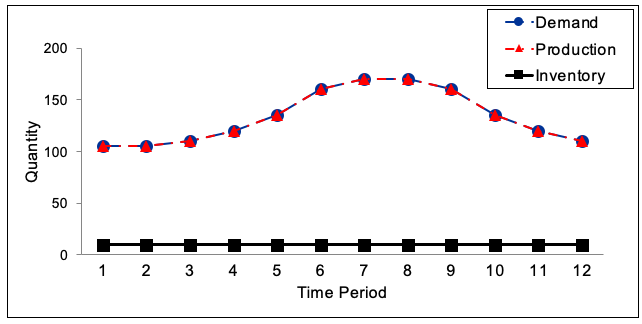
aggregate production planning chase
change production to match demand, inventory remains relatively stable and low
38
New cards
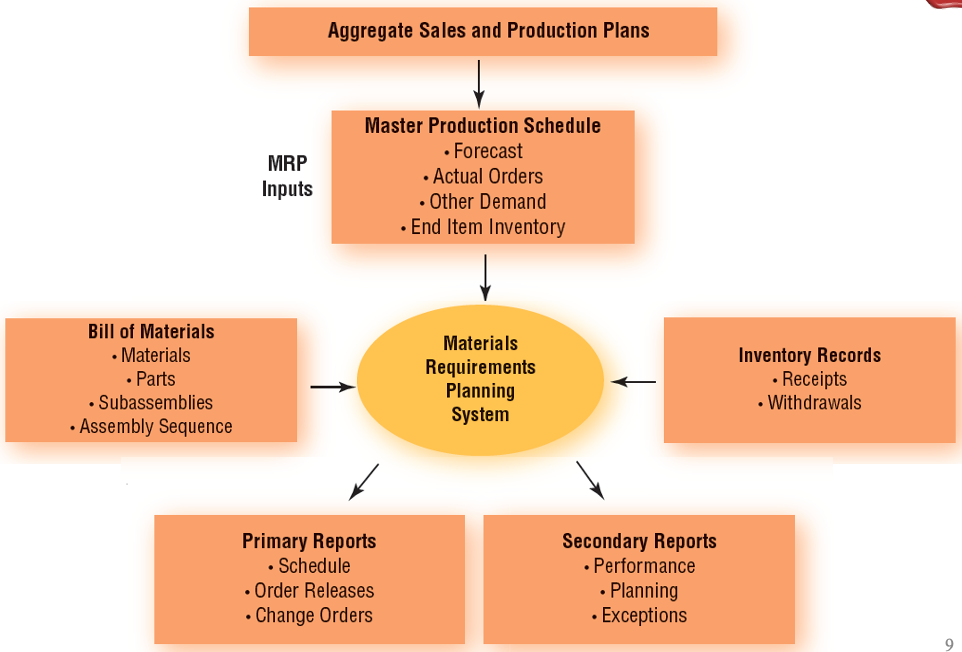
what is MRP?
- material: raw materials and WIP inventories
- requirement: what do you need when, how much?
- planning: schedule
- requirement: what do you need when, how much?
- planning: schedule
39
New cards
goals of a MRP
- ensure availability of materials, components, products for planned production
- maintain lowest possible inventory level
- plan manufacturing activities, delivery schedules, purchasing activities
- maintain lowest possible inventory level
- plan manufacturing activities, delivery schedules, purchasing activities
40
New cards
MRP overview
41
New cards
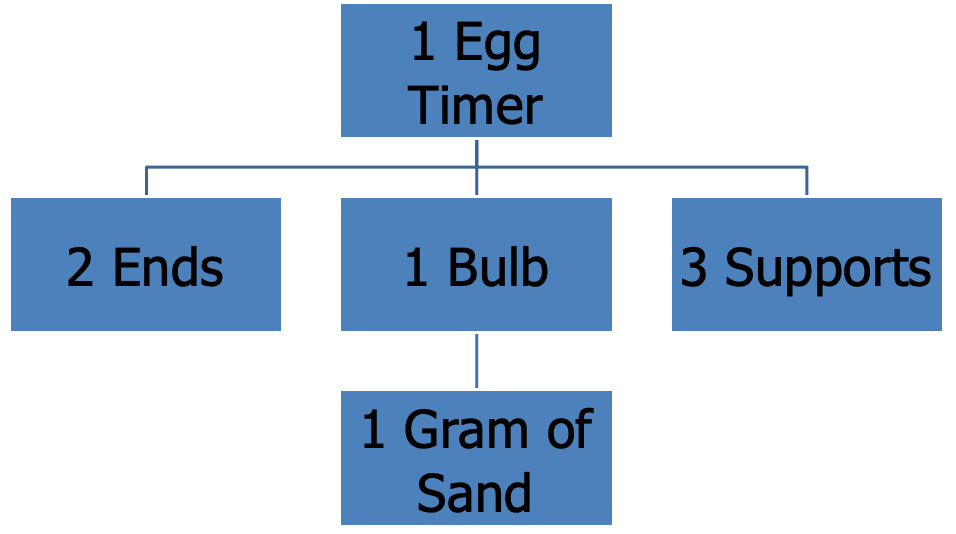
bill of materials
detailed listing of all materials needed to make an end item
42
New cards
principal advantages of MRP
- maintain reasonable safety stock
- minimize/eliminate inventories
- identification of process probs
- production schedules based on actual demand
- coordination of materials ordering
- most suitable for batch or intermittent production schedules
- minimize/eliminate inventories
- identification of process probs
- production schedules based on actual demand
- coordination of materials ordering
- most suitable for batch or intermittent production schedules
43
New cards
principal shortcomings of MRP
- computer intensive
- difficult to make changes once operating
- ordering and transportation costs may rise
- not usually as sensitive to short-term fluctuations in demand
- frequently become quite complex
- may not work exactly as intended
- difficult to make changes once operating
- ordering and transportation costs may rise
- not usually as sensitive to short-term fluctuations in demand
- frequently become quite complex
- may not work exactly as intended
44
New cards
types of inventory
- raw materials (RM)
- work in progress (WIP)
- finished goods (FG)
- work in progress (WIP)
- finished goods (FG)
45
New cards
by function
- cycle stock (working stock)- expect to sell
- safety stock (buffer stock)- not expect to sell
- seasonal stock (anticipation stock)
- in-transit stock (pipeline stock)
- decoupling stock- extra raw materials or work in progress items for all or some stages in a production line
- safety stock (buffer stock)- not expect to sell
- seasonal stock (anticipation stock)
- in-transit stock (pipeline stock)
- decoupling stock- extra raw materials or work in progress items for all or some stages in a production line
46
New cards
reasons for carrying inventory
uncertainty
- demand
- supply
- production
- transportation
economies of scale
- purchasing
- production
- transportation
- demand
- supply
- production
- transportation
economies of scale
- purchasing
- production
- transportation
47
New cards
2 types of uncertainty
uncertainty in demand and uncertainty in supply
48
New cards
uncertainty in demand
- customer demand is usually unknown
- maintain target customer service levels
- stock-out cost vs inventory carrying cost
- maintain target customer service levels
- stock-out cost vs inventory carrying cost
49
New cards
uncertainty in supply
- availability, prices may vary
- maintain uninterrupted flow of raw materials
- stock out costs vs inventory carrying costs
- maintain uninterrupted flow of raw materials
- stock out costs vs inventory carrying costs
50
New cards
uncertainty in production
- process times, sequences may vary
- minimize idle time, maximize utilization
- stock out costs vs inventory carrying costs
- minimize idle time, maximize utilization
- stock out costs vs inventory carrying costs
51
New cards
uncertainty in transportation
- transit times may vary
- avoid stock-outs due to delays
- transportation costs vs inventory costs
- avoid stock-outs due to delays
- transportation costs vs inventory costs
52
New cards
purchasing in economies of scale
- price discounts based on quantity
- purchase cost vs inventory carrying cost
- items w low storage costs tend to be bought in bulk to qualify for volume discounts
- raw materials are generally bought in bulk
- finished goods?
- purchase cost vs inventory carrying cost
- items w low storage costs tend to be bought in bulk to qualify for volume discounts
- raw materials are generally bought in bulk
- finished goods?
53
New cards
production in economies of scale
- unit production cost decreases w size of production run
- production cost has 2 components
- variable cost (cost of producing each additional unit)
- fixed cost (cost of starting a production run)
- lot-sizing costs vs inventory carrying costs
- production cost has 2 components
- variable cost (cost of producing each additional unit)
- fixed cost (cost of starting a production run)
- lot-sizing costs vs inventory carrying costs
54
New cards
transportation in economies of scale
- discounts based on quantity
- less than truckload (LTL) rates are normally higher than truck load (TL) or CL (carload) rates
- largest shipments may qualify for even lower multiple truckload, carload, or trainload rates
- lower freight rates are often reflected in lower consumer prices
- transportation costs vs inventory carrying costs
55
New cards
inventory models are either _____________ or ______________
deterministic or stochastic
56
New cards
deterministic
(under certainty)
- everything is known w certainty
- demand rate, lead time, price
- everything is known w certainty
- demand rate, lead time, price
57
New cards
stochastic
(under certainty but random)
- some variables are random so not known w certainty
- some variables are random so not known w certainty
58
New cards
economic order quantity
minimizes the sum of
- inventory carrying cost
- ordering cost
- inventory carrying cost
- ordering cost
59
New cards
costs considered in the EOQ model
- inventory carrying cost (C)
- ordering cost (P)
- unit purchase cost (V)
- ordering cost (P)
- unit purchase cost (V)
60
New cards
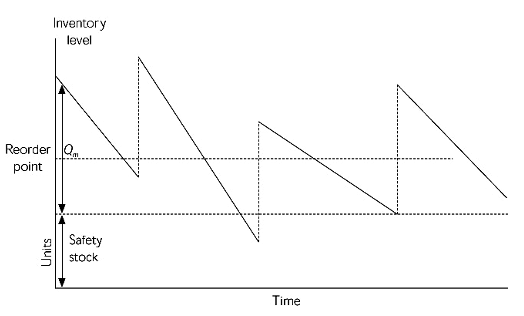
safety stock
aka buffer stock
- inventory level at the time of replenishment
- inventory level at the time of replenishment
61
New cards
factors affecting safety stock levels
- variability in demand (forecast error)
- variability in lead time
- cost of stock-out
- service level requirement
- variability in lead time
- cost of stock-out
- service level requirement
62
New cards
ABC analysis
ranking system
- developed in 1951 by H. Ford Dicky of General Electric
- suggested that GE classify items according to relative sales volume, cash flows, lead time, or stockout cost
- most important inventory put in Group A
- lesser impact goods put in Groups B and C respectively
- developed in 1951 by H. Ford Dicky of General Electric
- suggested that GE classify items according to relative sales volume, cash flows, lead time, or stockout cost
- most important inventory put in Group A
- lesser impact goods put in Groups B and C respectively
63
New cards
Pareto's Rule (80-20 rule)
- based on 19th century mathematician's observation that many situations were dominated by a very few elements
- conversely, most elements had very little influence in most situations
- separates the "trivial many" from the "vital few"
- 80% of sales will come from 20% of the inventory SKUs
- 20% of sales will come from 80% of the inventory SKUs
- found to explain many phenomena that interest managers like 80% of sales come from 20% of customers and vice versa
64
New cards
financial impact of inventory
profitability- inventory carrying costs
financial ratios like:
- return on assets
- return on investment
- profitability ratios
financial ratios like:
- return on assets
- return on investment
- profitability ratios
65
New cards
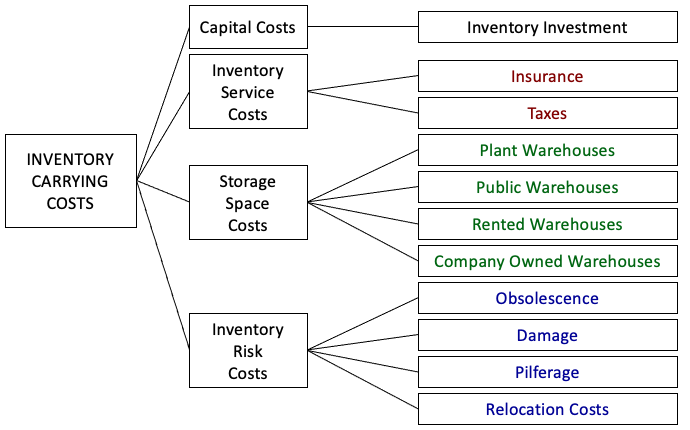
inventory carrying cost
- cost associated w amount of inventory stored
- easier to calculate as percentages
- has multiple cost components
- capital costs
- inventory service costs
- storage costs
- inventory risk costs
- easier to calculate as percentages
- has multiple cost components
- capital costs
- inventory service costs
- storage costs
- inventory risk costs
66
New cards
capital cost
- opportunity cost associated w investing in inventory or any asset
- what is the implicit value of having capital tied up in inventory, instead of some other worthwhile project?
- minimum ROR expected from any asset
- debate on inventory valuation at fully allocated or variable costs only
- what is the implicit value of having capital tied up in inventory, instead of some other worthwhile project?
- minimum ROR expected from any asset
- debate on inventory valuation at fully allocated or variable costs only
67
New cards
storage space cost
- handling costs, rents, utilities
- logistics develop a cost formula for storage space costs based on cost behaviors
- public space mostly variable
- private space a mix of fixed and variable
- logistics develop a cost formula for storage space costs based on cost behaviors
- public space mostly variable
- private space a mix of fixed and variable
68
New cards
inventory service cost
- insurance and taxes on stored goods
- varies according to the value of goods
- varies according to the value of goods
69
New cards
inventory risk cost
- largely beyond the control of the firm
- due to obsolescence, damage, theft, employee pilferage
- due to obsolescence, damage, theft, employee pilferage
70
New cards
inventory turns
- VERY VERY VERY important
- inventory turns measure inventory levels w respect to sales
- turns = (annual demand) / (average inventory level)
- inventory turns measure inventory levels w respect to sales
- turns = (annual demand) / (average inventory level)
71
New cards
all else being equal, lower inventory levels imply ___________ inventory turns
higher
72
New cards
all else being equal, higher inventory turns imply ___________ inventory levels
lower
73
New cards
inventory turns affect
- inventory carrying costs
- rate of return
- rate of return
74
New cards
inventory turns and inventory carrying cost
- annual ICC = ave inv level x unit value x PICC
- ave inv level = (annual demand)/(turns)
- ave inv level = (annual demand)/(turns)
75
New cards
as turns increases
ave inv level decreases
76
New cards
as ave inv level decreases
annual inventory carrying cost decreases as well
77
New cards
dependent demand
- just in time (JIT)
- materials requirement planning (MRP)
- materials requirement planning (MRP)
78
New cards
independent demand
- fixed order quantity (ex. EOQ)
- fixed order interval
- fixed order interval
79
New cards
pulls system
- pull approach- reactive system relying on customer demand to pull product through a logistics system
- respond quickly to sudden or abrupt changes in demand, involve one way communications, apply more to independent demand situations
- respond quickly to sudden or abrupt changes in demand, involve one way communications, apply more to independent demand situations
80
New cards
push systems
- push approach- proactive system and uses inventory replenishment to anticipate future demand
- use an orderly and disciplined master plan for inventory management and apply more to dependent demand situations
- use an orderly and disciplined master plan for inventory management and apply more to dependent demand situations
81
New cards
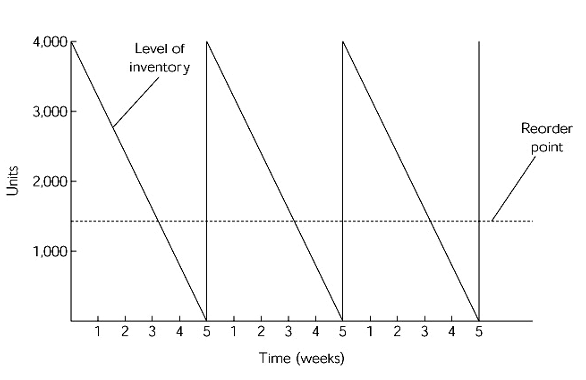
fixed order quantity approach
- condition of certainty: inventory cycle
ex. each cycle starts w 4,000 units
- demand is constant at the rate of 800 units/day
- when inventory falls below 1,500 units, an order is placed for an additional 4,000 units
- after 5 days, the inventory is completely used
- just as the 4000th unit is sold, the next order of 4000 units arrives and a new cycle begins
82
New cards
fixed order quantity model under uncertainty
83
New cards
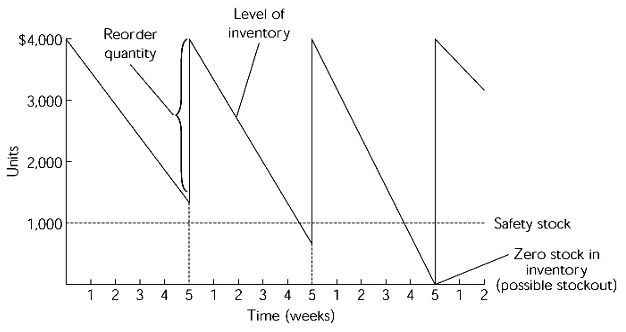
fixed order interval approach
- second basic approach
- involves ordering at fixed intervals and varying Q depending upon the remaining stock at the time the order is placed
- less monitoring than the basic model
- amount ordered over each five weeks in the example varies each week
- involves ordering at fixed intervals and varying Q depending upon the remaining stock at the time the order is placed
- less monitoring than the basic model
- amount ordered over each five weeks in the example varies each week
84
New cards
fixed order quantity model
85
New cards
fixed order interval approach model
86
New cards
just in time
- designed to manage lead times and eliminate waste
- JIT operations: kanban cards and light warning system communicate possible production interruptions
- JIT can substantially reduce inventory and related costs
- similar to the 2 bin system (one bin fills demand for part and other is used when the first is empty)
- reduces lead times through requiring small and frequent replenishment
87
New cards
kanban
- refers to the informative signboards on cart in a Toyota system of delivering parts to the production line
- each signboard details the exact quantities and necessary time of replenishment
- each signboard details the exact quantities and necessary time of replenishment
88
New cards
goal of JIT
zero inventory and zero defects
89
New cards
JIT
- widely used and effective strategy for managing the movement of parts, materials, semi-finished production from points of supply to production facilities
- product should arrive exactly when a firm needs it, with no tolerance for early or late deliveries
- place a high priority on short, consistent lead times
- product should arrive exactly when a firm needs it, with no tolerance for early or late deliveries
- place a high priority on short, consistent lead times
90
New cards
6 major differences for JIT
1. JIT attempts to eliminate excess inventories for both buyer and seller
2. JIT involves short production runs w frequent changeovers
3. JIT minimizes waiting lines by delivering goods when and where needed
4. JIT uses short, consistent lead times to satisfy inventory needs in a timely manner
5. JIT relies on high-quality incoming products and on exceptionally high-quality inbound logistics operations
6. JIT requires a strong, mutual commitment between buyer and seller, emphasizing quality and win-win outcomes for both partners
91
New cards
managing to learn
by John Shook
92
New cards
two of the most popular books about lean production
- Lean Thinking by Womack and Jones
- The Machine that Changed the World by Womack and Ross
- The Machine that Changed the World by Womack and Ross
93
New cards
lean can mean different things to different people
- downsizing
- thinking systematic
- entire enterprise business system
- thinking systematic
- entire enterprise business system
94
New cards
in the 1950s, Toyota could not take advantage of economies of scale due to 2 things
lower volume and high variety
95
New cards
Toyota was on the brink of bankruptcy because
banks refused to loan them money
96
New cards
Toyota's workers were on strike because
they weren't getting paid
97
New cards
job security refers to
life time employment
98
New cards
lean production was developed in ______ years by ______________
20-30 by trial and error
99
New cards
NUUMI
New United Motor Manufacturing Inc- automobile manufacturing plant in Fremont, CA jointly owned by General Motors and Toyota that opened in 1984 and closed in 2010
100
New cards
in the Toyota Production System, the job of a manager is to
develop their people