Inventory Valuing Method, Break-even
1/17
There's no tags or description
Looks like no tags are added yet.
Name | Mastery | Learn | Test | Matching | Spaced |
|---|
No study sessions yet.
18 Terms
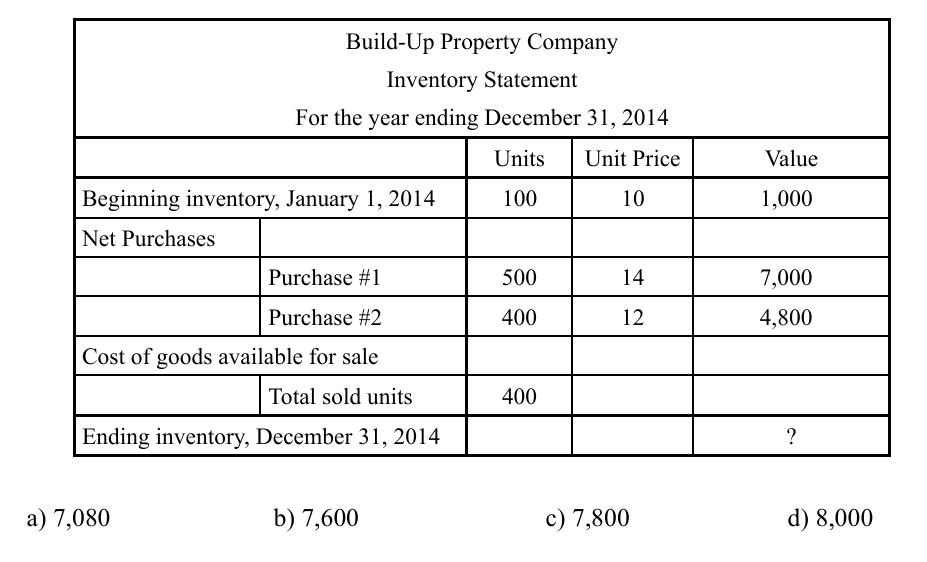
Q78. The following inventory statement of Build-Up Property Company describes the status of the company’s inventory since the beginning of the year 2014. When the company uses a first-in-first-out (FIFO) method for inventory asset valuation, what is the inventory value at the end of the year 2014?
b) 7,600
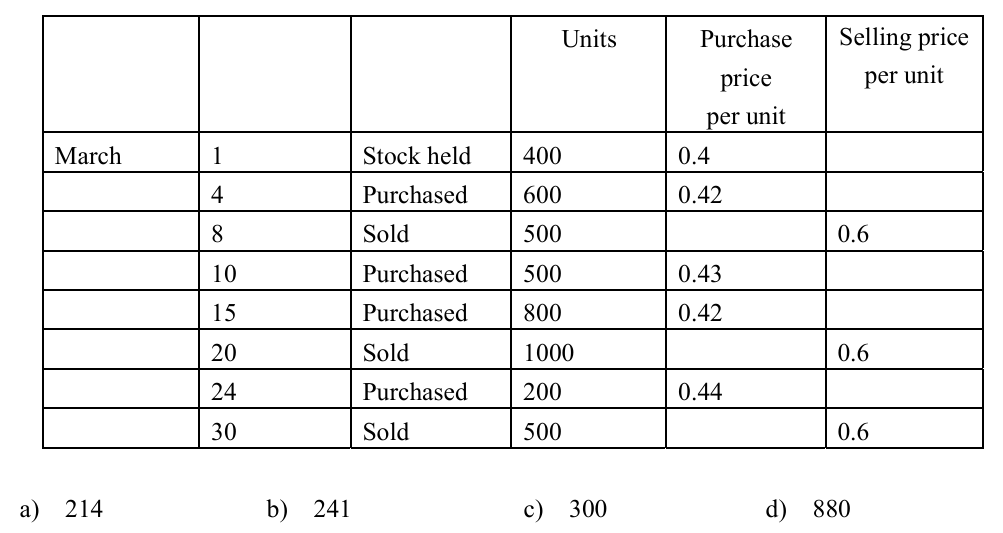
Q78. When the FIFO method is applied to the purchase and selling record shown below, what is the inventory value at the end of March?
a) 214
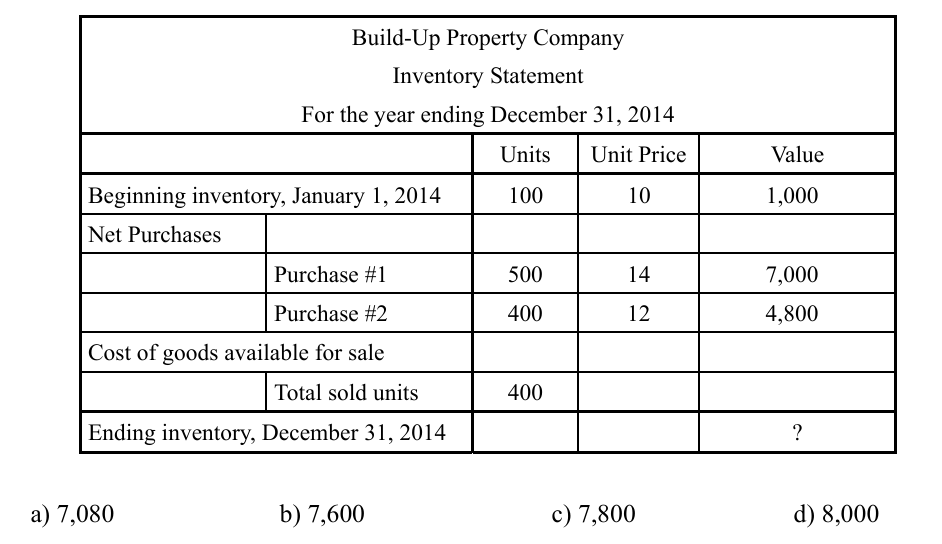
Q78. The following inventory statement of Build-Up Property Company describes the status of the inventory since the beginning of the year 2014. If this company uses a first-in-first-out (FIFO) method for the inventory asset valuation, what is the inventory value at the end of the year 2014?
b) 7,600
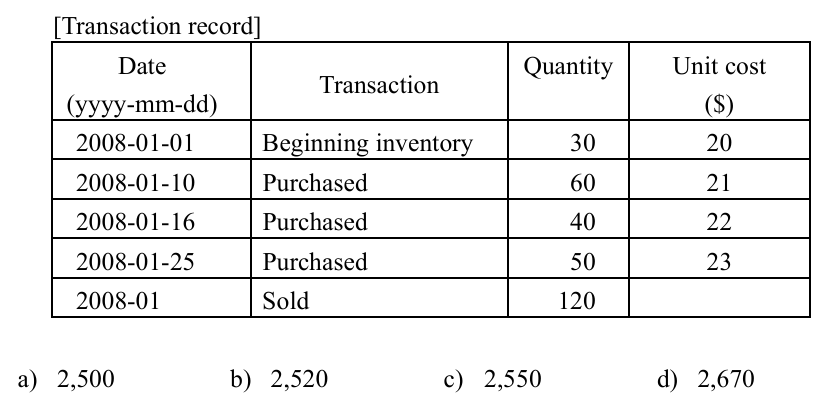
Q75. A certain retailer purchases watches from a wholesaler and sells them to customers. As shown in the transaction record table below, the retailer purchased a total of 150 watches and sold 120 watches in January. In addition, the retailer had a stock of 30 watches at the beginning of January. What is the total purchase cost (in dollars) of watches that were sold on an FIFO (First In First Out) basis in January?
b) 2,520
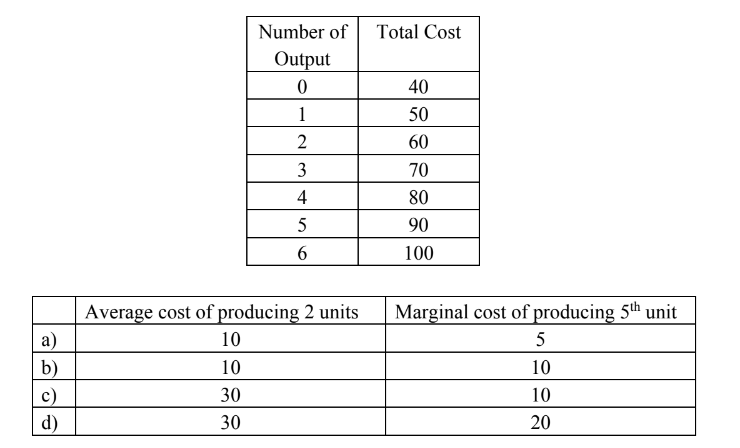
Q79. A cost schedule showing total costs of the production is given below. Which of the following is an appropriate combination of the average cost of producing 2 units, and the marginal cost of producing the 5th unit?

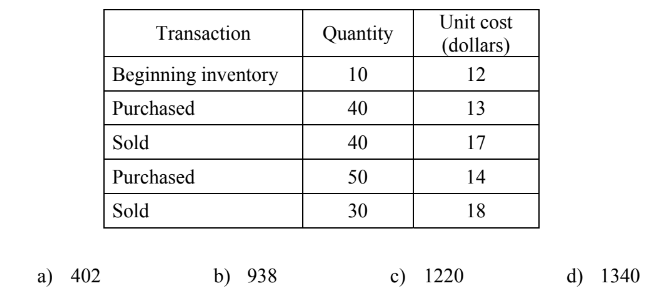
Q79. The table below shows the transaction records for a certain fiscal period. When the average cost is calculated based on the periodic average method, how much is the “cost of sales” in dollars at the end of the period?
b) 938
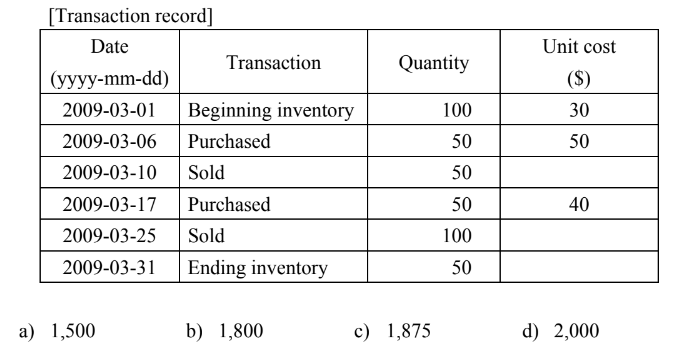
Q73. When the average cost method is used for the inventory control in the transaction record table shown below, what is the inventory value (in dollars) at the end of March?
c) 1,875
Q80. There are goods whose unit purchase prices are gradually rising. There was an inventory of these goods at the end of the last accounting period, and the goods were carried into and out of the warehouse several times during the current period. Which of the following valuation methods produces the lowest valuation of the inventory at the end of the current period?
a) Average cost method
b) First-in first-out method
c) Last-in first-out method
d) Moving average method
c) Last-in first-out method
Q79. A company plans to provide a product with a fixed cost of $128,000, a variable cost per unit of $48, and a selling price per unit of $80. Which of the following is the point of sales (in dollars) to become break-even?
a) 240,000
b) 320,000
c) 480,000
d) 560,000
b) 320,000
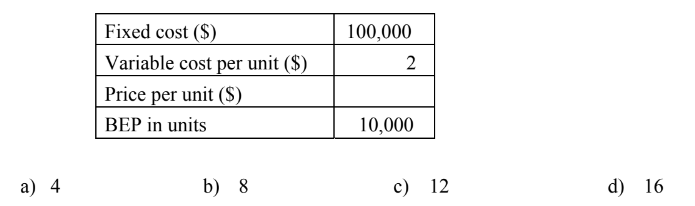
Q79. The break-even point (BEP) is a level where total cost and total revenue are equal. The table below lists the fixed cost, variable cost per unit, price per unit, and BEP in units. Which of the following is a value of the price per unit?
c) 12
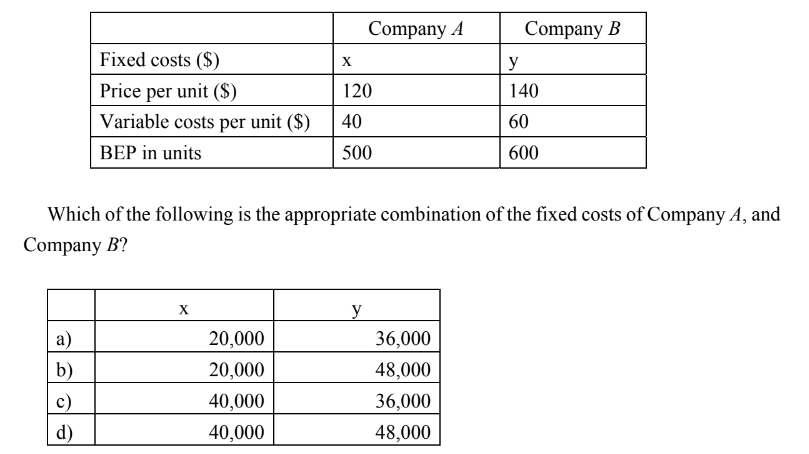
Q78. Break-even point (BEP) is a point where total costs and total revenue are equal. The table below shows the fixed costs, price per unit, variable costs per unit, and BEP in units for Company A and Company B.

Q79. A company has planned to provide a product with a fixed cost of $128,000, a variable cost per unit of $48, and a selling price per unit of $80. Which of the following is the point of sales ($) to become break-even?
a) 240,000
b) 320,000
c) 480,000
d) 560,000
b) 320,000
Q76. Peter plans to open his own coffee shop. He uses break-even analysis to evaluate the feasibility. He needs to rent a coffee making machine at 20 dollars per day. The average cost of coffee ingredients is 0.40 dollars per cup and the cost of a plastic cup is 0.10 dollars. He sets a price at 1.50 dollars per cup. What is the sales revenue a day at the break-even point?
a) 10
b) 25
c) 30
d) 75
c) 30
Q78. Break-even point of the new product is 12,000 units a month. Fixed cost is 800,000 dollars a month and variable cost is 20 dollars per unit. Based on the information above, which of the following is a selling price of the new product?
a) 46.67
b) 66.67
c) 86.67
d) 89.23
c) 86.67
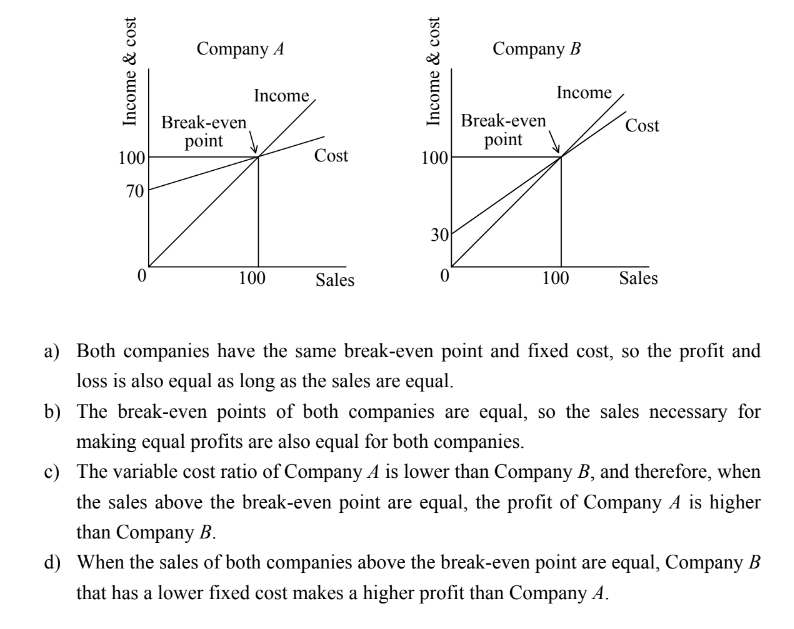
Q80. The figure below shows each break-even point of Company A and Company B. Which of the following is an appropriate description concerning the benefit-risk analysis of the two companies?
c) The variable cost ratio of Company A is lower than Company B, and therefore, when the sales above the break-even point are equal, the profit of Company A is higher than Company B.
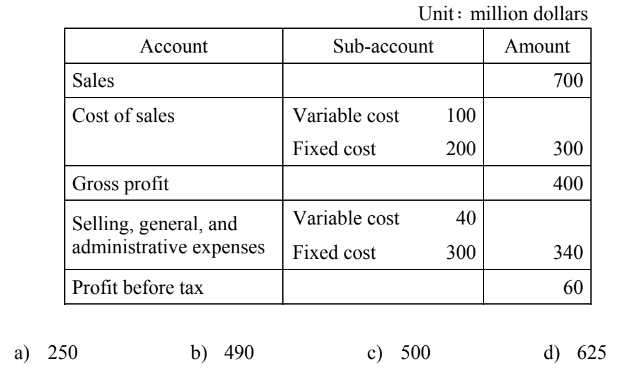
Q78. The table below shows the income statement for a certain company. Which of the following is the amount of sales (in million dollars) at the break-even point?
d) 625
Q80. Which of the following explains the characteristic of the break-even point?
a) The sales at the break-even point are equal to the sum of the fixed cost and variable cost.
b) When the fixed cost remains unchanged, the break-even point rises if the ratio of the variable cost lowers.
c) When the fixed cost remains unchanged, the change in the ratio of the variable cost is directly proportional to the change in the break-even point.
d) When the ratio of the variable cost remains unchanged, the break-even point rises if the fixed cost is reduced.
a) The sales at the break-even point are equal to the sum of the fixed cost and variable cost.
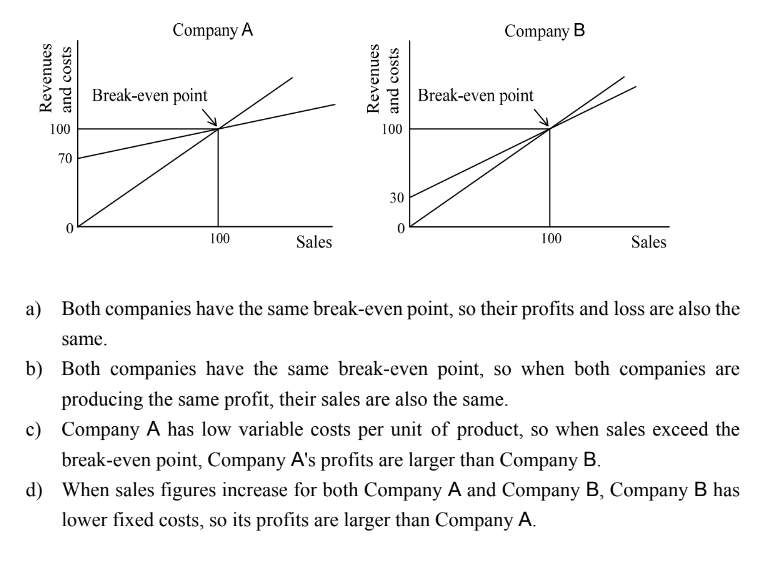
Q75. The figures show the break-even point for two companies A and B. Which of the following is an appropriate statement with regard to the profit/loss analysis of Companies A and B?
c) Company A has low variable costs per unit of product, so when sales exceed the break-even point, Company A's profits are larger than Company B.