AP Statistics Unit 7
1/19
Earn XP
Description and Tags
Just some useful notes for the AP Stats. Fomula Sheet: https://apcentral.collegeboard.org/media/pdf/statistics-formula-sheet-and-tables-2020.pdf.
Name | Mastery | Learn | Test | Matching | Spaced | Call with Kai | Chat |
|---|
No analytics yet
Send a link to your students to track their progress
20 Terms
(7.1) How do we determine if evidence for a claim is convincing?
Consider the two explanation
Estimate the probability of getting evidence as strong or stronger than the observed evidence by chance alone
If you can eliminate random chance as a plausible explanation for the evidence, the evidence is convincing.
(7.2) How do we verify the conditions for calculating a confidence interval for a population mean?
The data are collected using a random sample from the population or a randomised experiment.
When sampling without replacement, the sample size is less than or equal to 10% of the population size.
The sample size is large (n ≥ 30) OR if n < 30, the sample data are free from strong skewness and outliers. (Regarding outliers, you must create a graph showing this, if a graph is not provided)
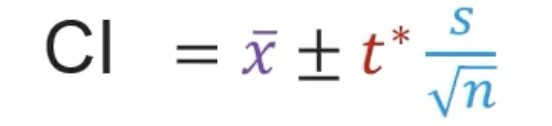
(7.2) Formula for a confidence interval for a mean?
x bar is the sample mean
n is the sample size
s is the sample standard deviation
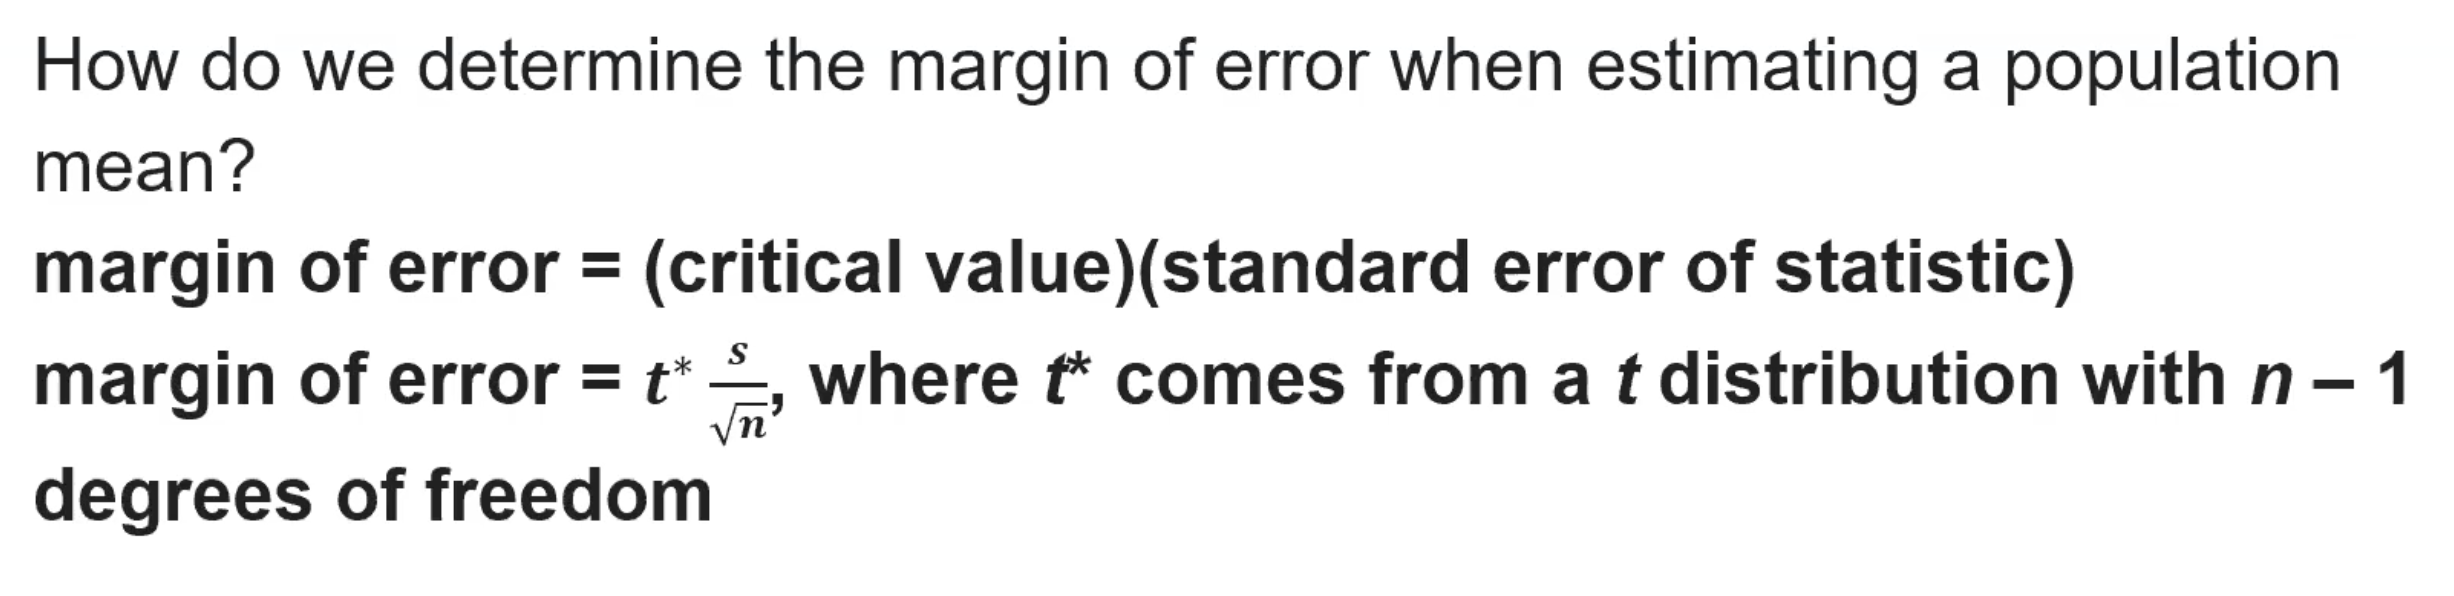
(7.2) Margin of error formula?
Note that you should use the highest degrees of freedom that is still less than the desired degrees of freedom if that is not possible. If this happens make sure to note that it comes from table B.
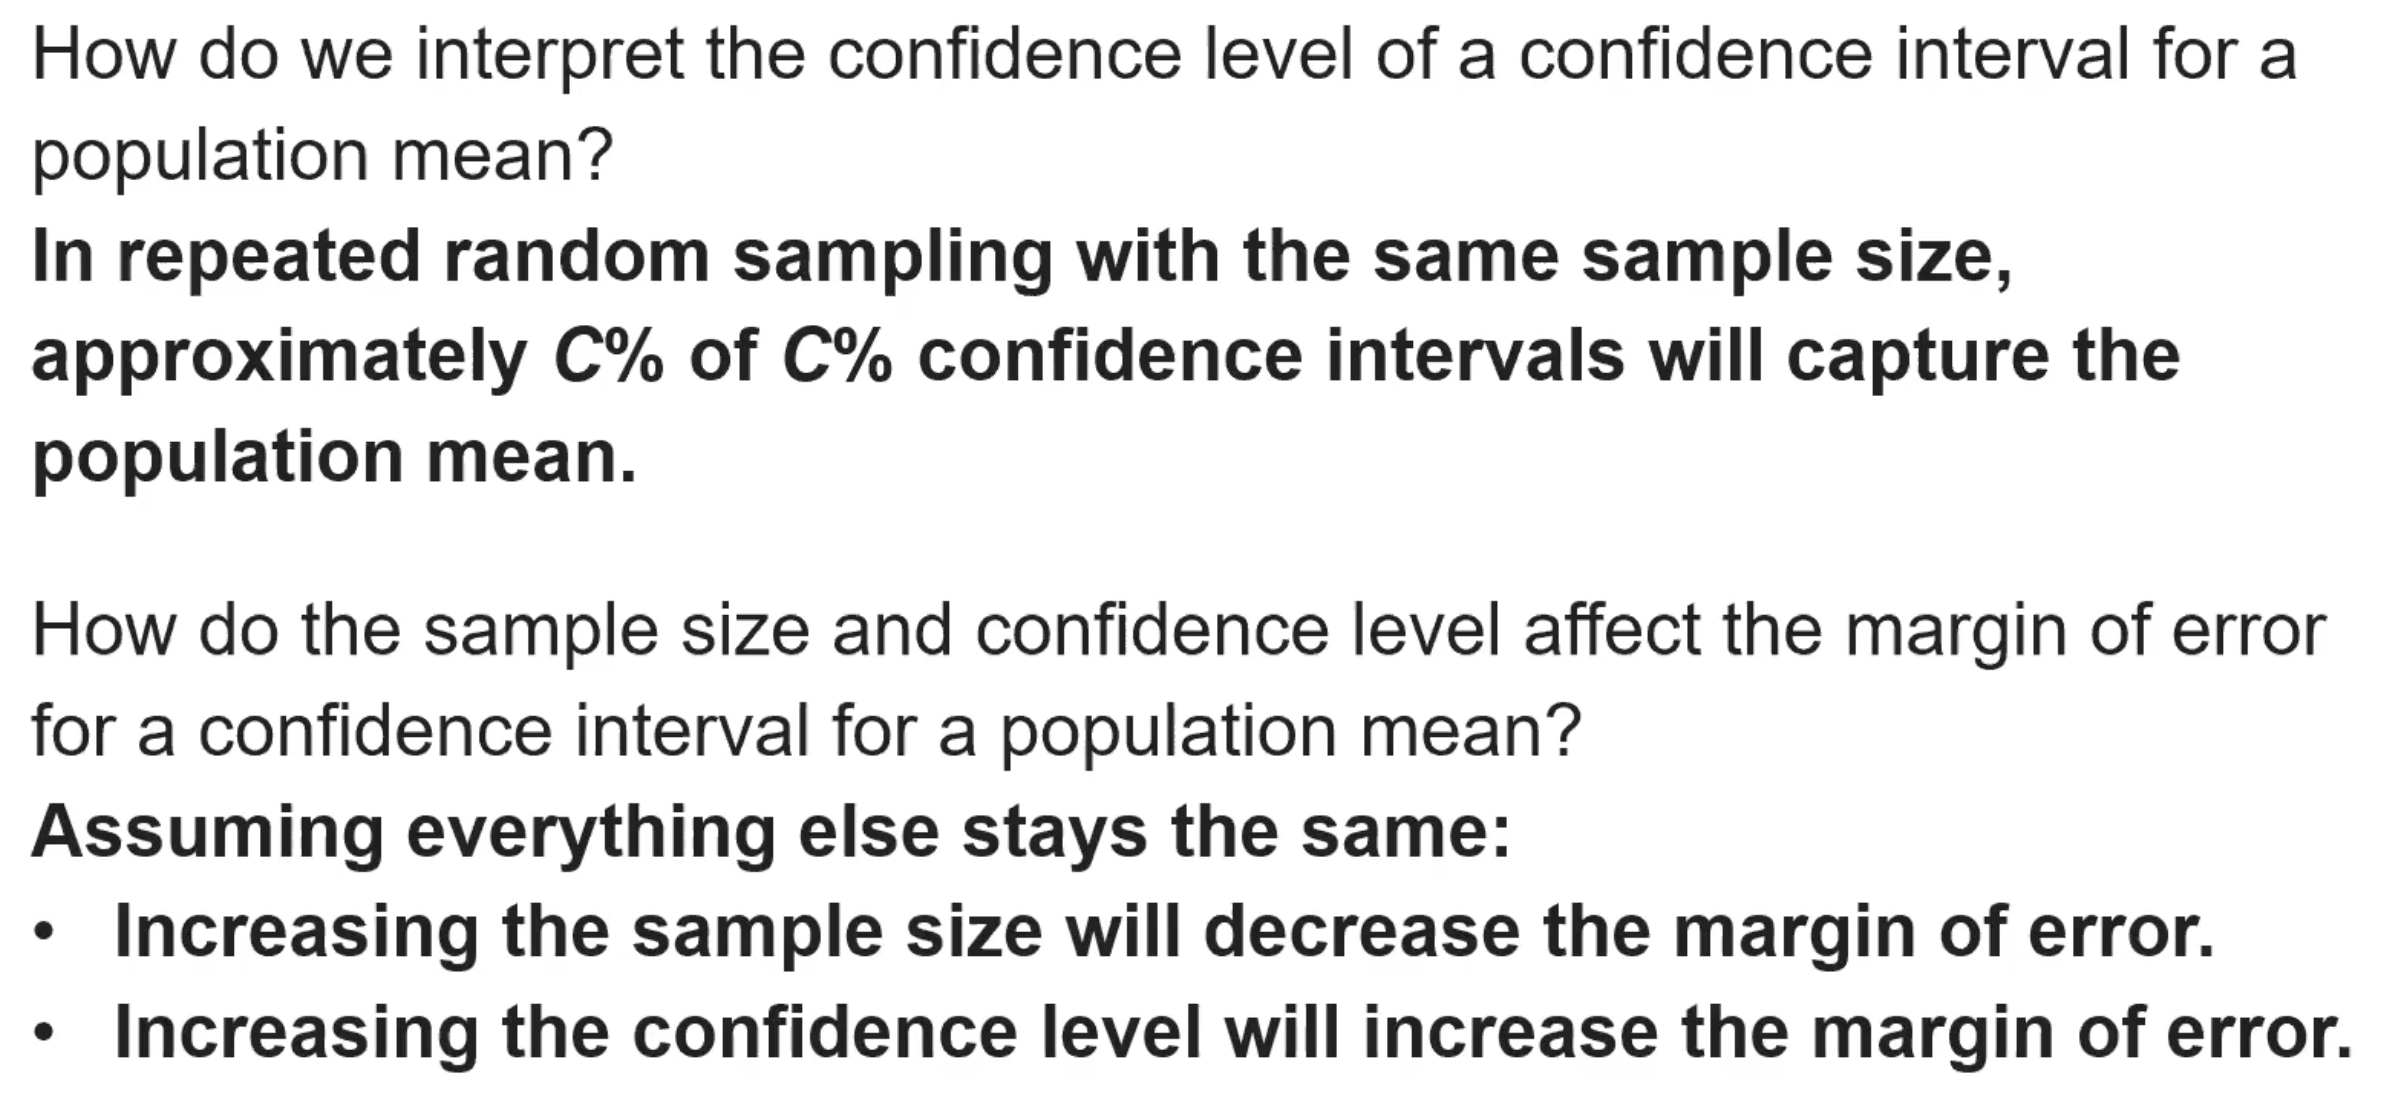
(7.3) How do we interpret and justify a claim for a confidence interval for a population mean?
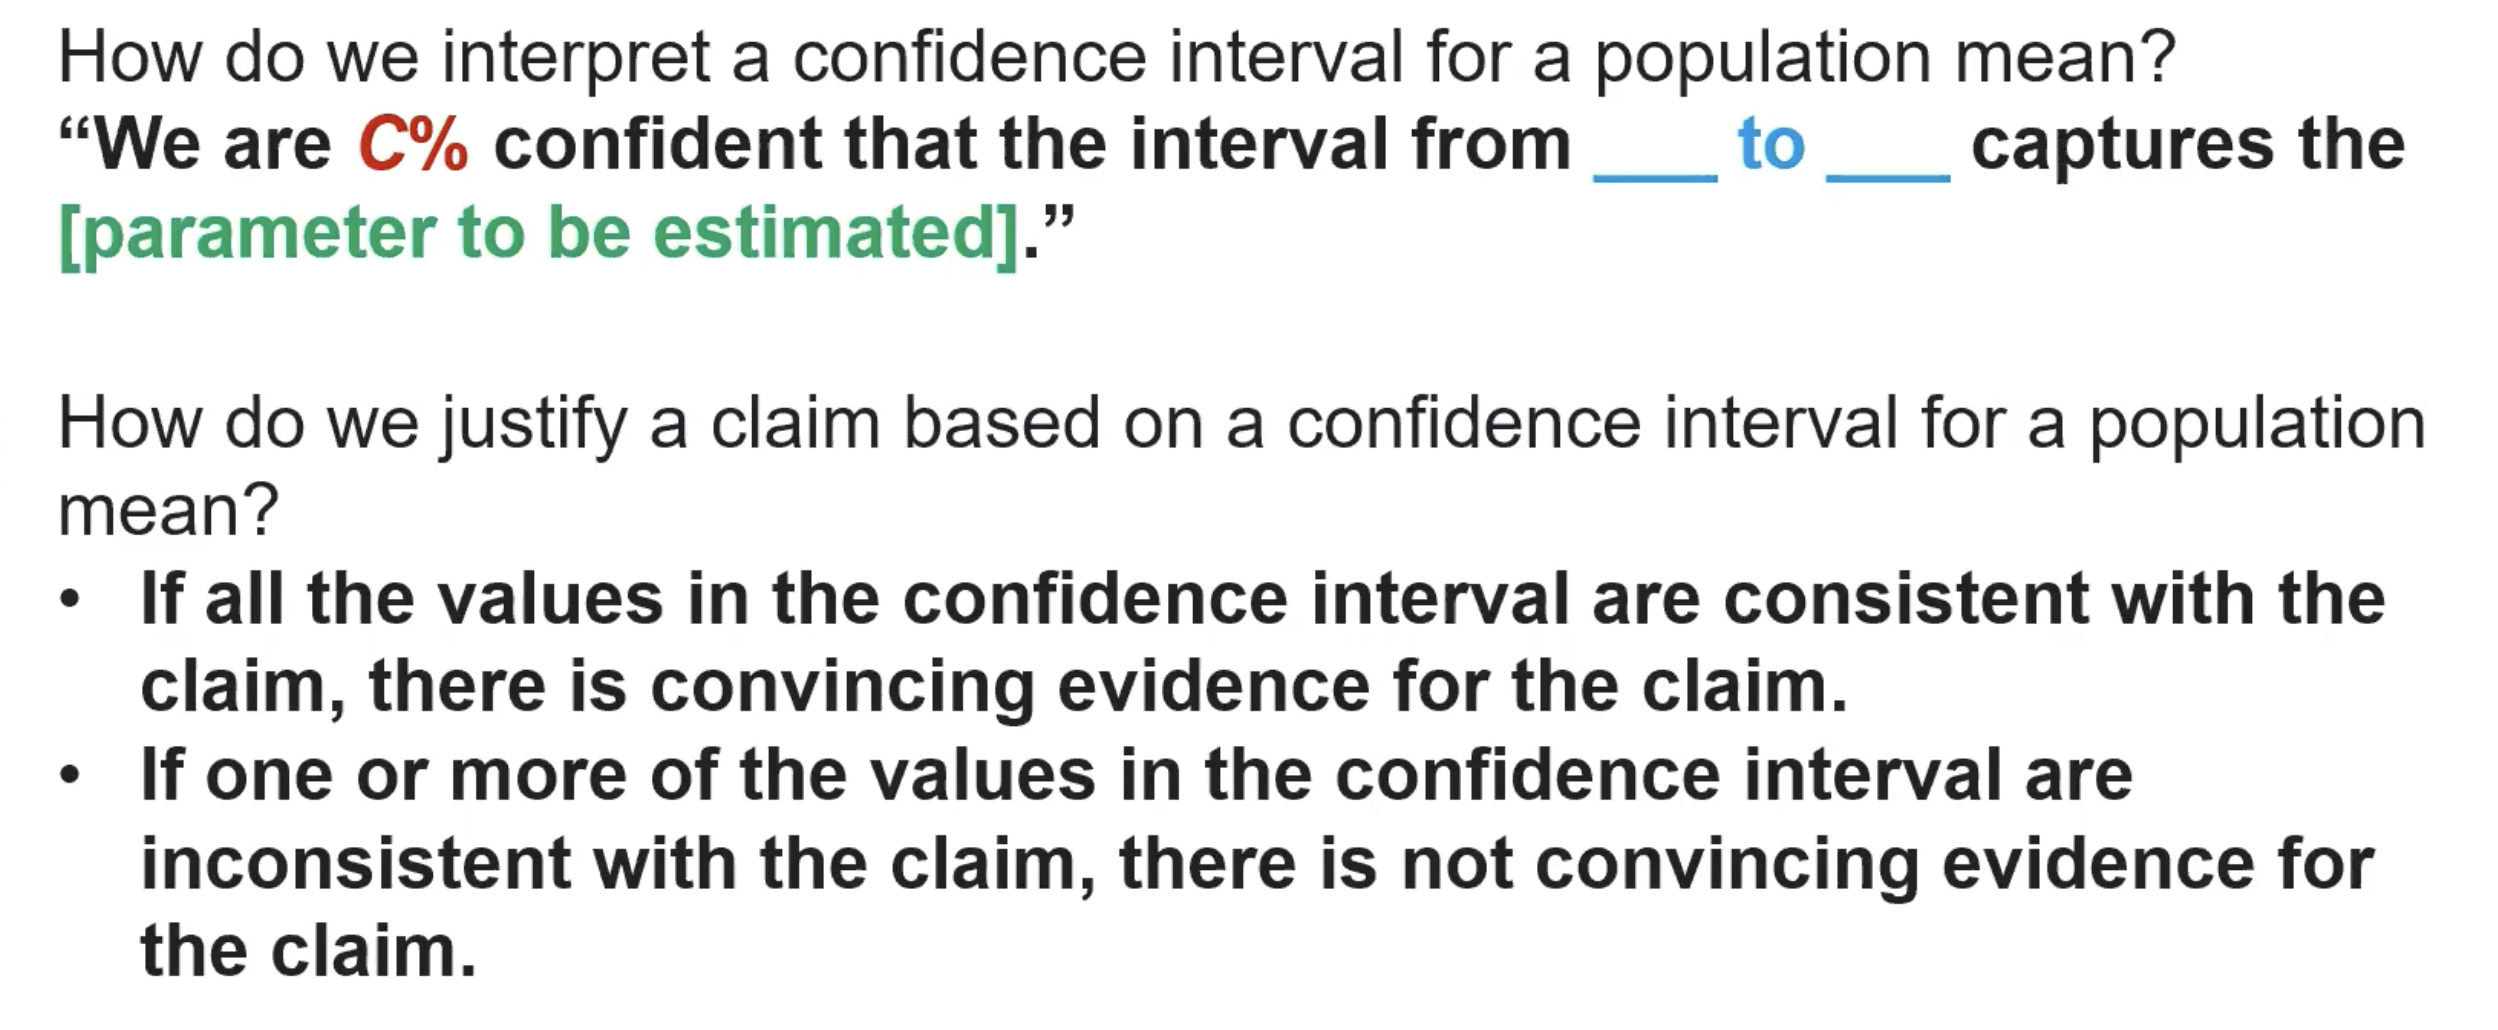
(7.3) Confidence intervals and levels
Note: Make sure to do everything in context and also, you only need to interpret the confidence level unless specifically asked
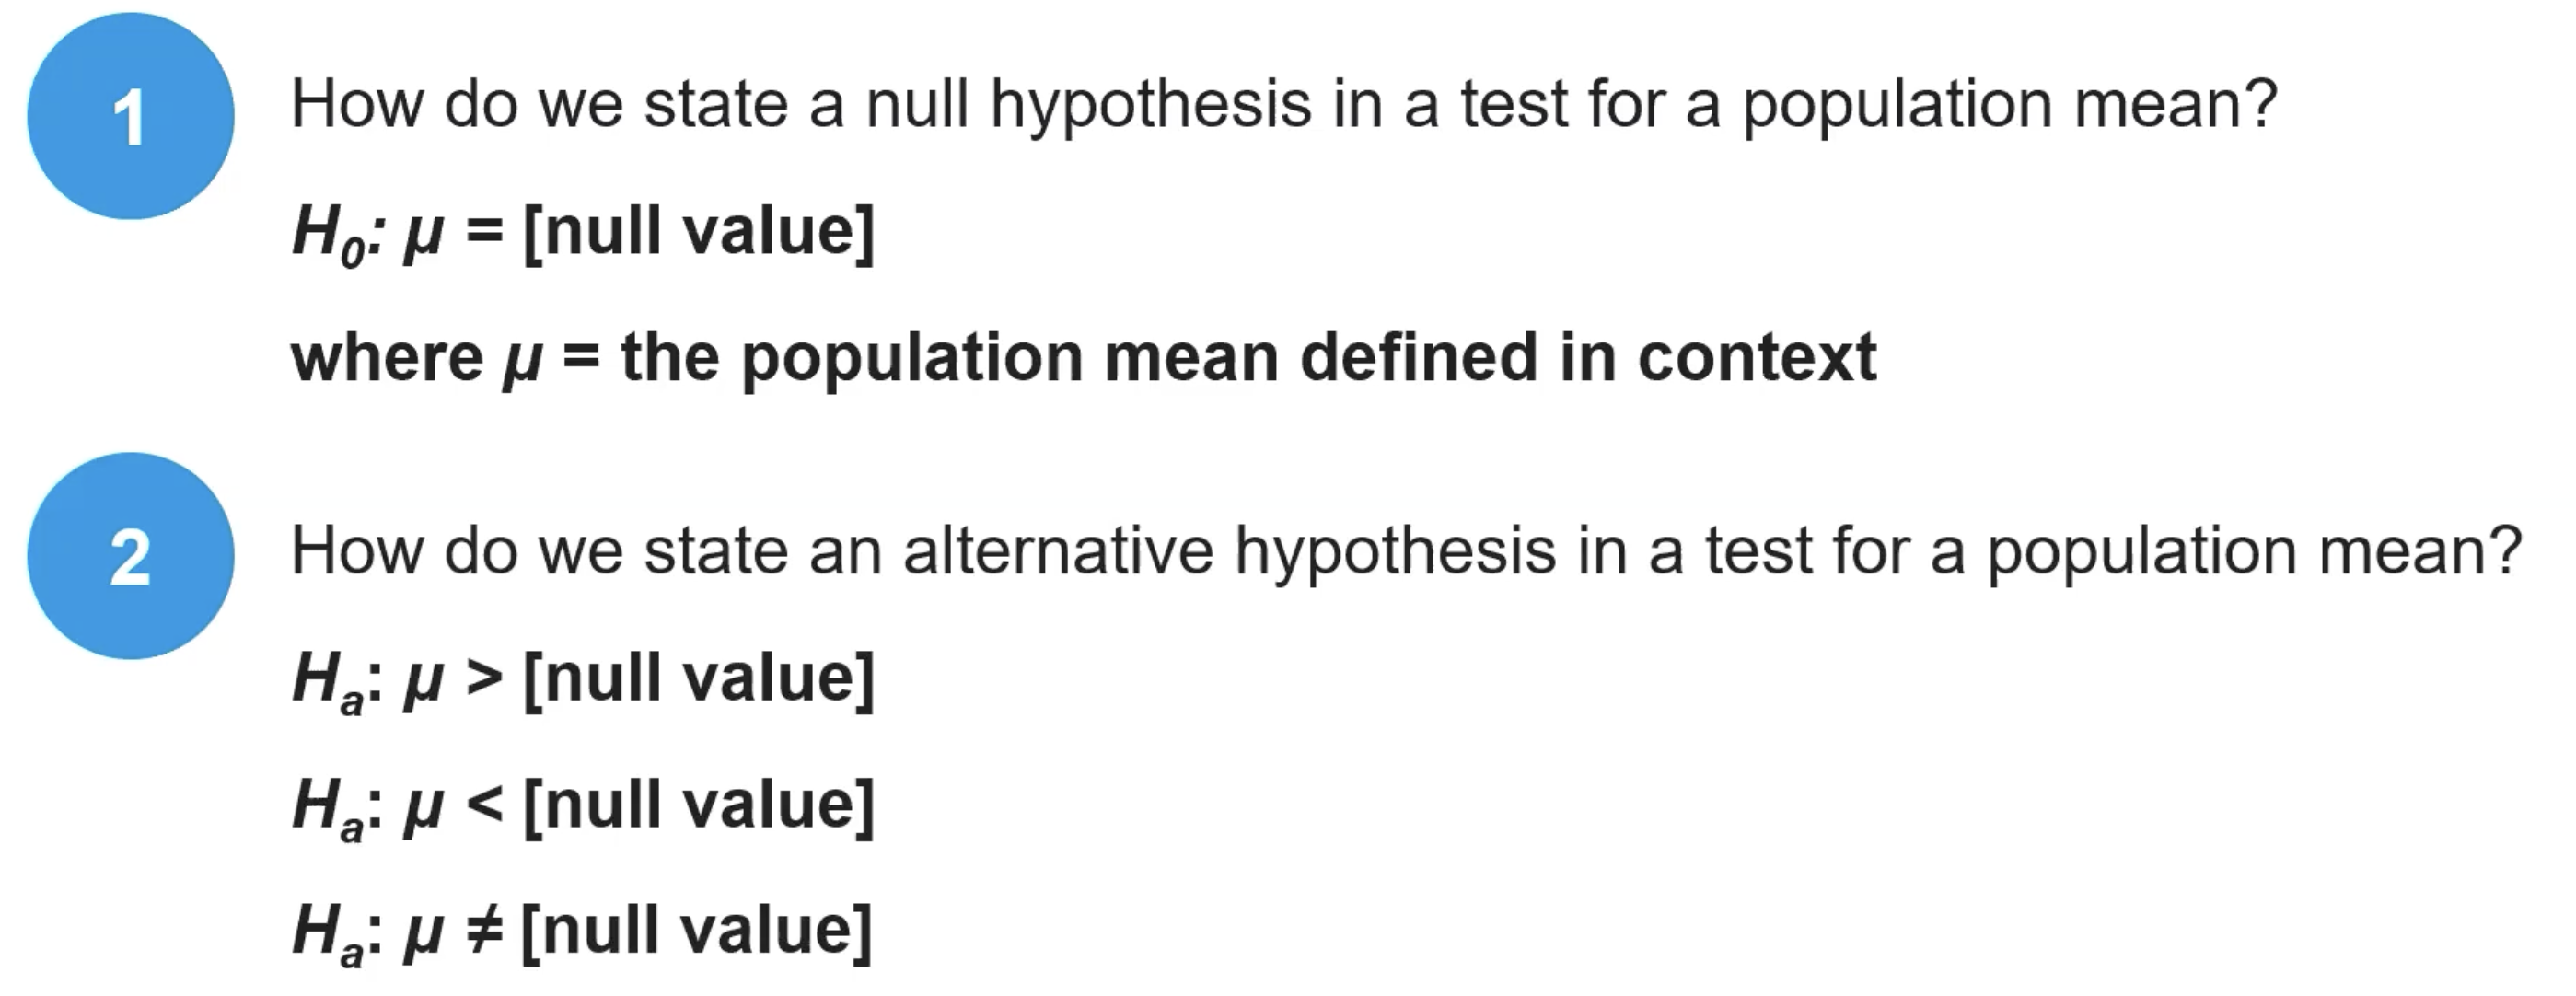
(7.4) How do we state a null or alternative hypothesis in a test for a population mean?
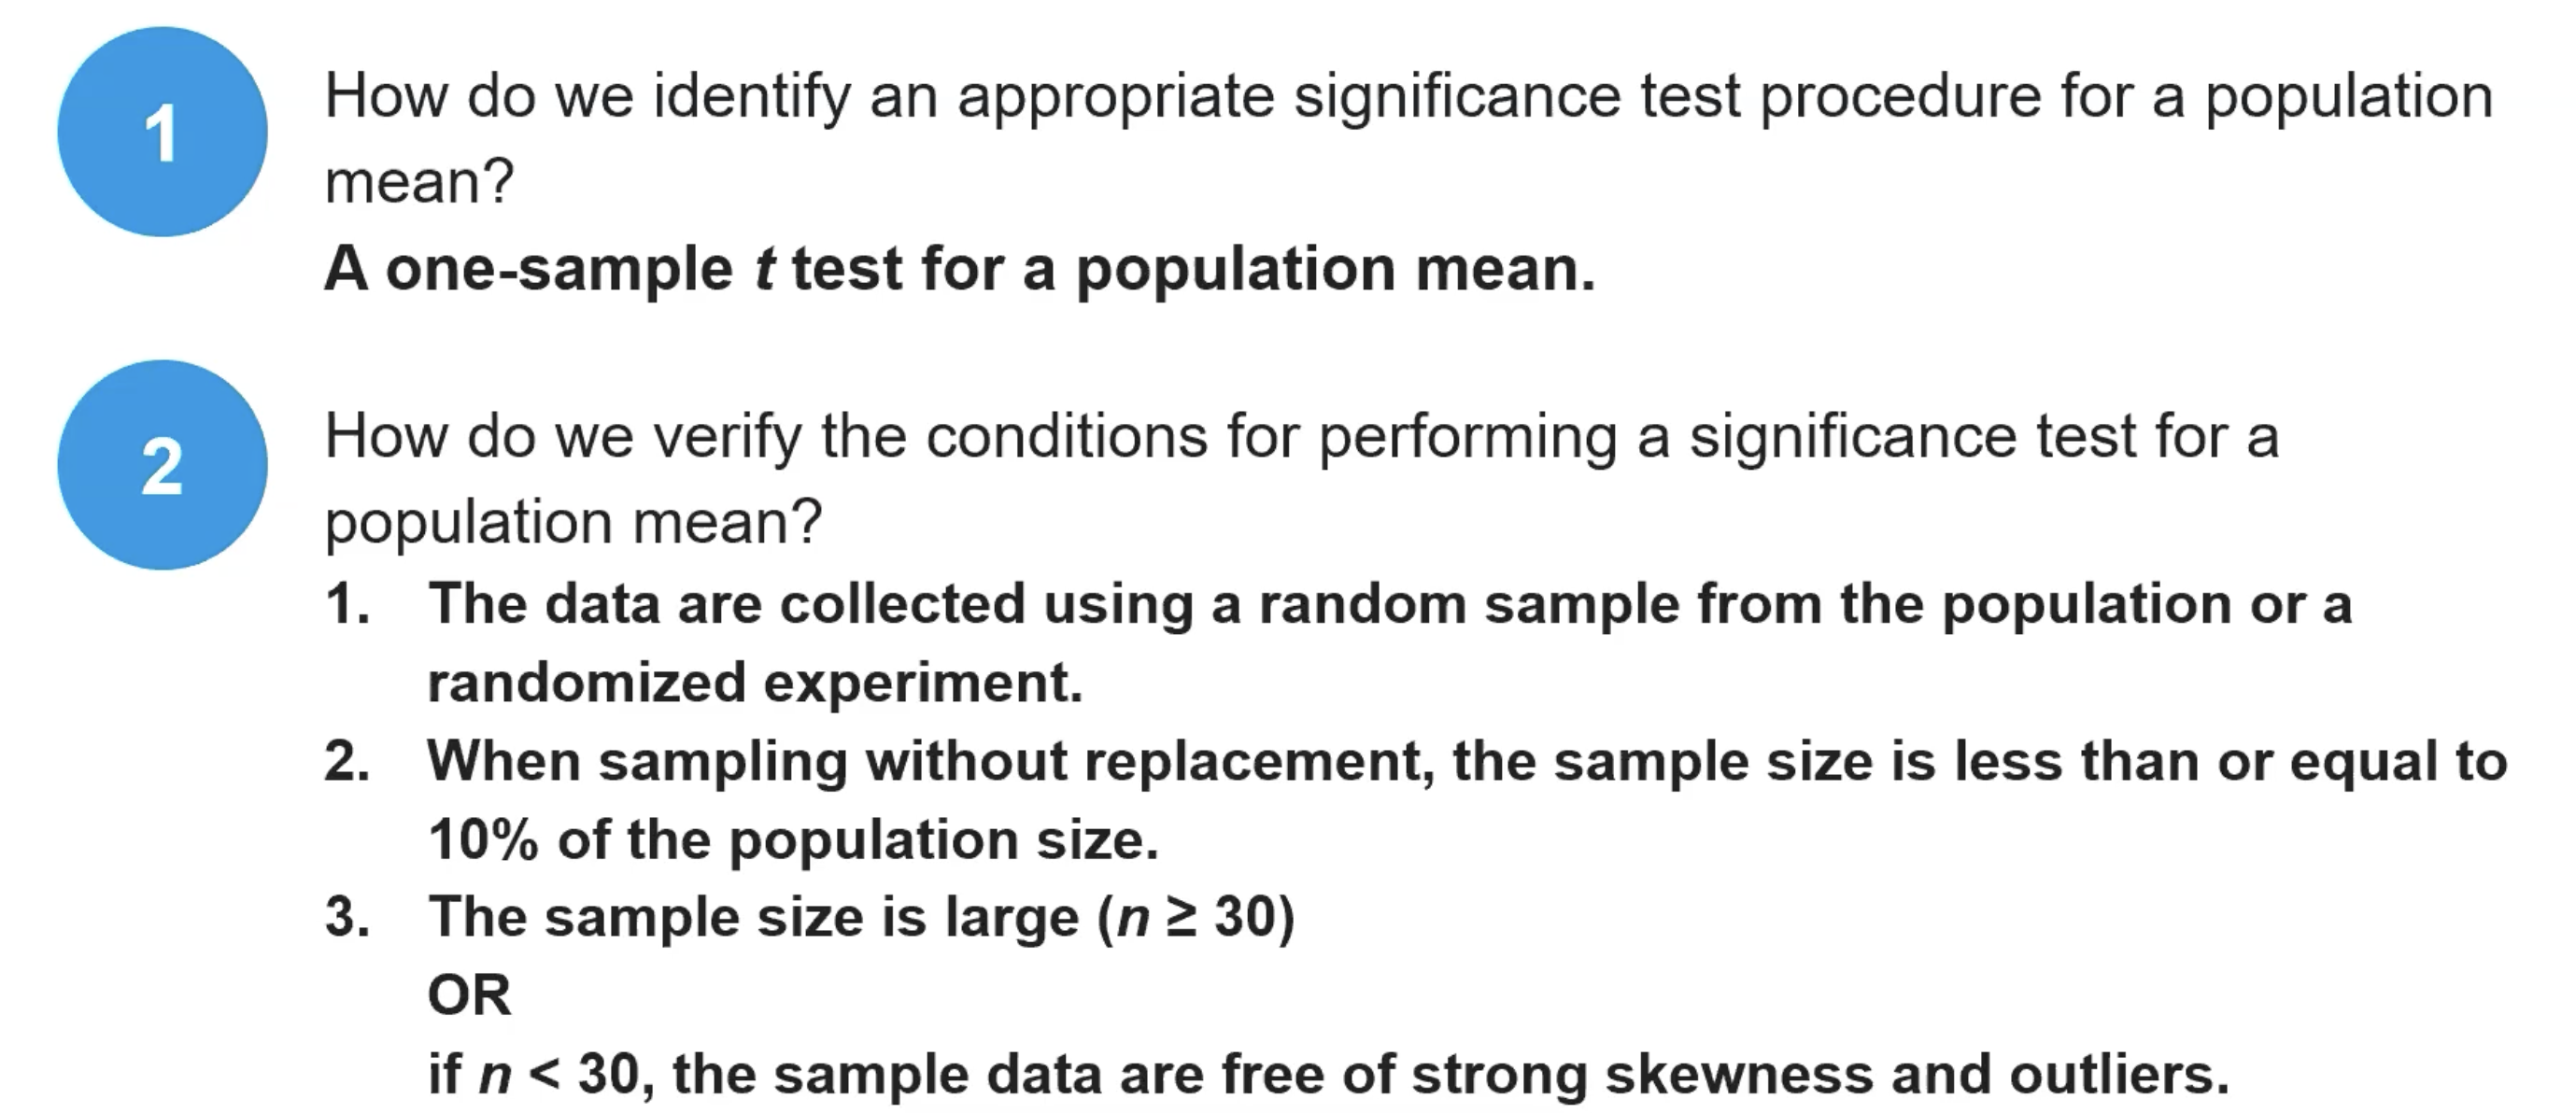
(7.4) How do we verify the conditions for performing a significance test for a population mean?
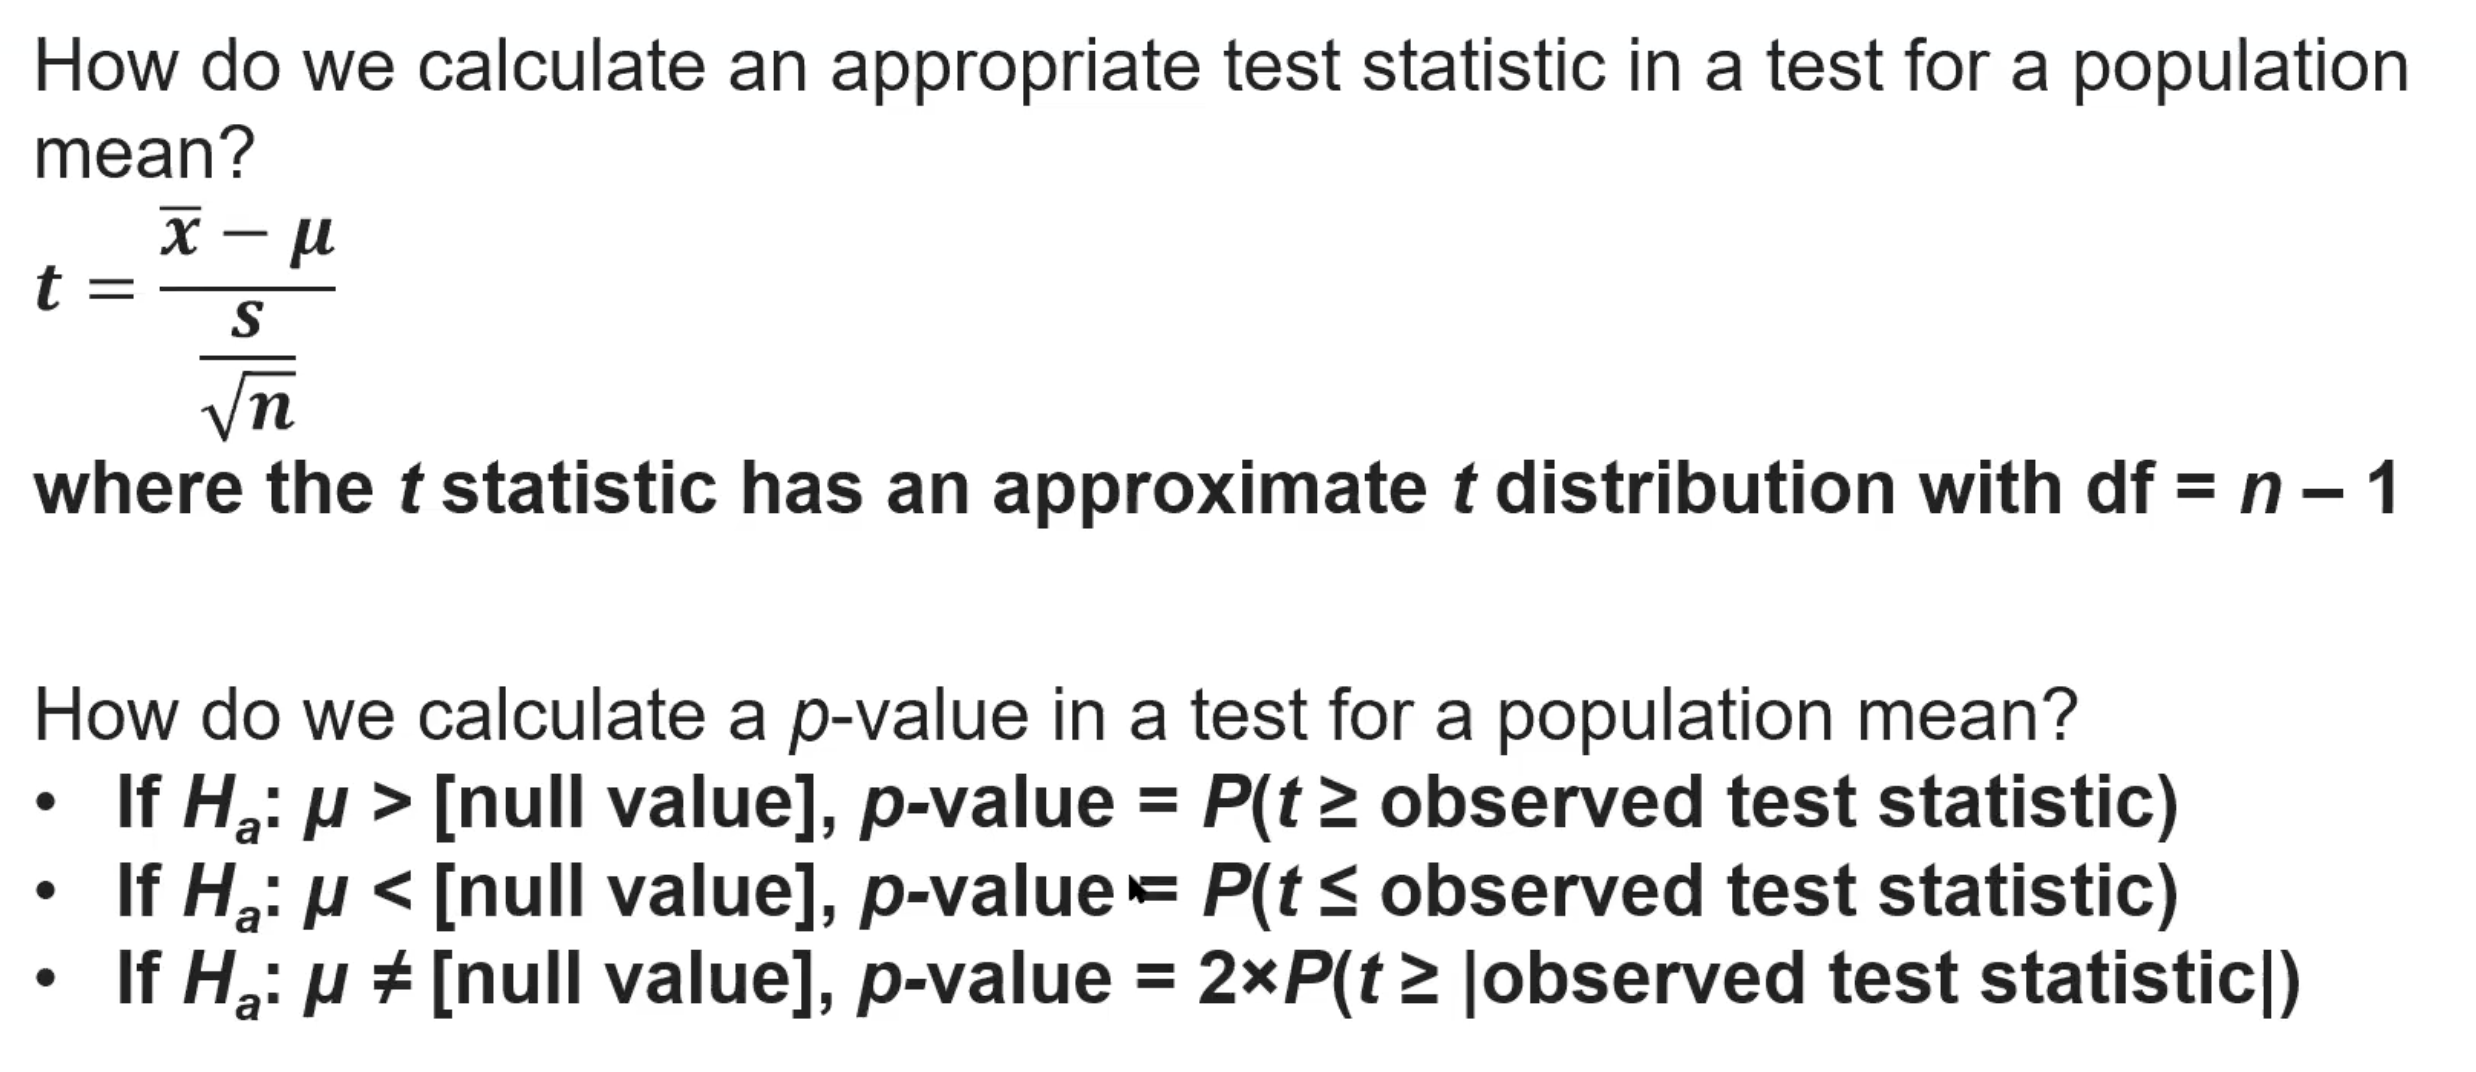
(7.5) How do we calculate an appropriate test statistic and p-value in a test for a population mean?
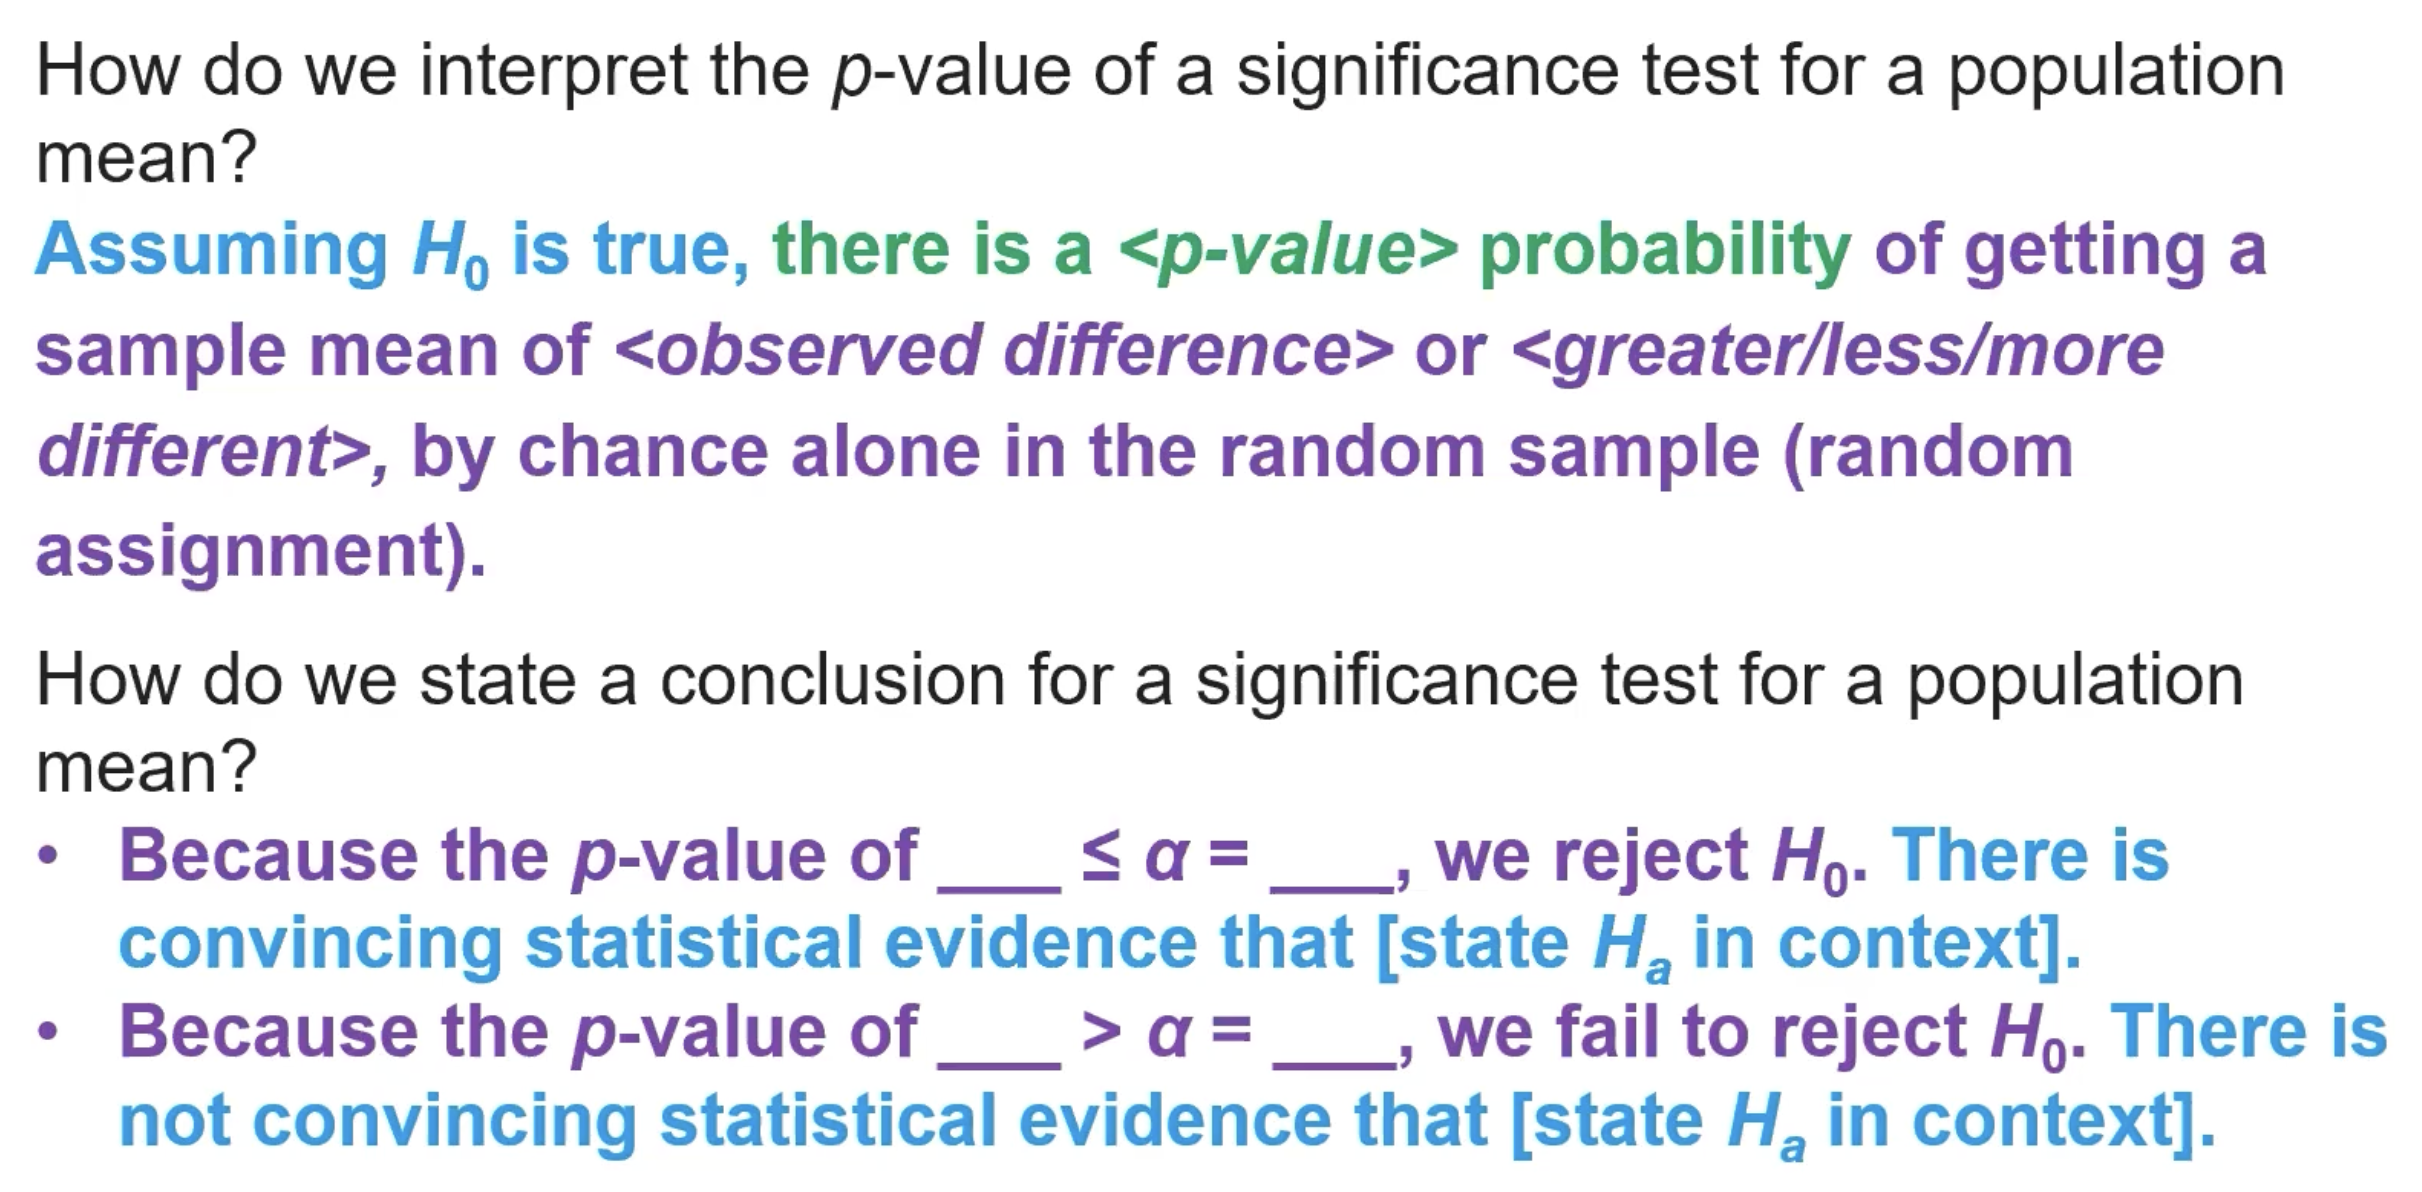
(7.5) How do we interpret the p-value and state a conclusion of a significance test for a population mean?
(7.6) How do we verify the conditions for calculating a confidence interval for the difference of two population means?
The data comes from two random samples or a randomized experiment.
When sampling without replacement, the sample sizes must be less than or equal to 10% of their respective populations.
Both n1 and n2 should be greater than 30 OR both samples should come from approximately normally distributed populations.
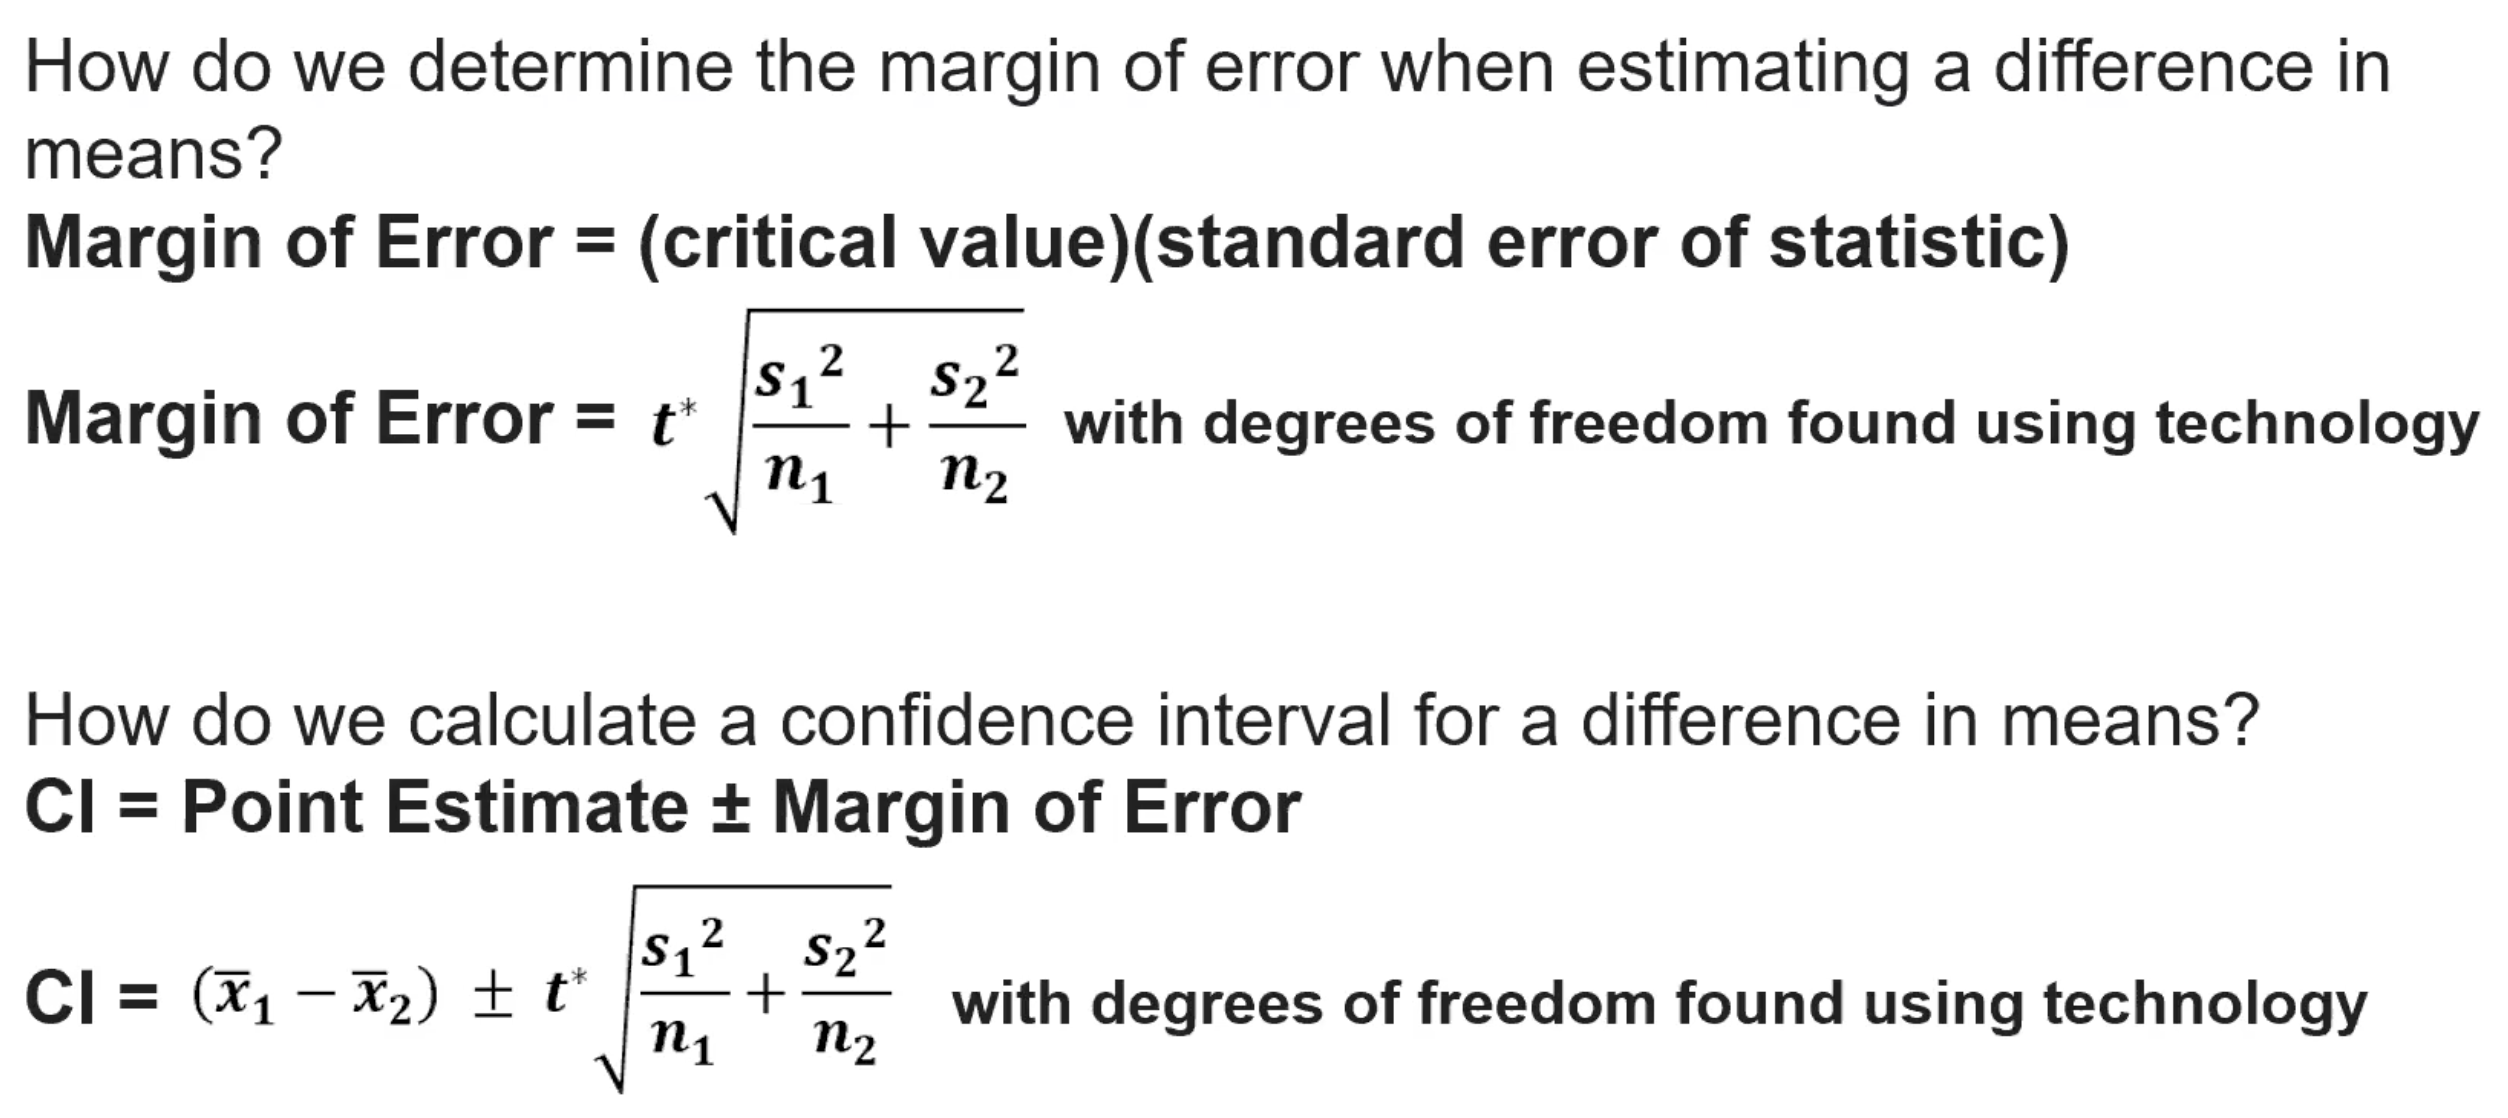
(7.6) How do we determine the margin of error and confidence interval for q difference in means?
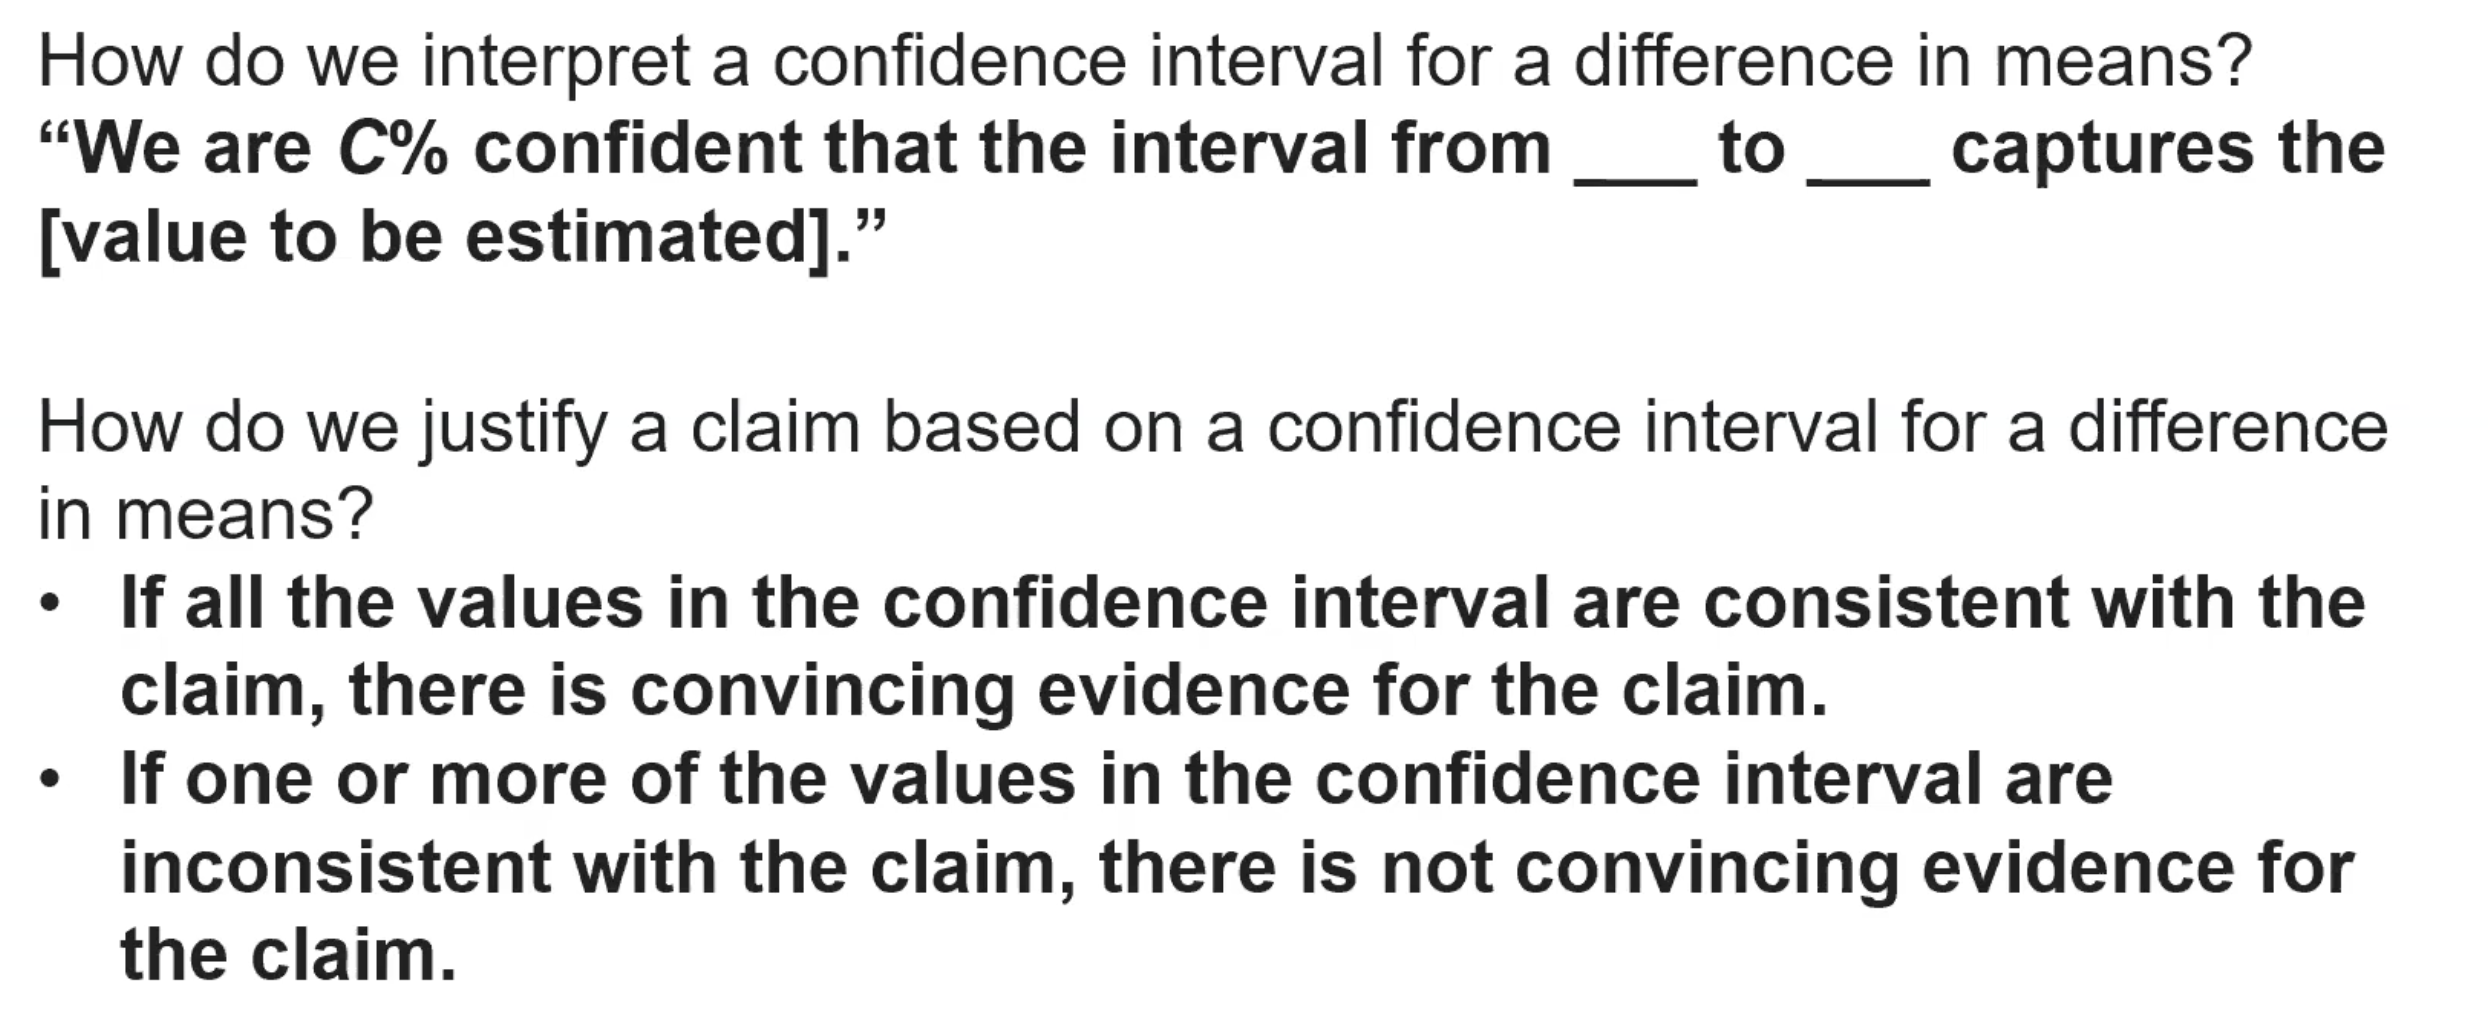
(7.7) How do we interpret and justify a claim based on a confidence interval for a difference in means?
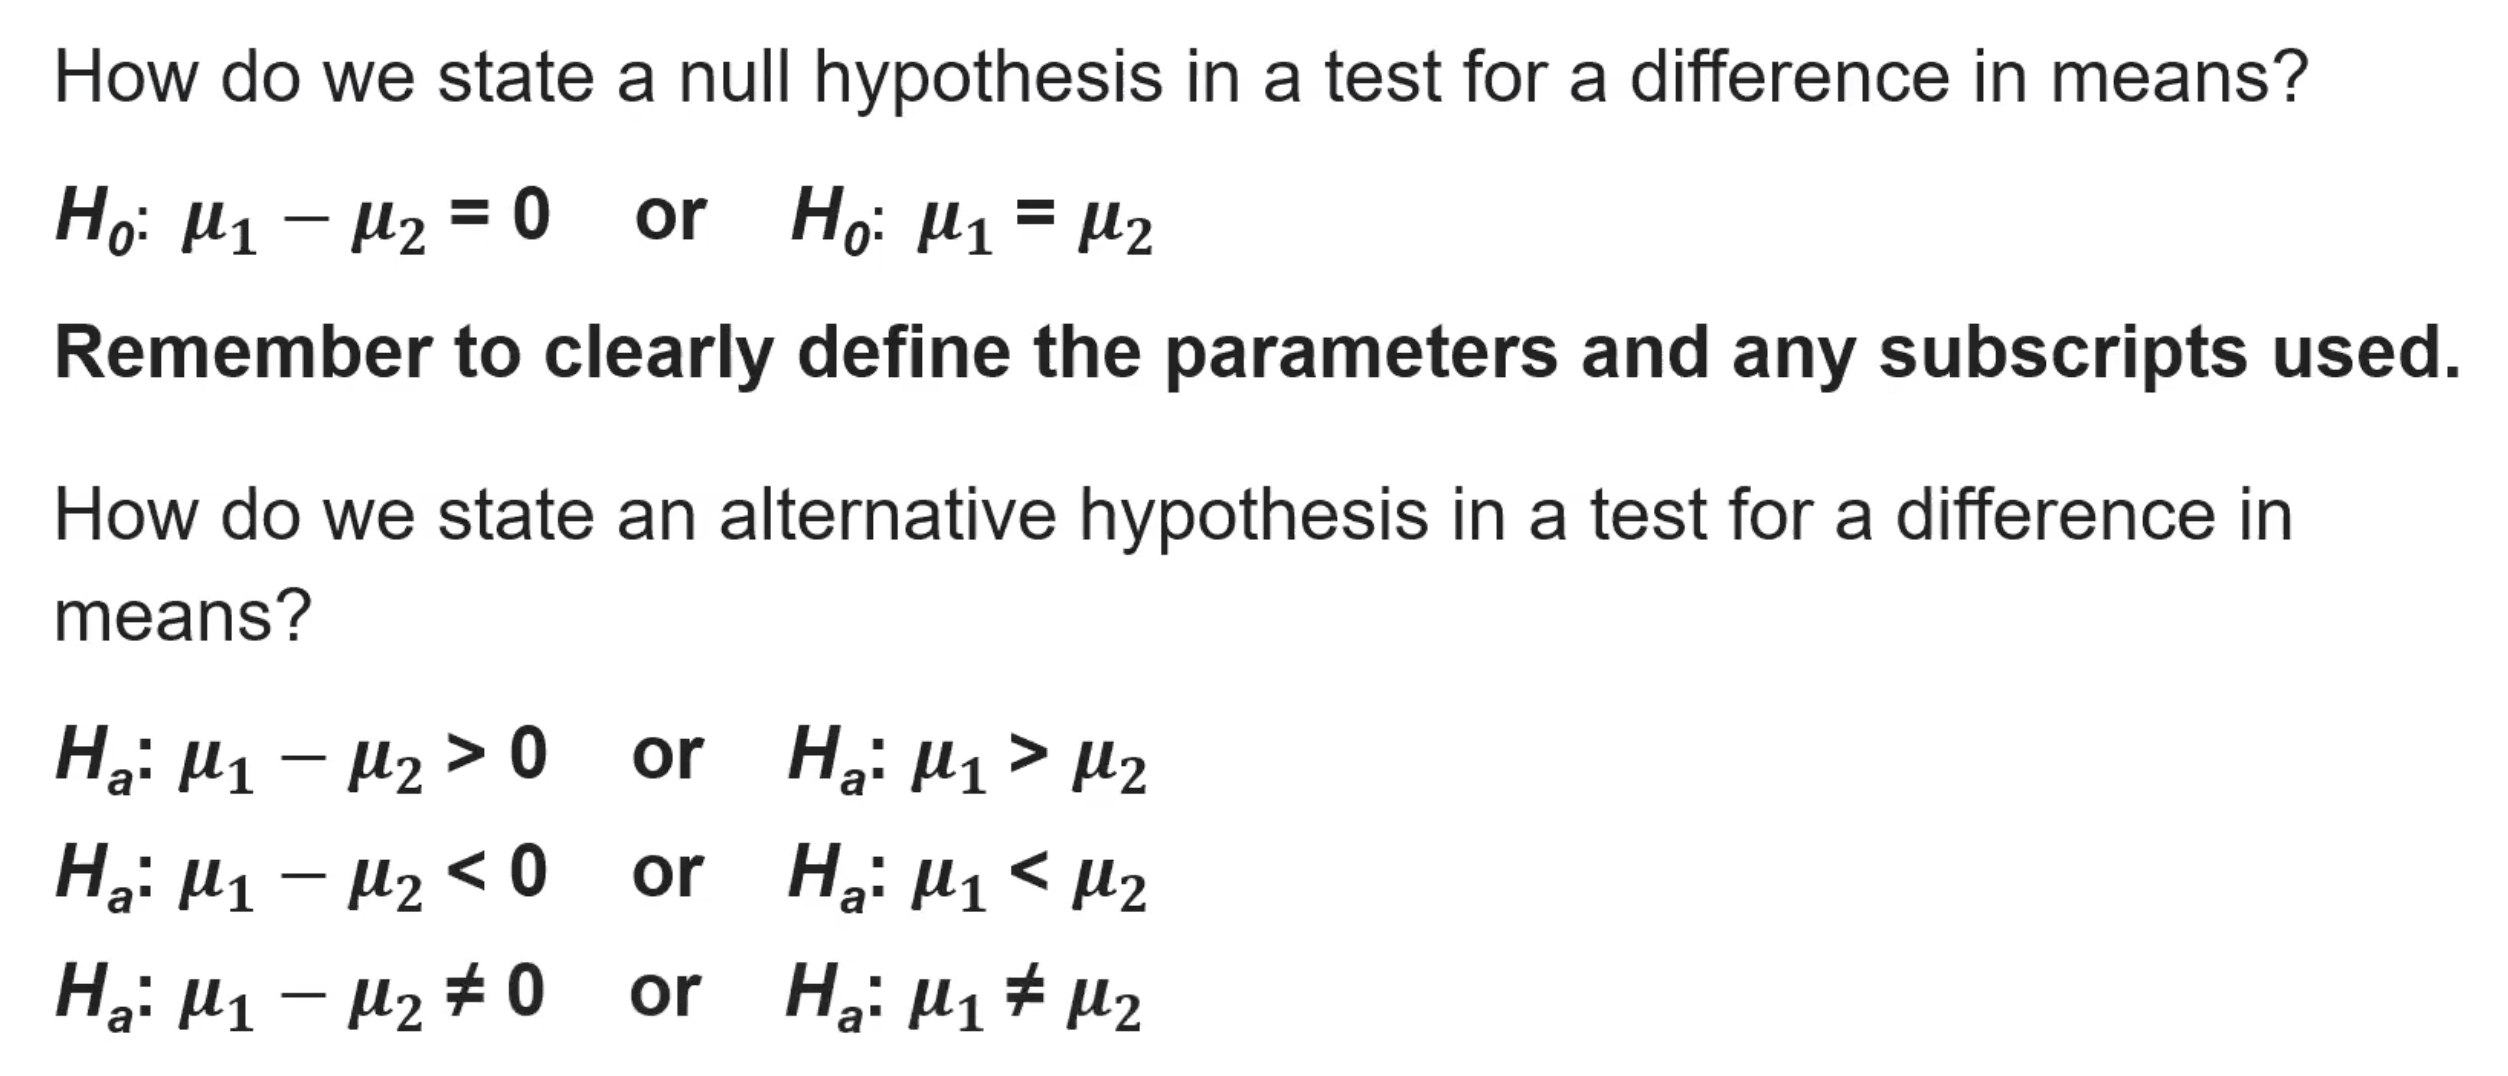
(7.8) How do we state a null hypothesis and an alternative hypothesis in a test for a difference in means?
(7.8) How do we verify the conditions for performing a significance test for a difference in means?
The data comes from two random samples OR a randomised experiment.
When sampling without replacement, the samples should be less than or equal to 10% of their respective populations.
Both n1 > 30 and n2 > 30 OR they should come from approximately normal distributions.
(7.9) How do we calculate an appropriate test statistic and p-value in a test for the difference of two population means.
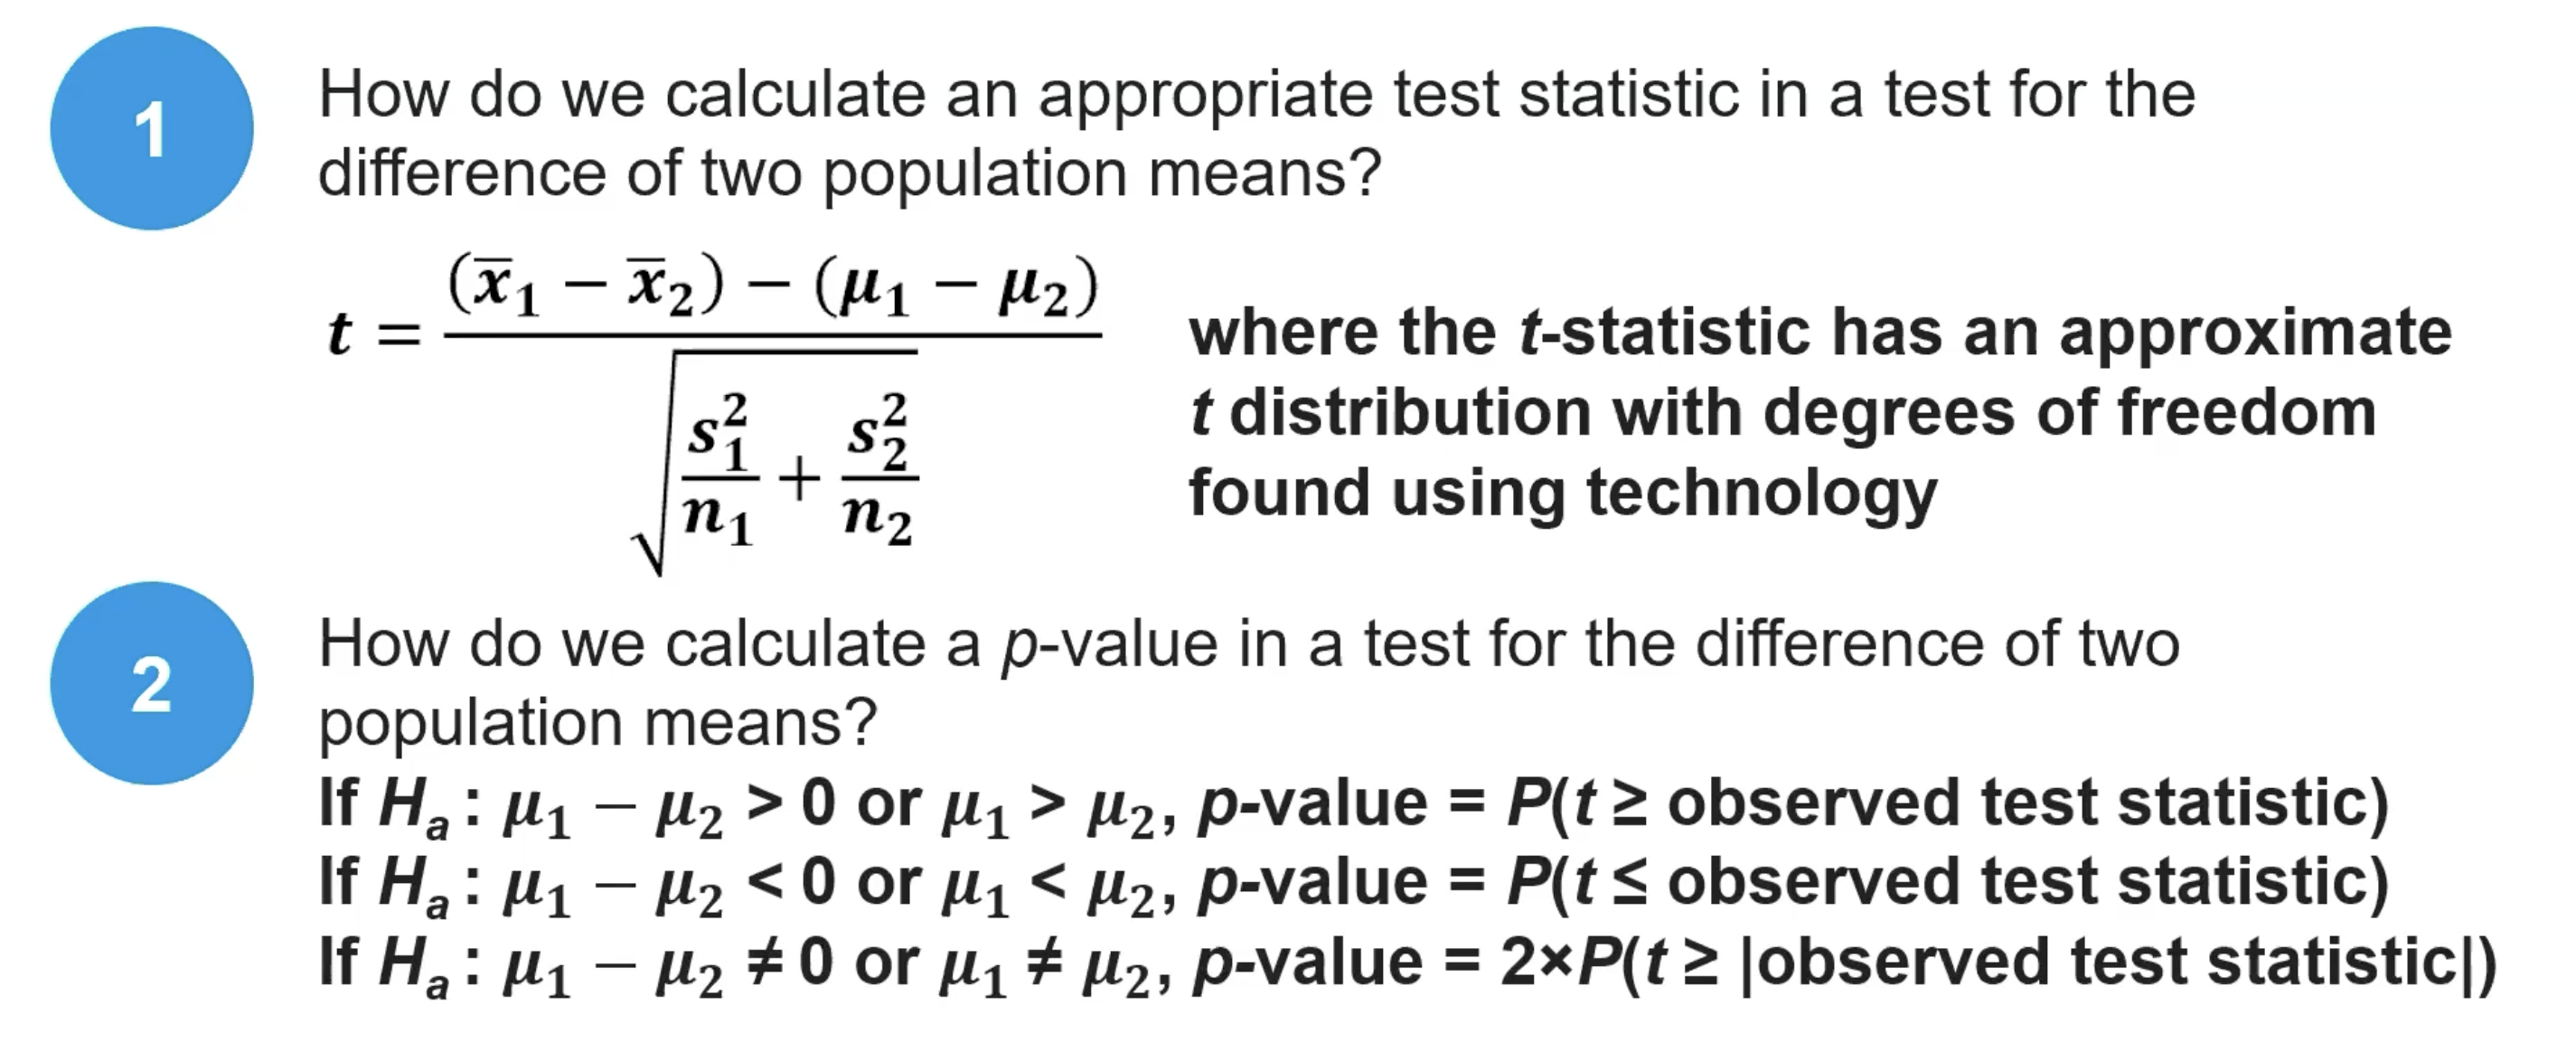
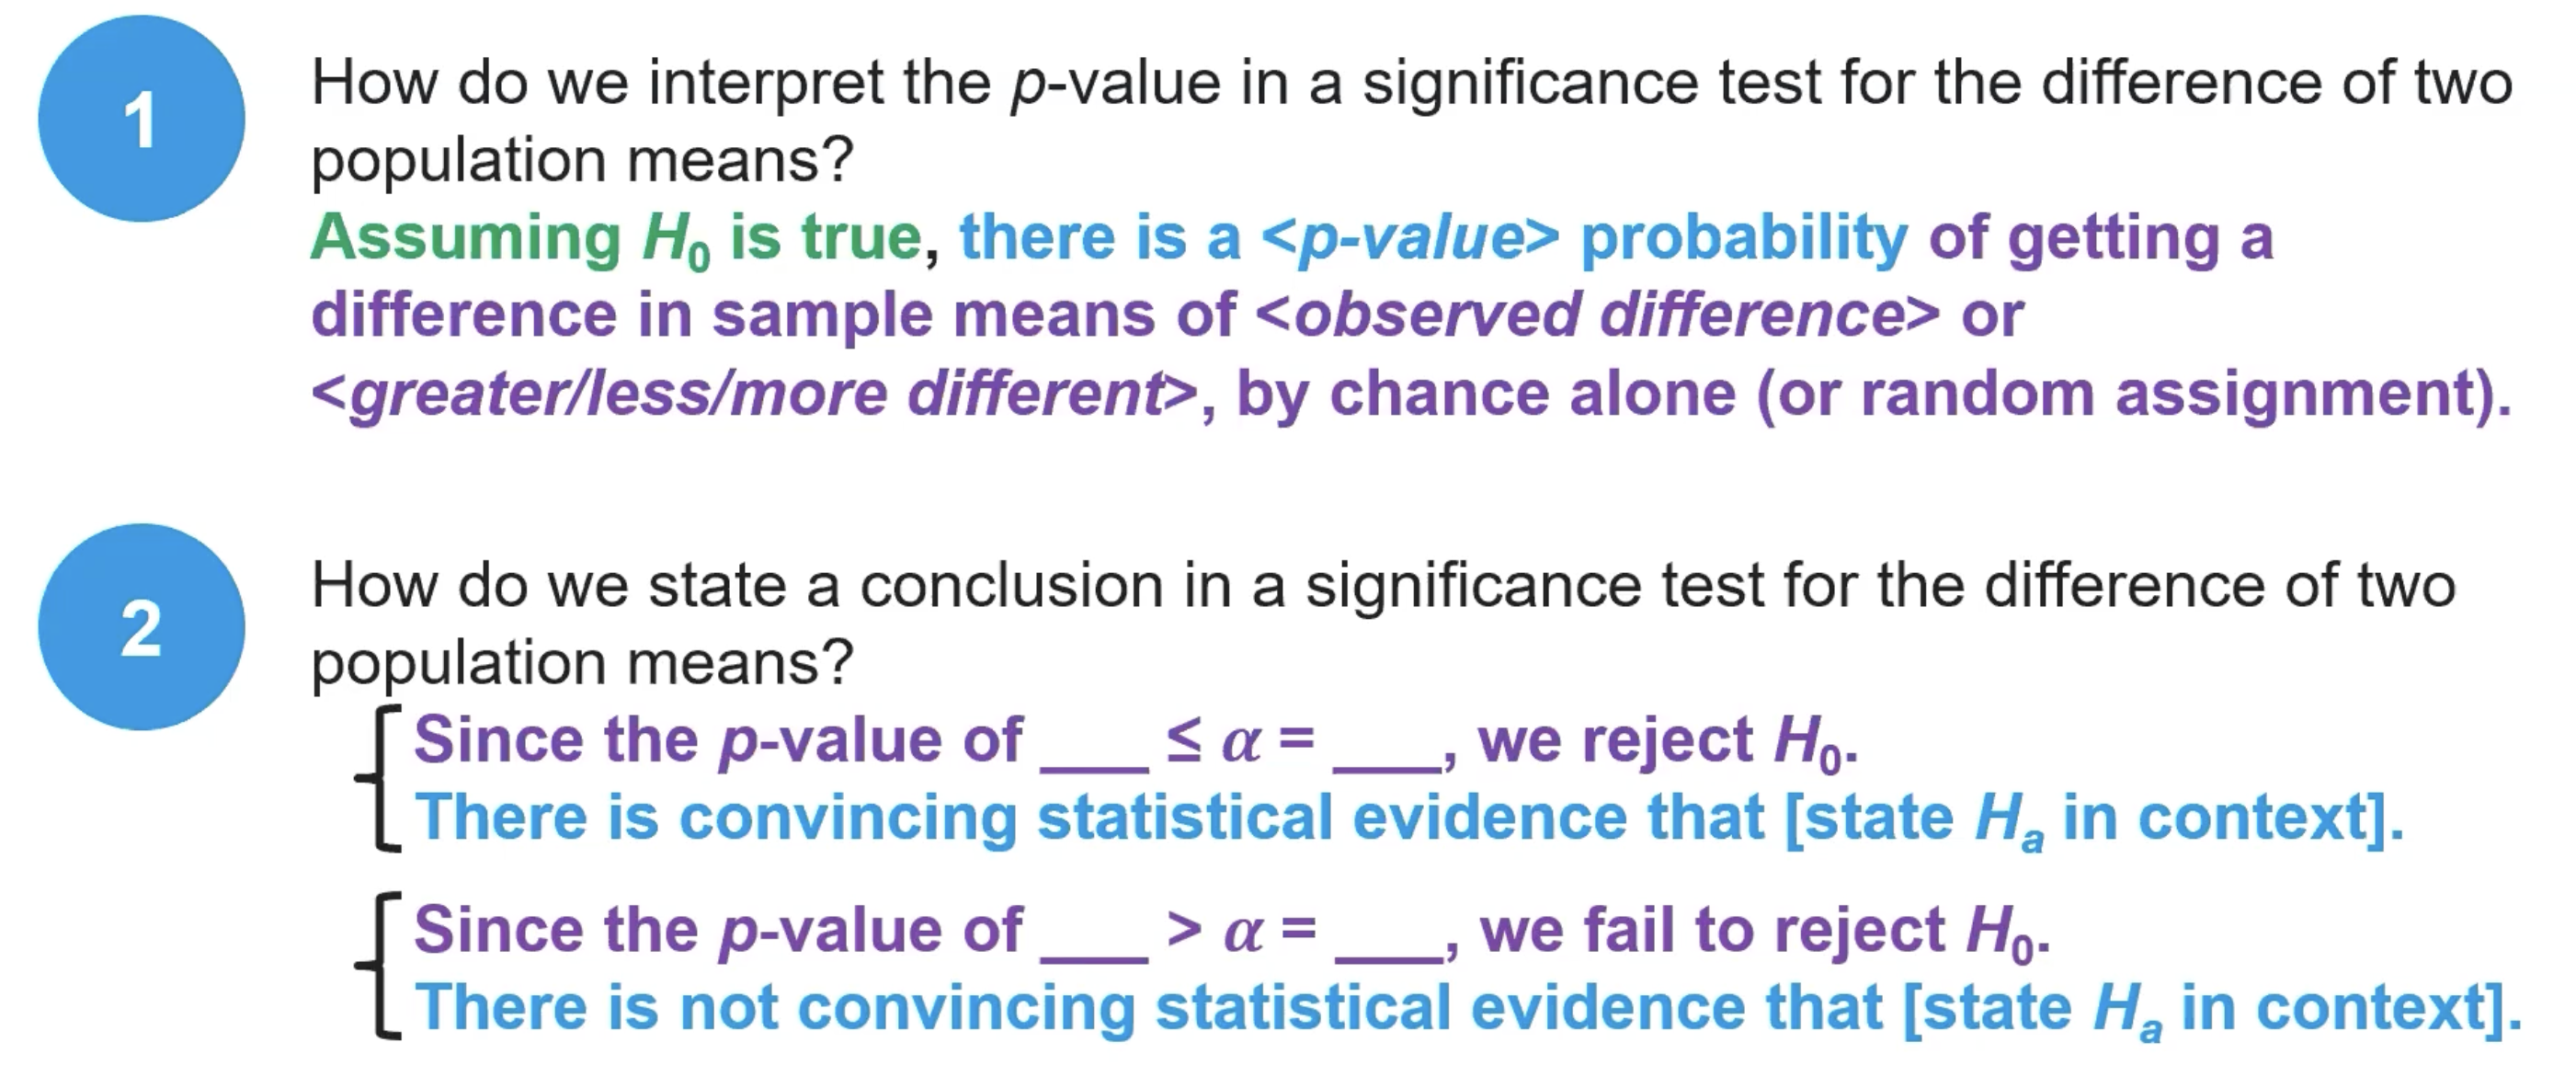
(7.9) How do we interpret and state the conclusion in a significance test for the difference of two population means?
(7.9) How do we perform a complete significance test for the difference of two population means?
Define the parameters
State the hypothesis
Always use equality in the H0.
Indicate the correct inequality in the Ha (>, <, ≠)
Identify the correct procedure you are using
Verify the conditions for the procedure are met
Calculate the test statistic, df, and p-value
Interpret the values in context
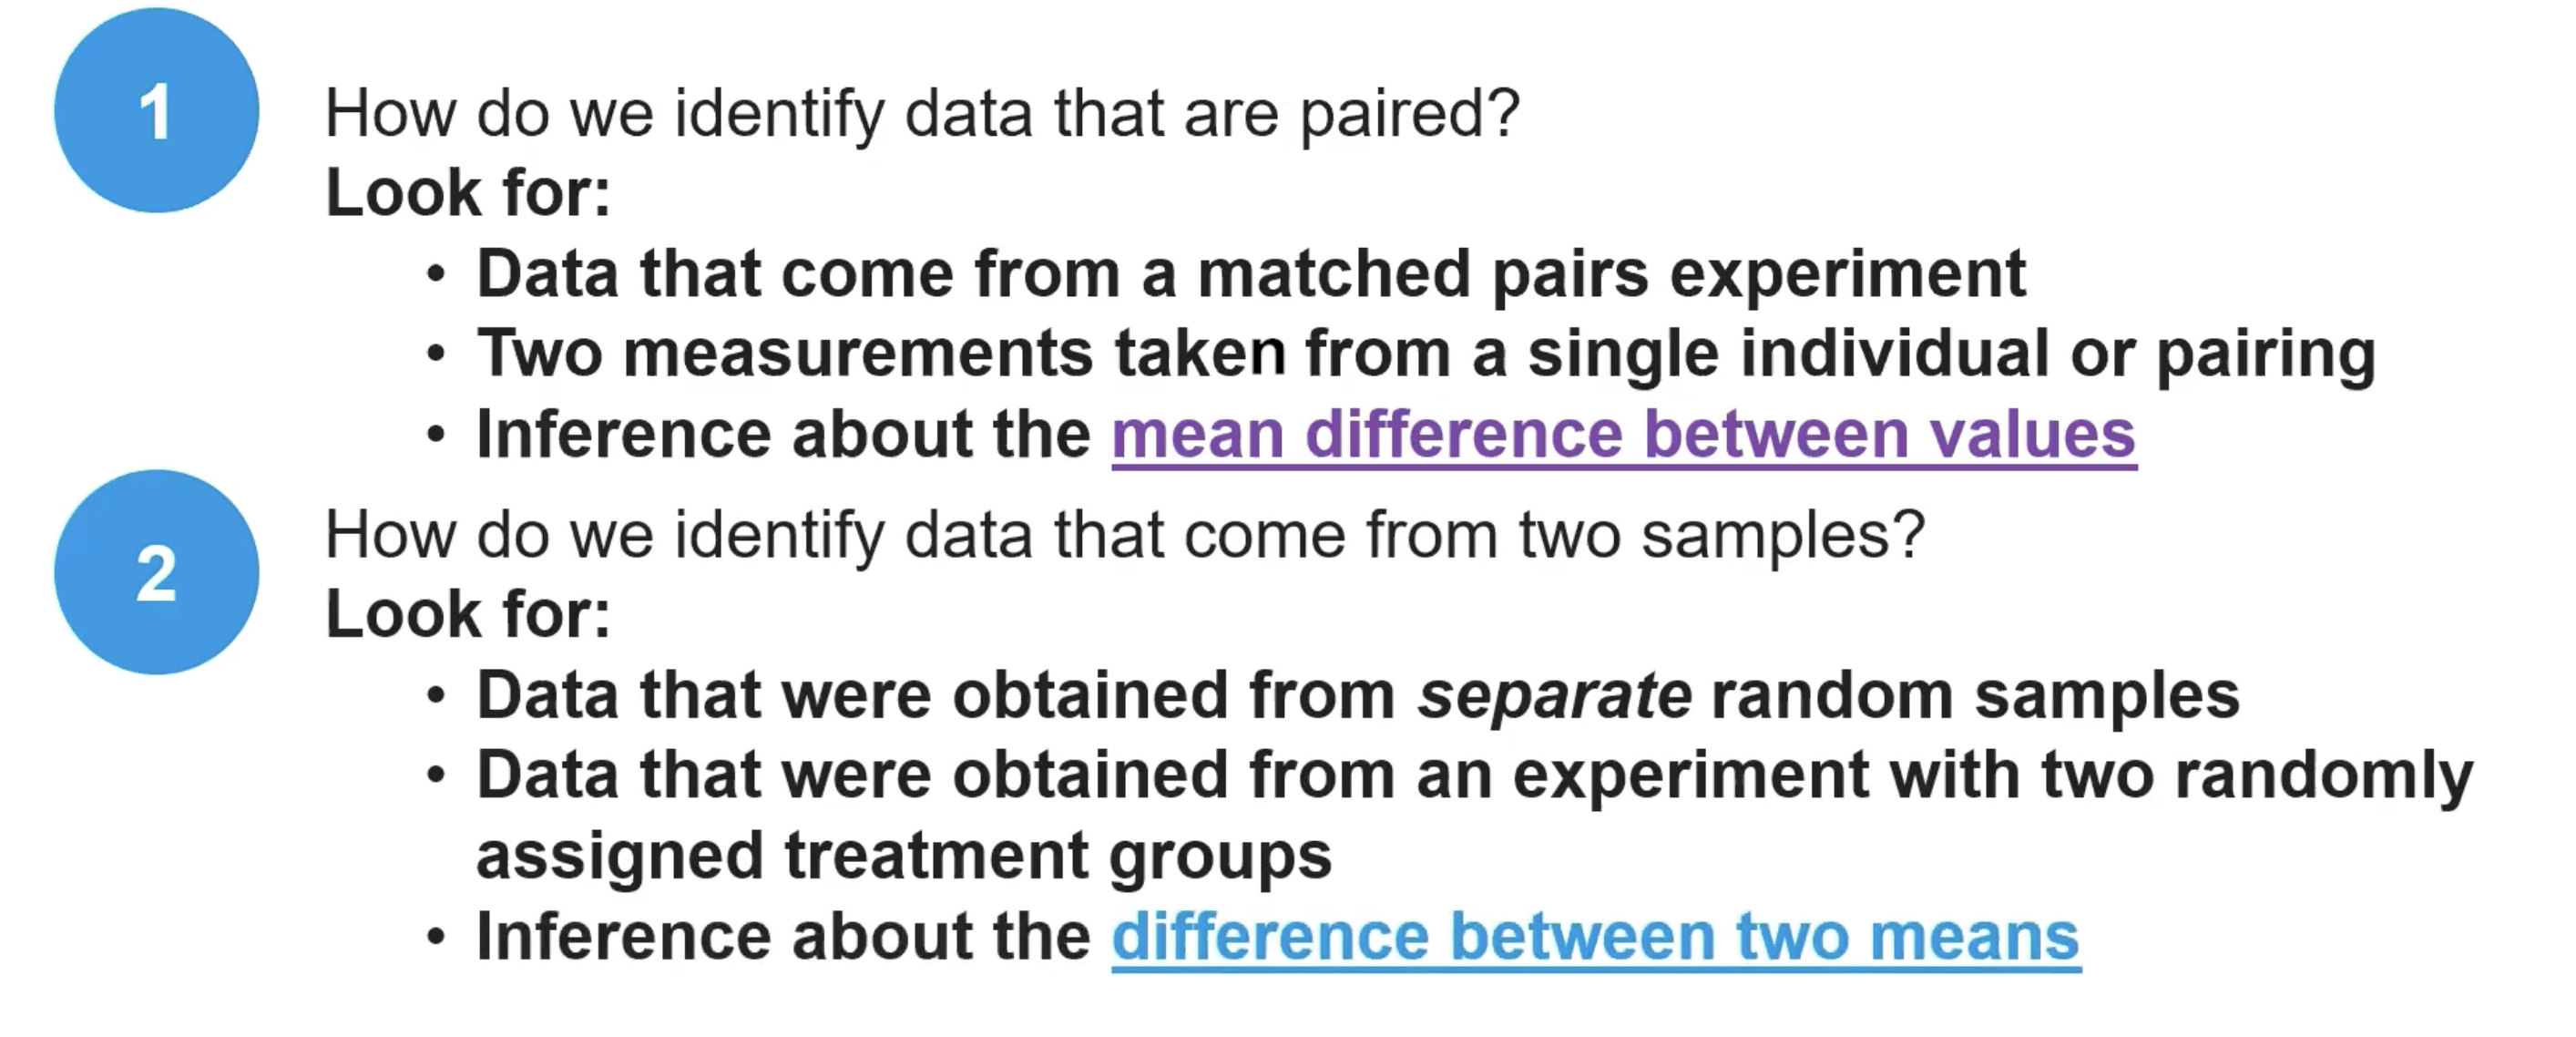
(7.10) How do we identify data that are paired and data that come from two samples?
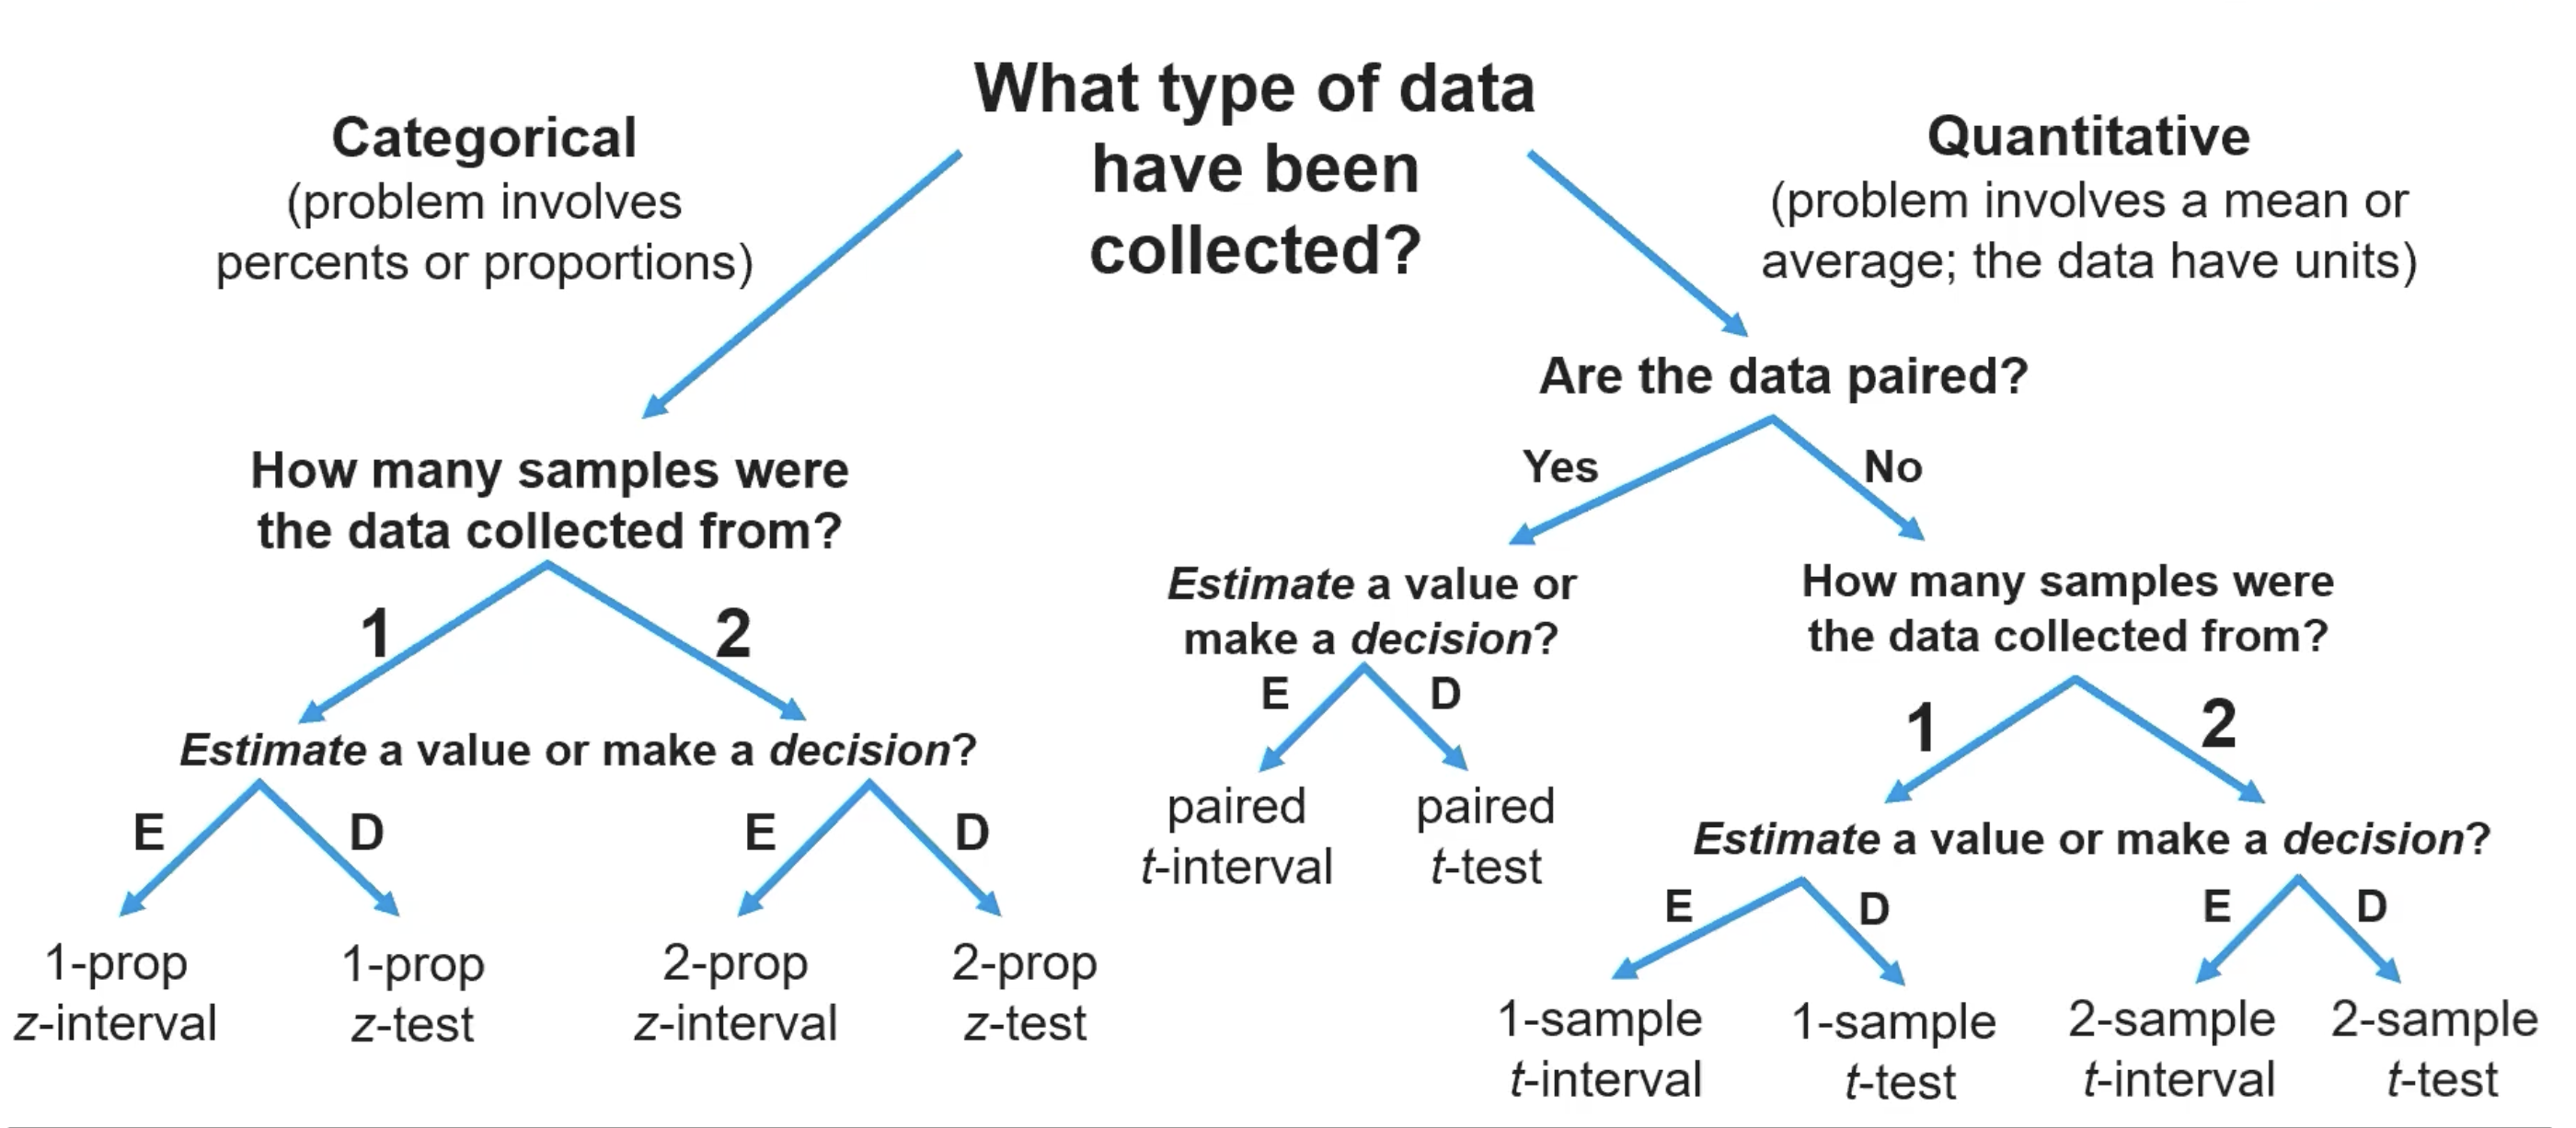
(7.10) How do we identify an appropriate inference procedure involving proportions or means?