AP Macroeconomics Practice 11 (Graphs Loanable Funds) - CCHS - Five Cawley
1/34
There's no tags or description
Looks like no tags are added yet.
Name | Mastery | Learn | Test | Matching | Spaced | Call with Kai |
|---|
No analytics yet
Send a link to your students to track their progress
35 Terms
What are the two economic graphs that show interest rate?
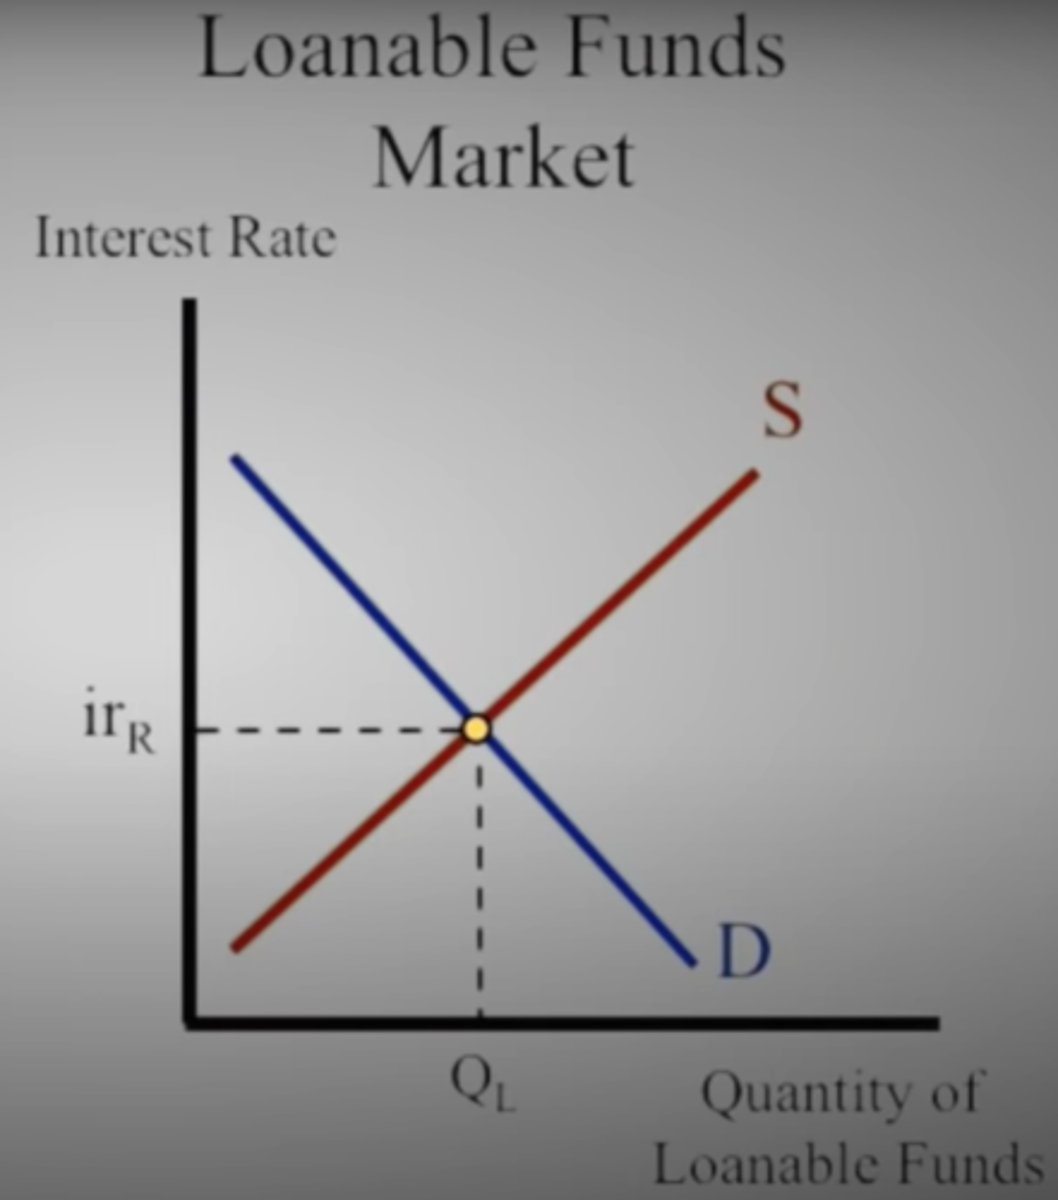
Loanable Funds
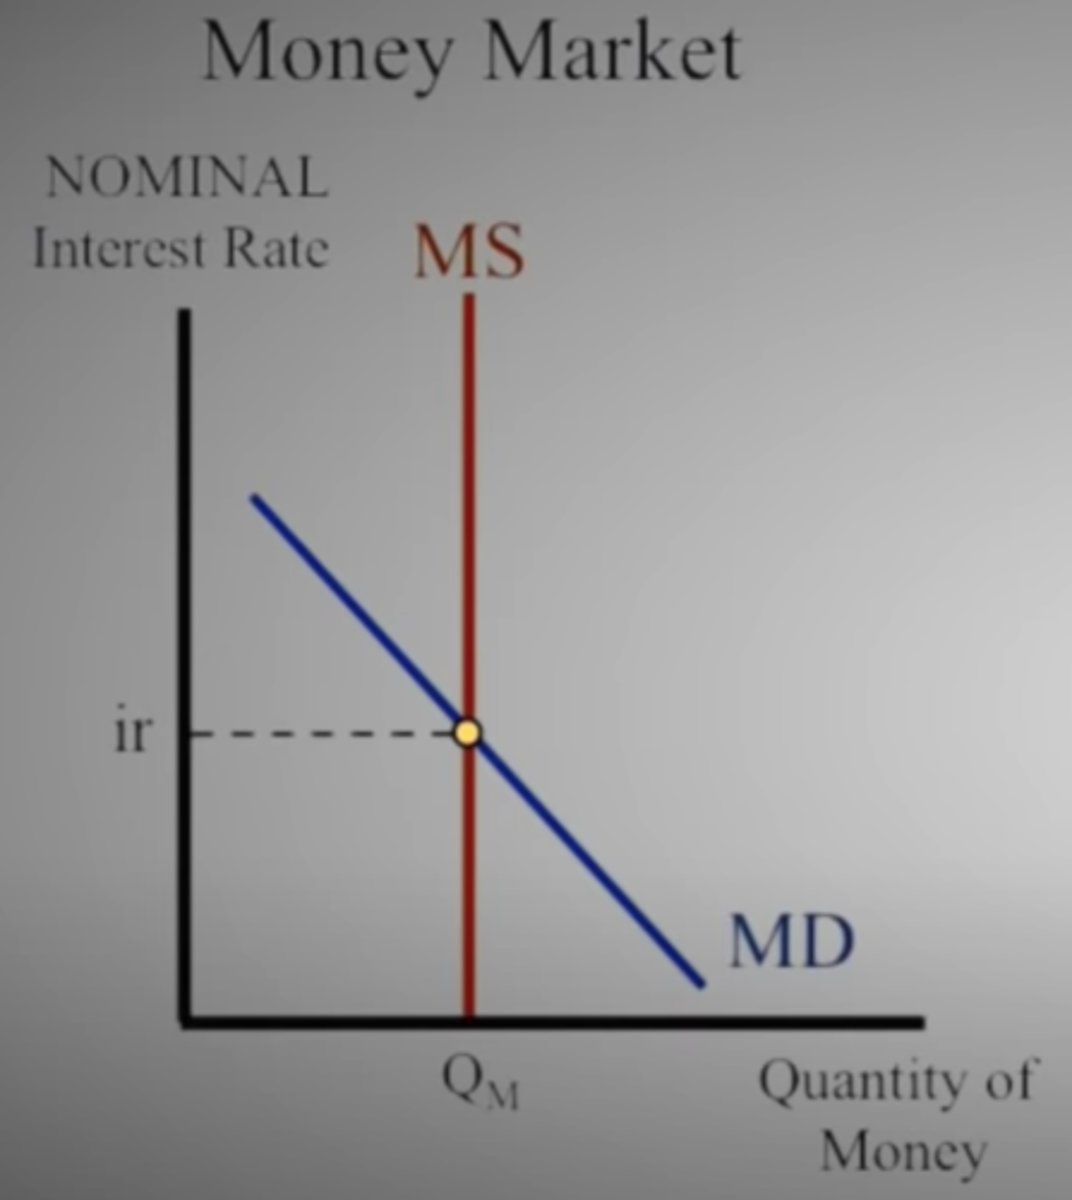
Money Market
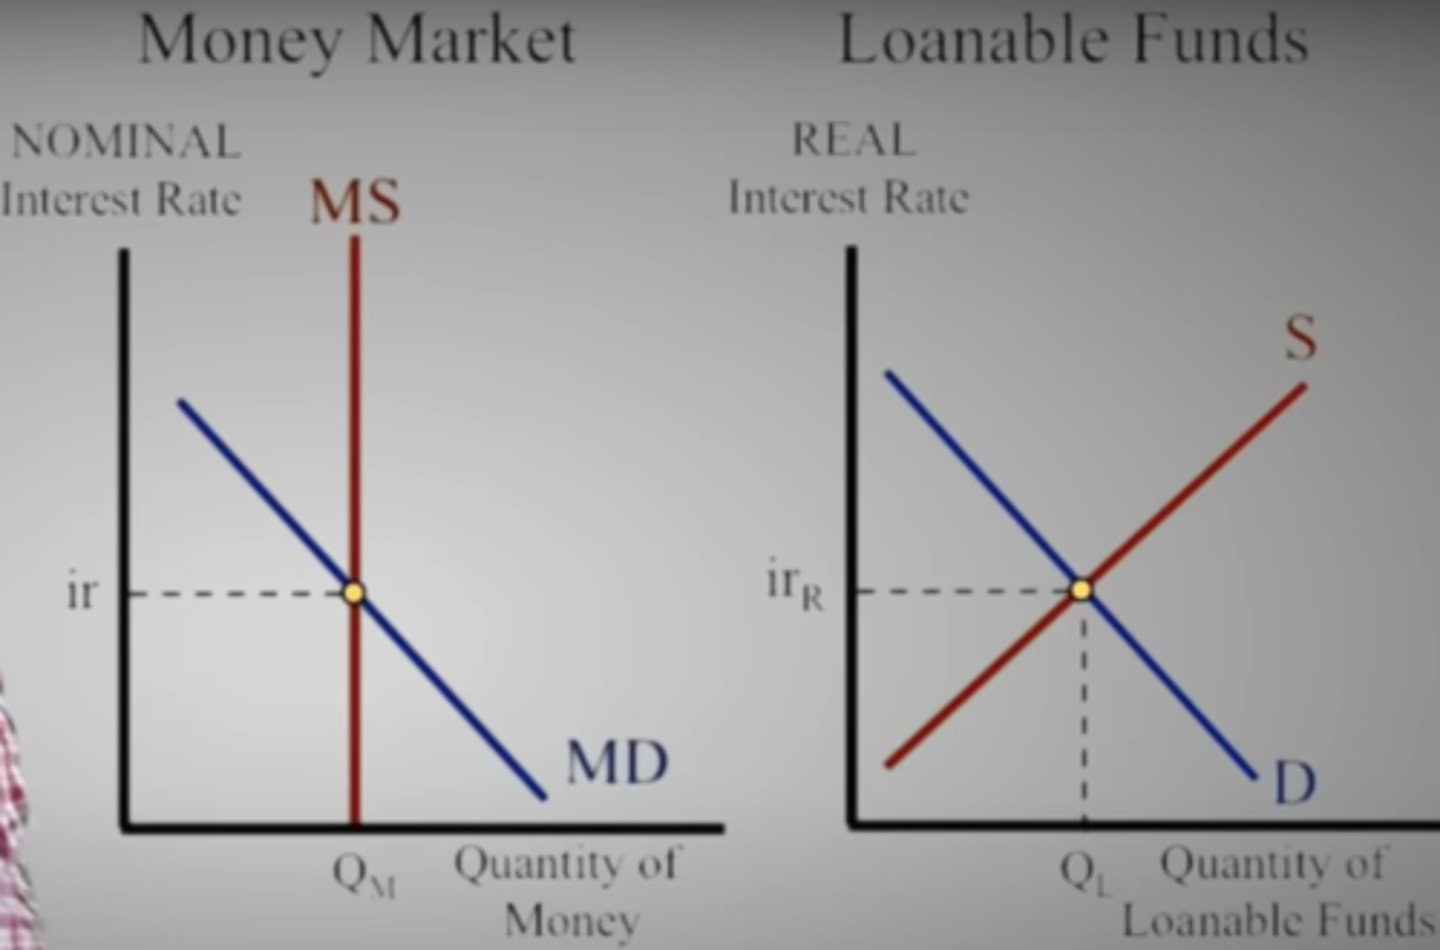
Which graph shows the nominal interest rate and impacts the short-run?
A. Loanable Funds
B. Money Market
B. Money Market
Which graph shows the real interest rate and impacts the long-run?
A. Loanable Funds
B. Money Market
A. Loanable Funds
What is the difference between nominal interest rate and real interest rate?
nominal interest rate = real interest rate + inflation rate
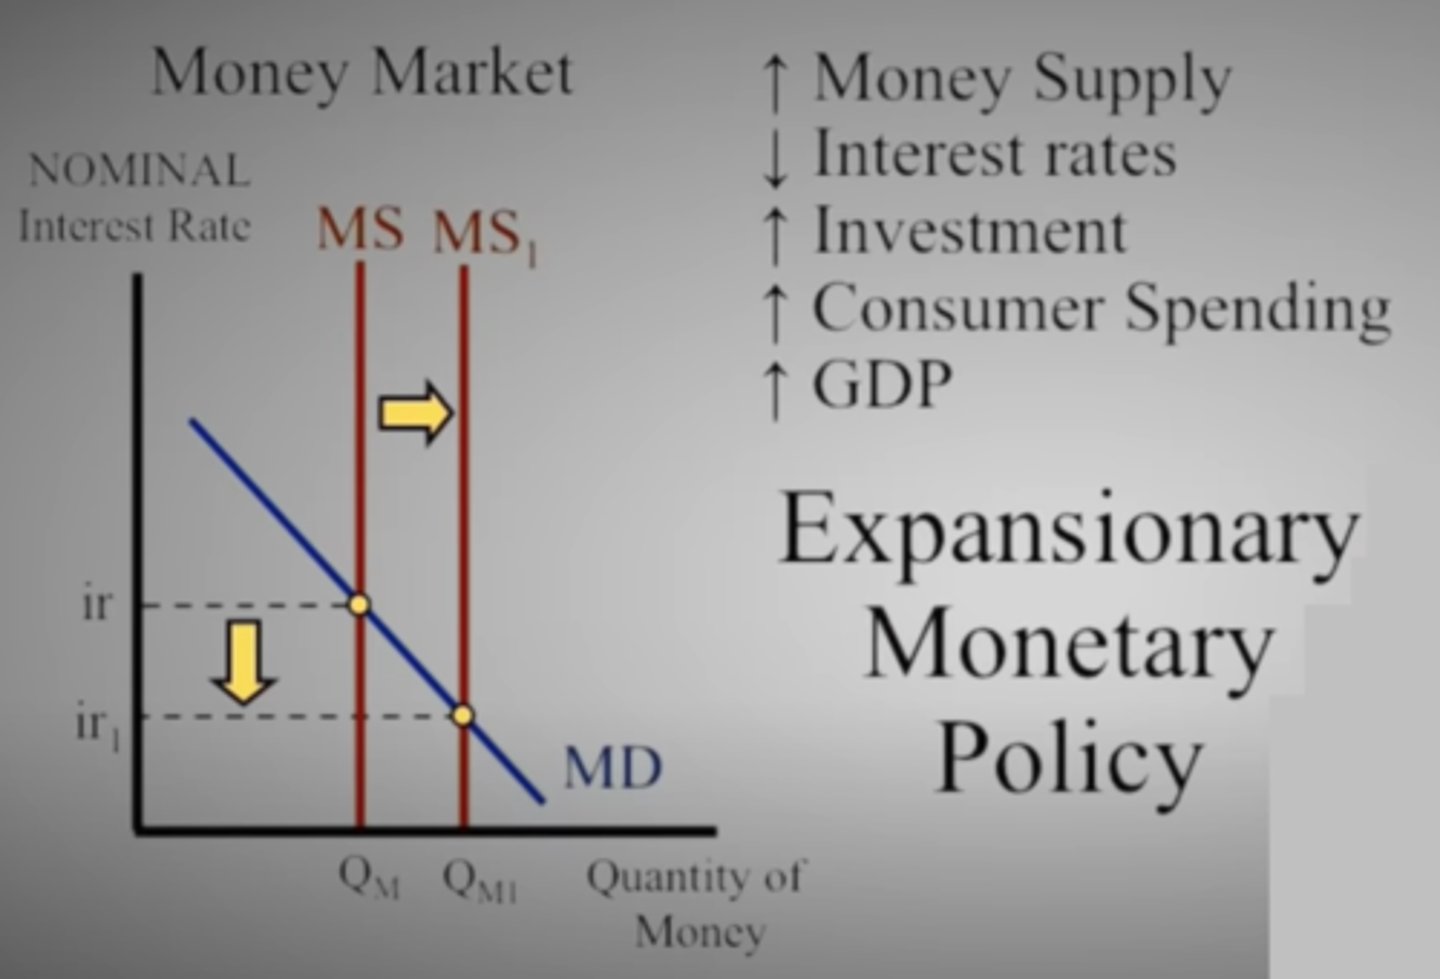
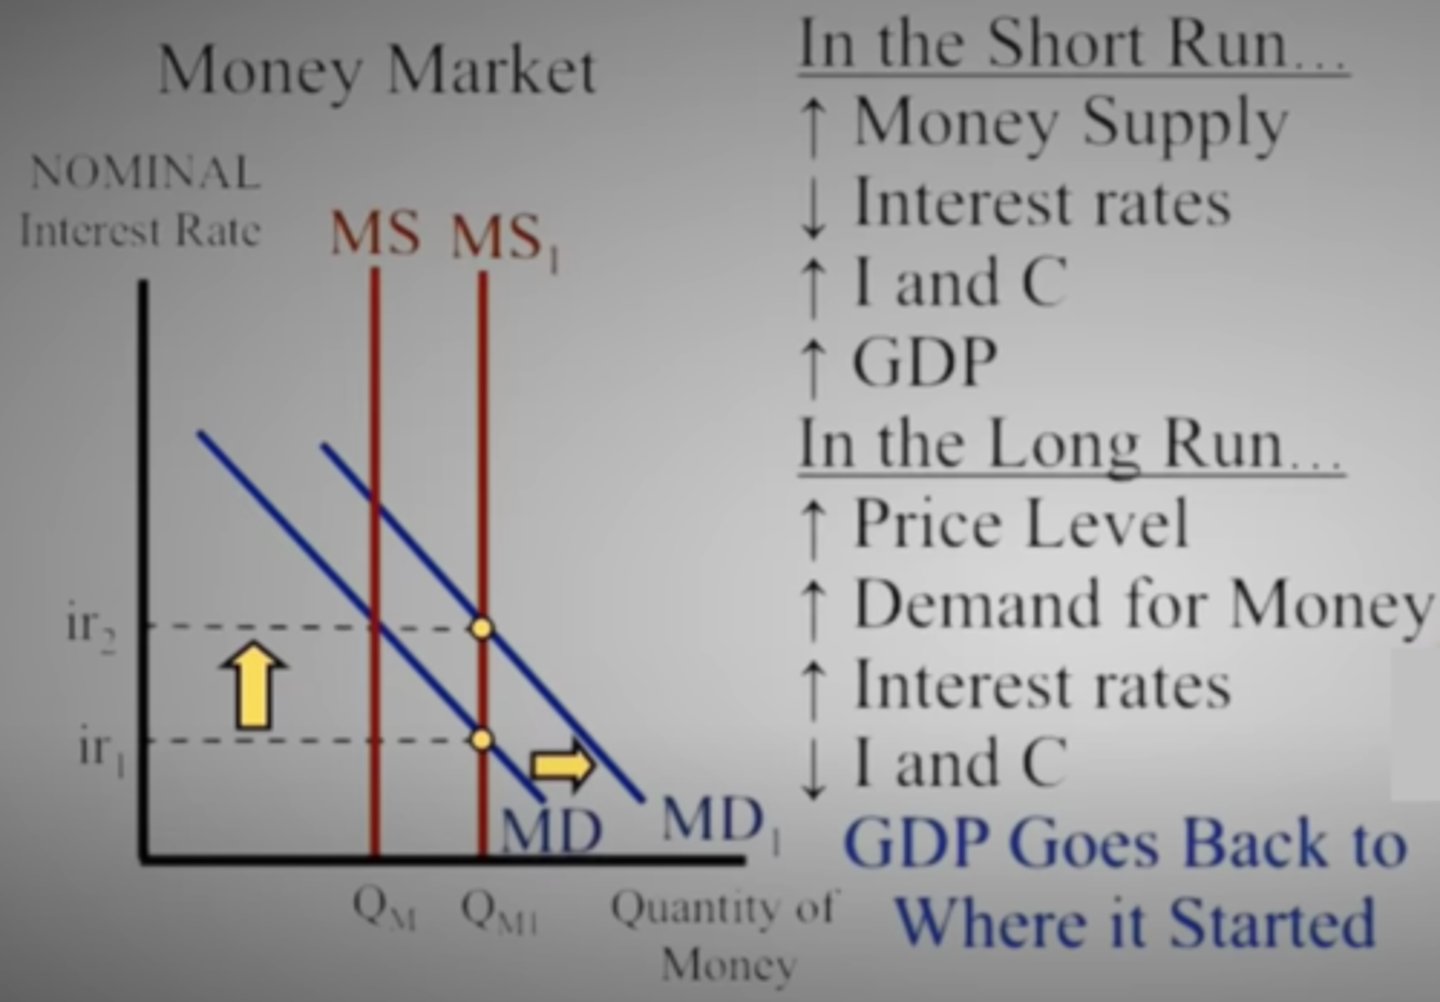
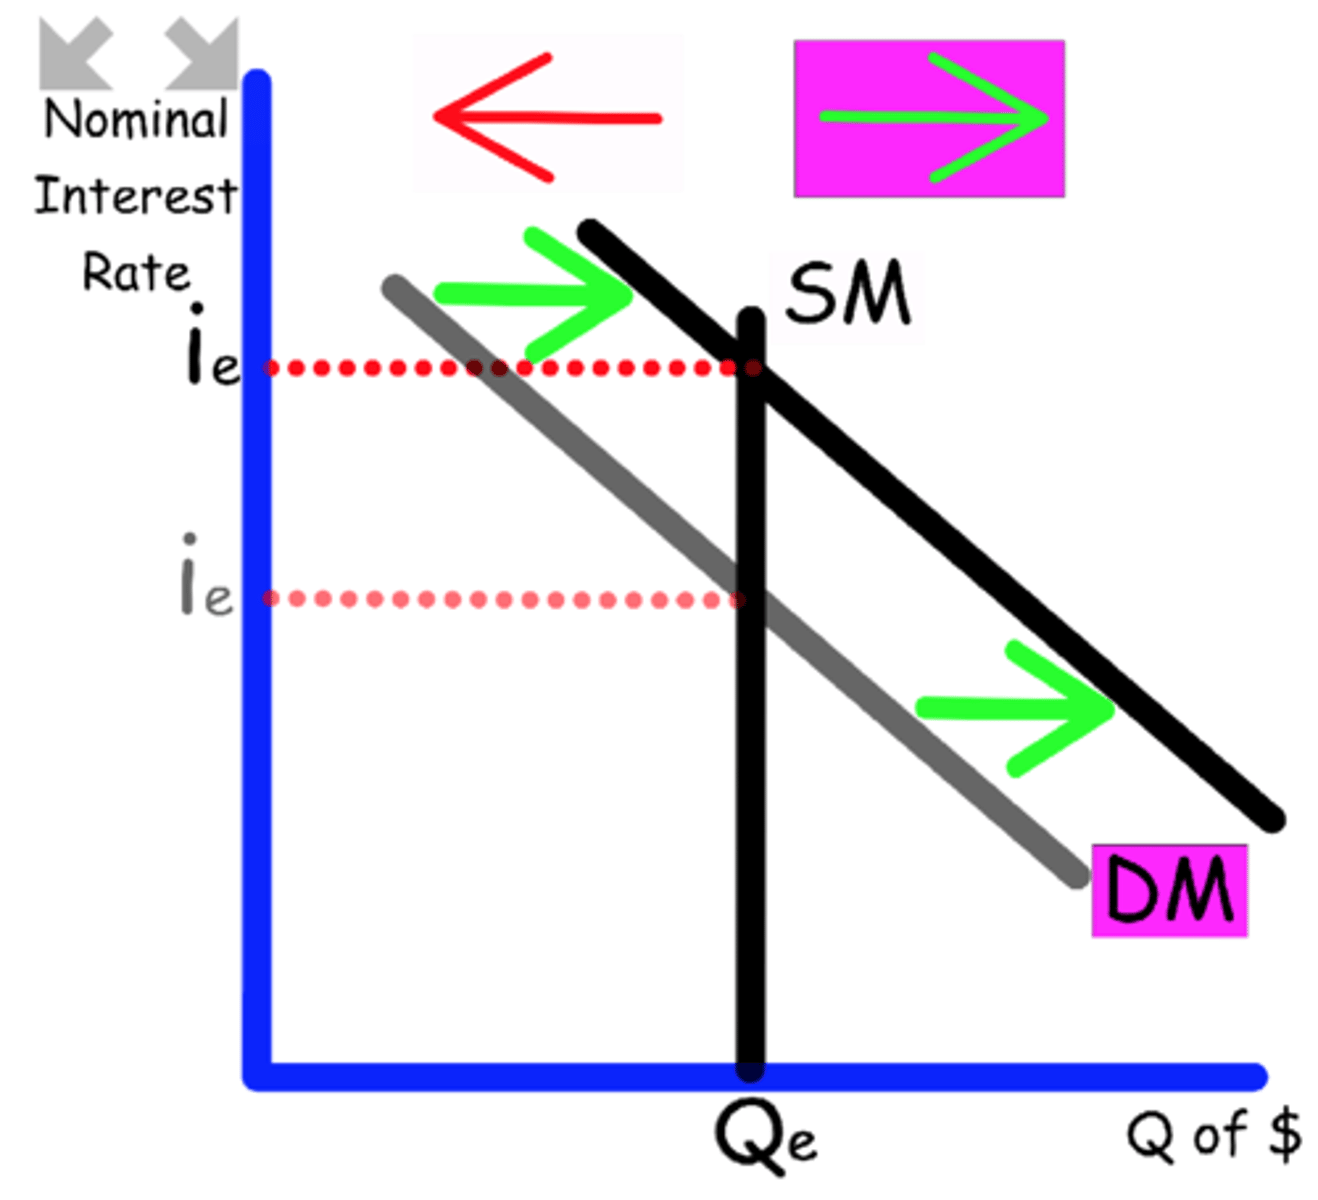
In the Money Market graph, what happens to nominal interest rates when the money supply is increased?
Nominal interest rates decrease
Investment goes up
Consumer spending goes up
GDP goes up
All Expansionary Policy
Remember - this is short-run
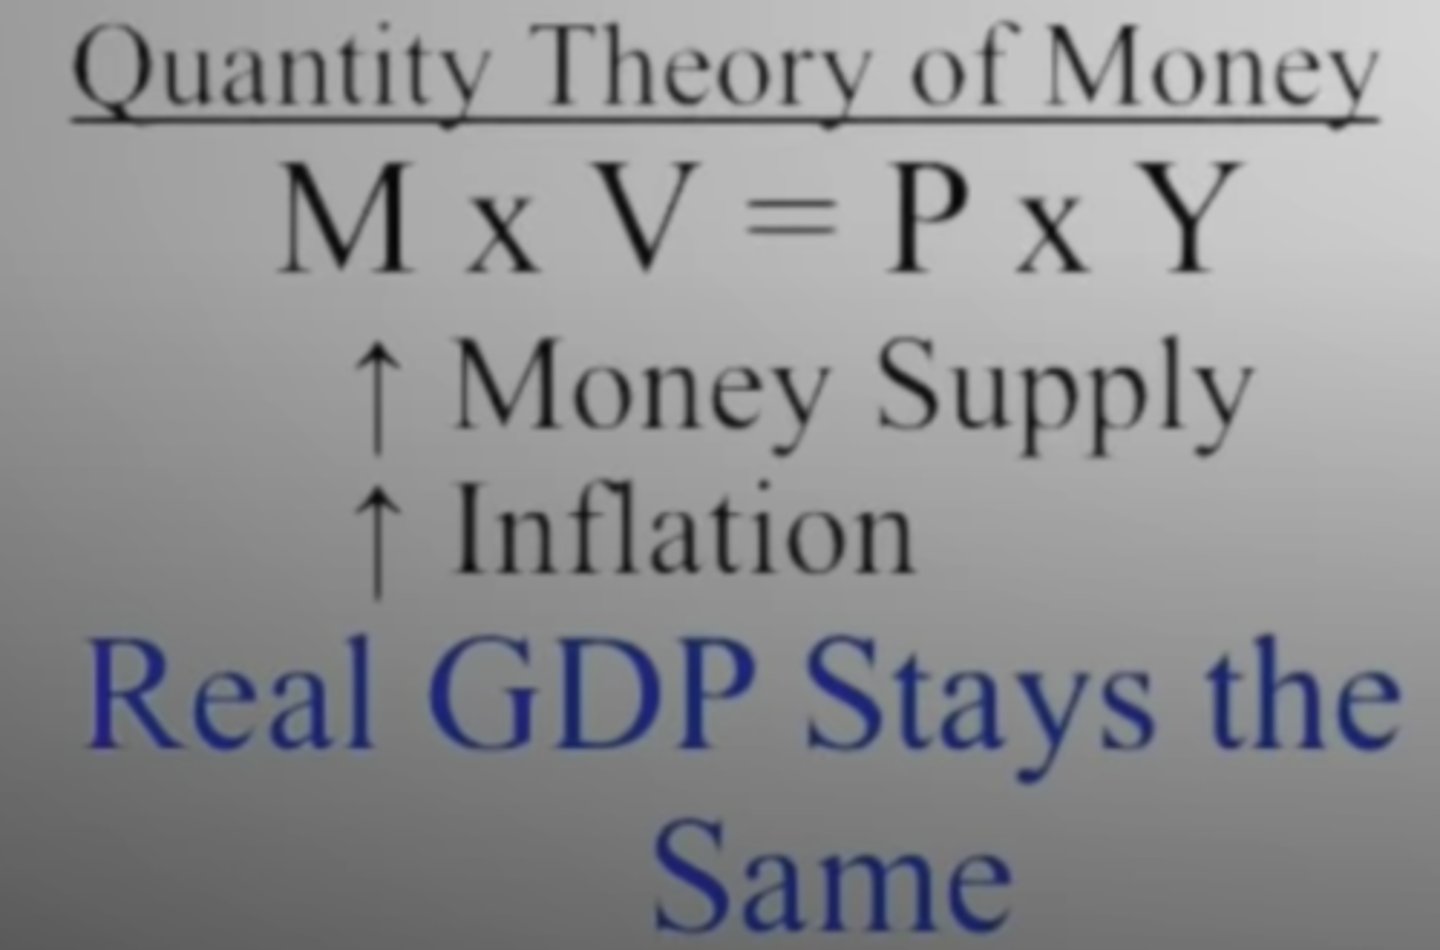
What is the Quantity of Money Theory?
The quantity of money available determines the price level and the growth rate in the quantity of money available determines the inflation rate
MV = PQ
If the money supply increase, prices will increase (inflation) and real GDP will stay the same
Remember - this is long-run
Explain how an increase in the Money Supply can increase GDP in the short-run but return GDP to equilibrium in the long-run?
The money supply will shift to the right causing the nominal interest rate to decrease.
A lower interest rate, will cause the demand for money to shift to the right in the long-run, returning GDP to equilibrium.
This matches the Quantity Theory of Money in the long-run.
What is the Fischer Effect?
An increase in expected future inflation drives up the nominal interest rate, leaving the expected real interest rate unchanged
What is the opportunity cost for holding money (say under your mattress)?
The opportunity cost for holding money is the interest rate that could have been earned if the money were saved in a CD, money market, savings account.
With higher interest rates, more money will be saved in a bank increasing loanable fund supply.
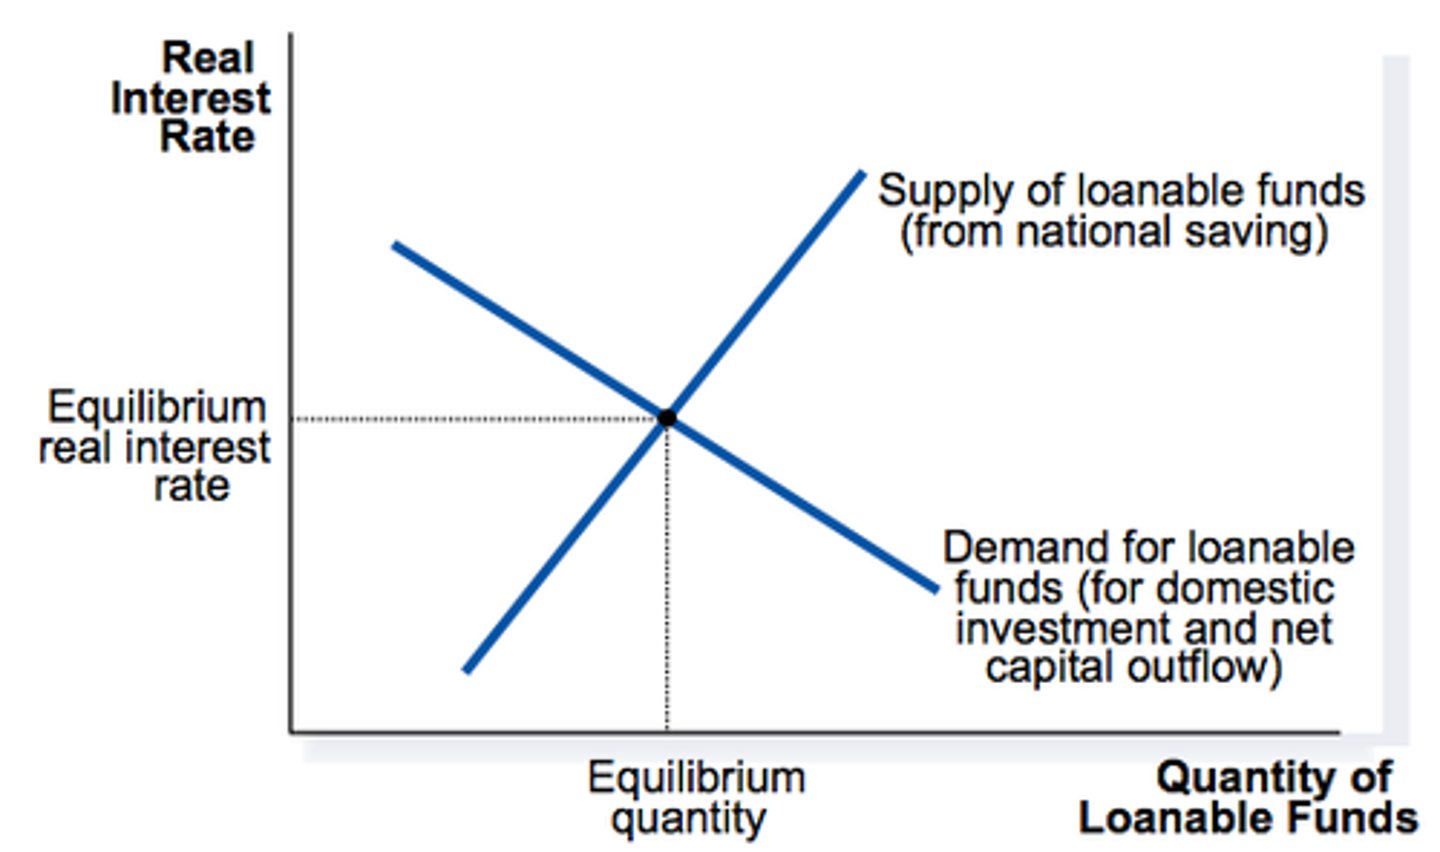
Draw and label the Loanable Funds graph with the correct interest rate.
money available for lending and borrowing
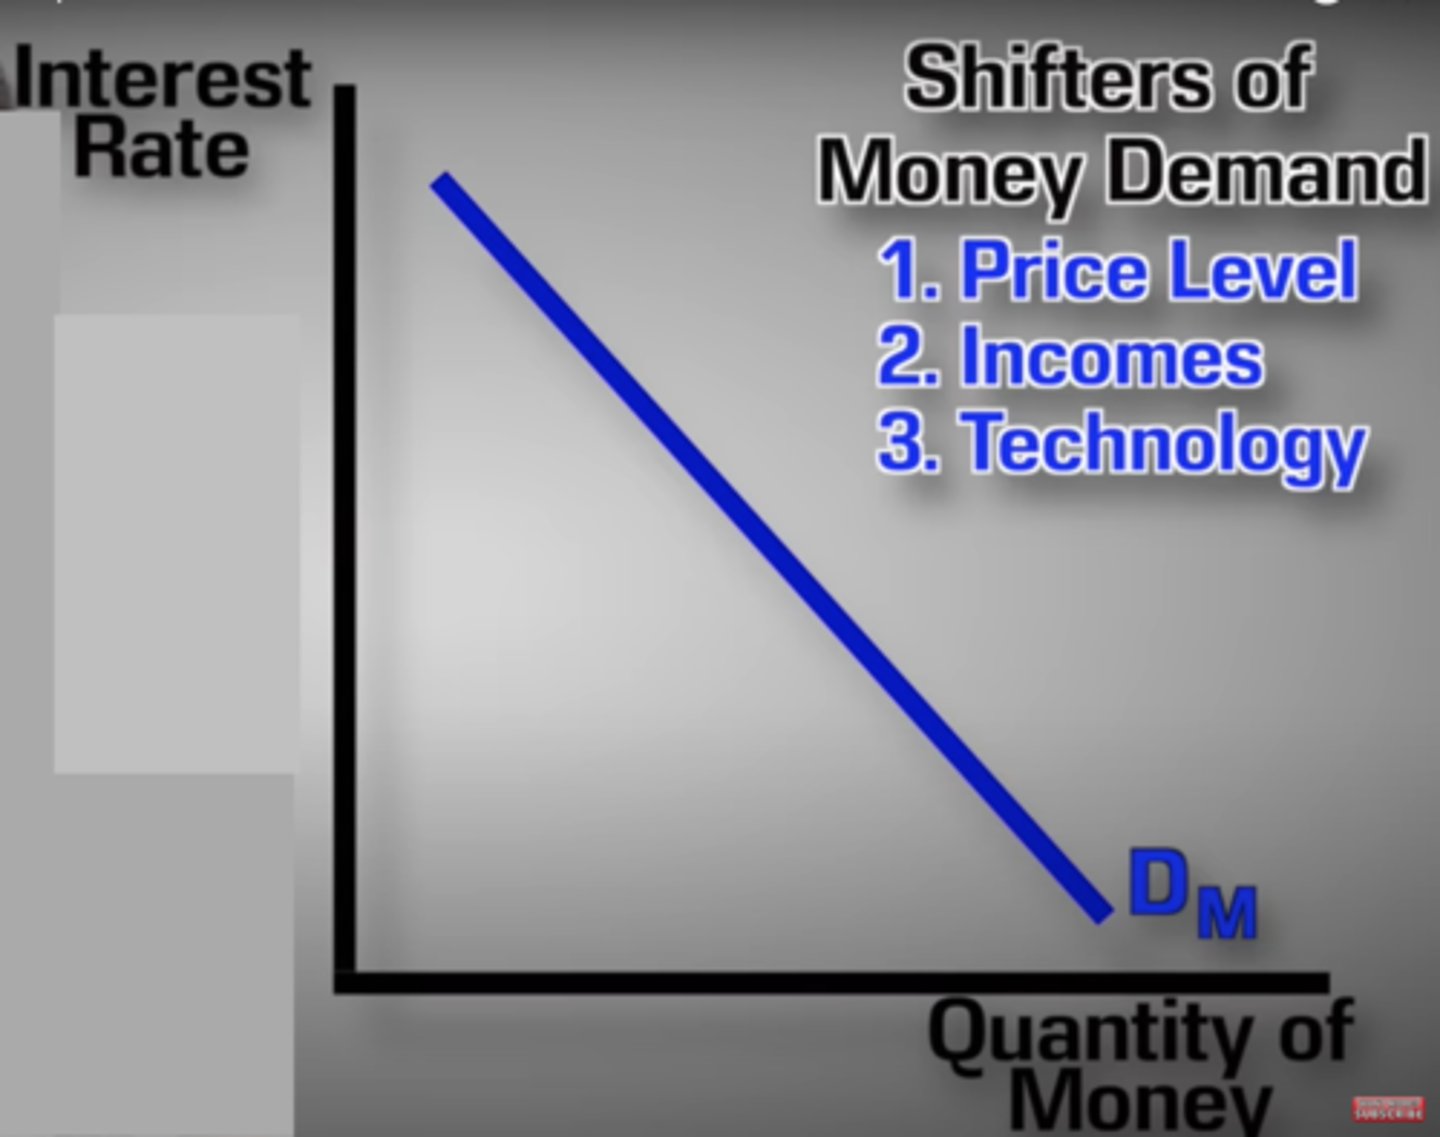
What are the three shifters of money demand in the Money Supply graph?
Price Level
Income
Technology
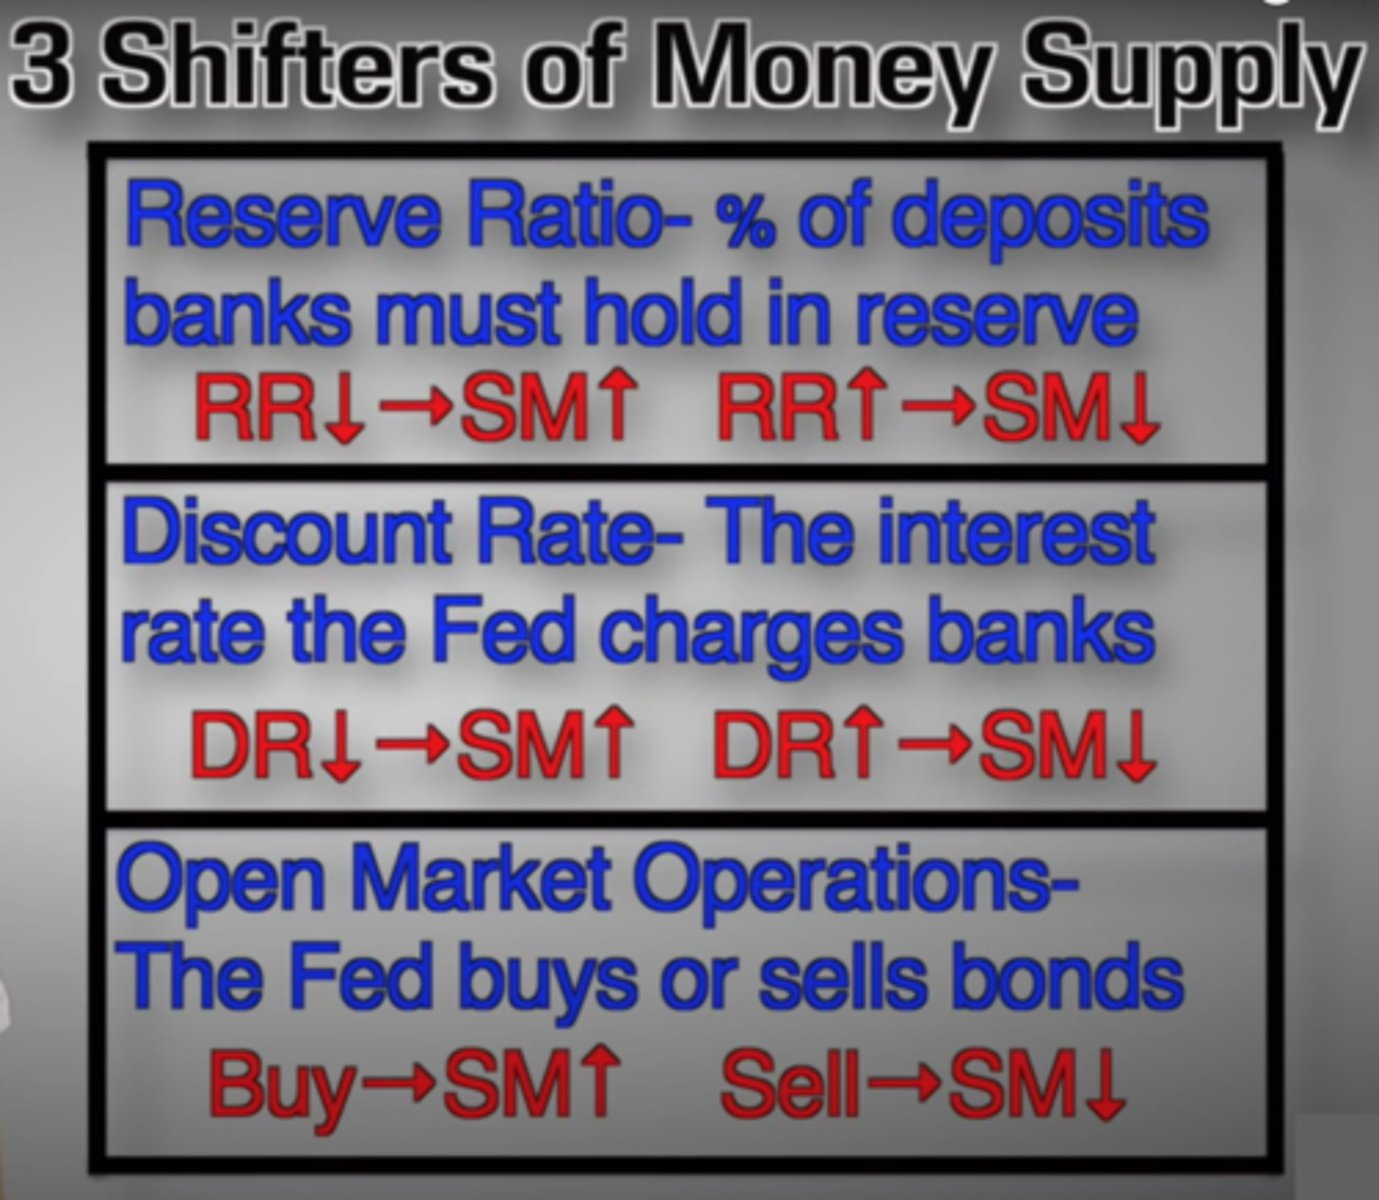
What are the three shifters of money supply in the Money Supply graph?
The Federal Reserve is the only way to shift the supply of money.
They use
the Reserve Requirement
the Discount Rate, interest rate
the Open Market buy and sell bonds
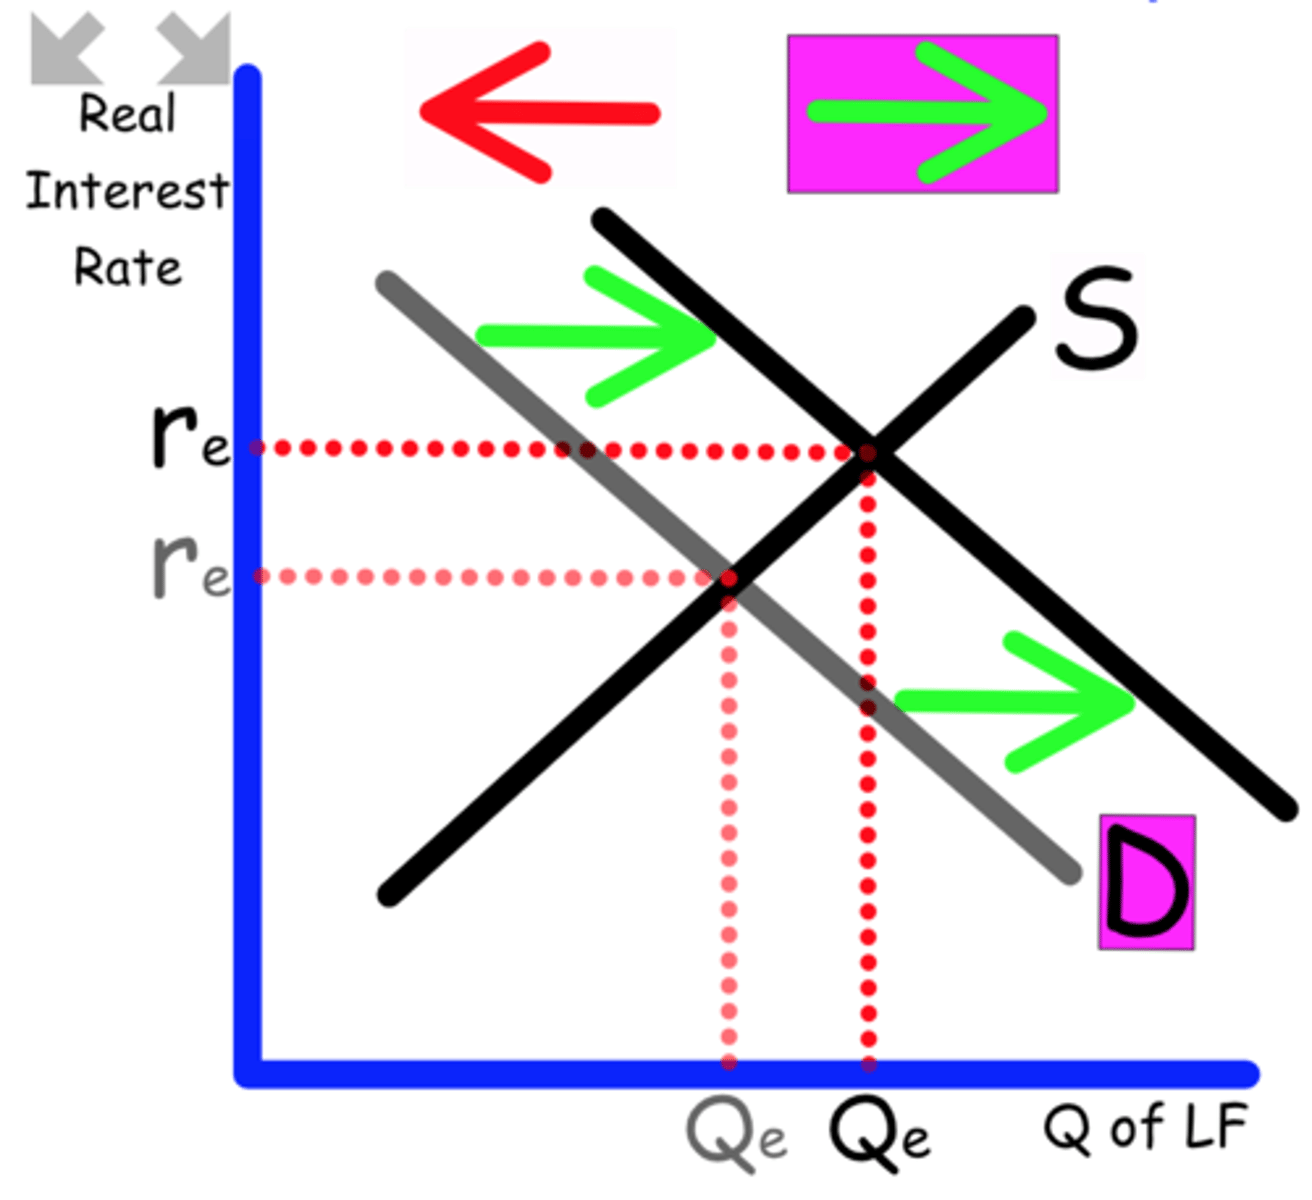
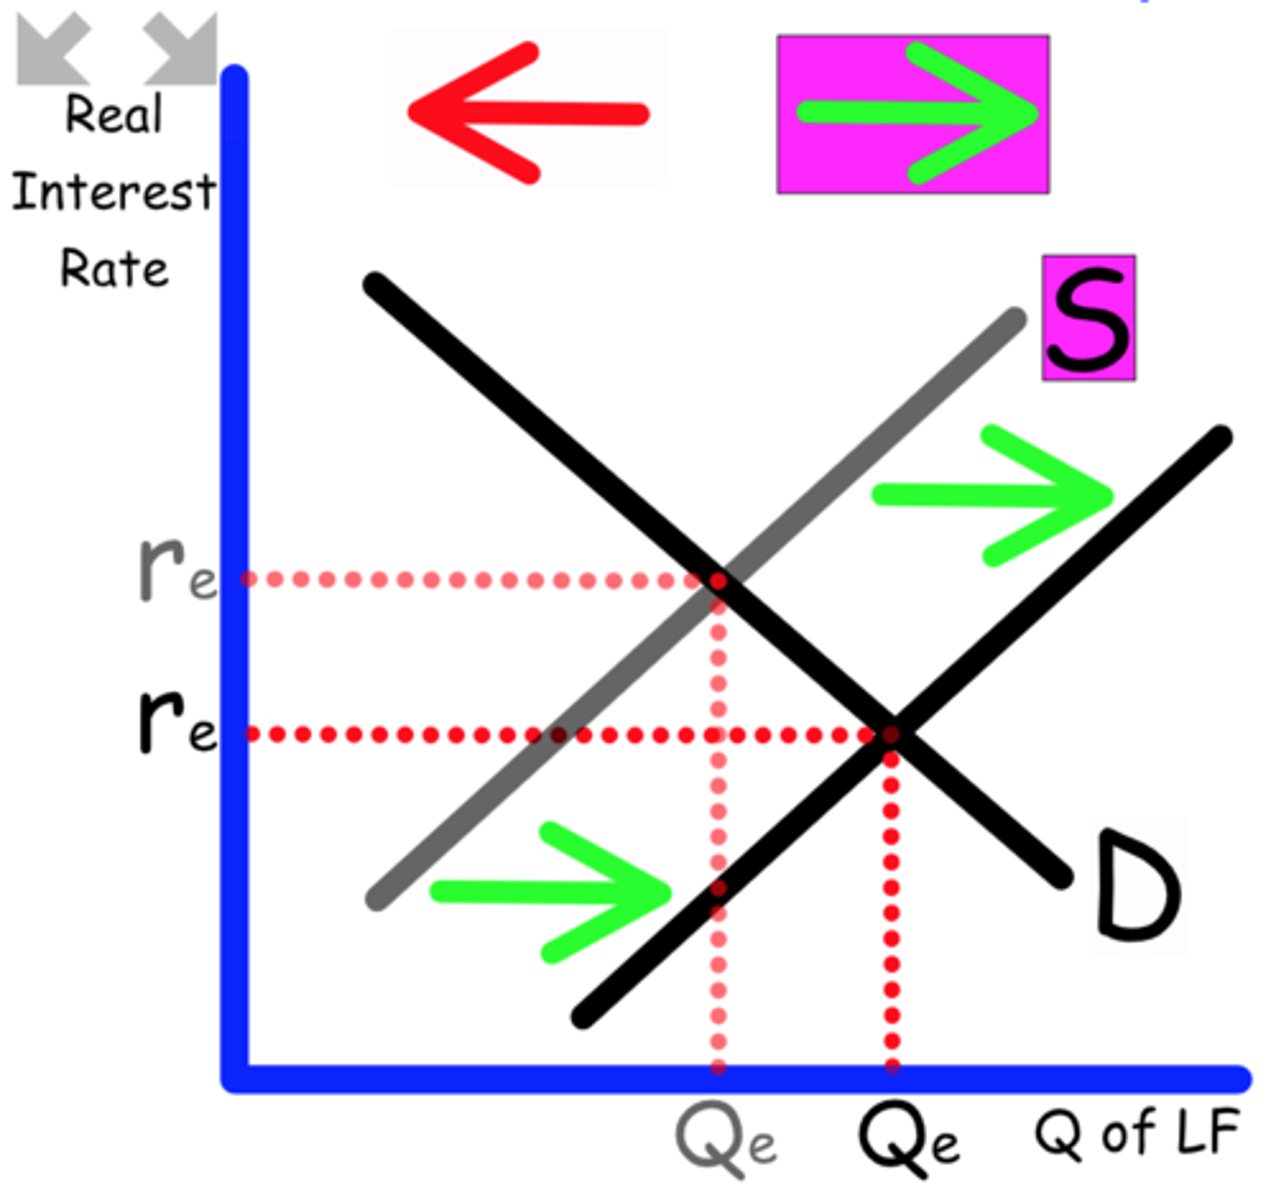
Explain what happens to the Loanable Funds graph when
Technological advancements increase productivity for firms that make investments.
Businesses will invest more
Demand shifts to the right

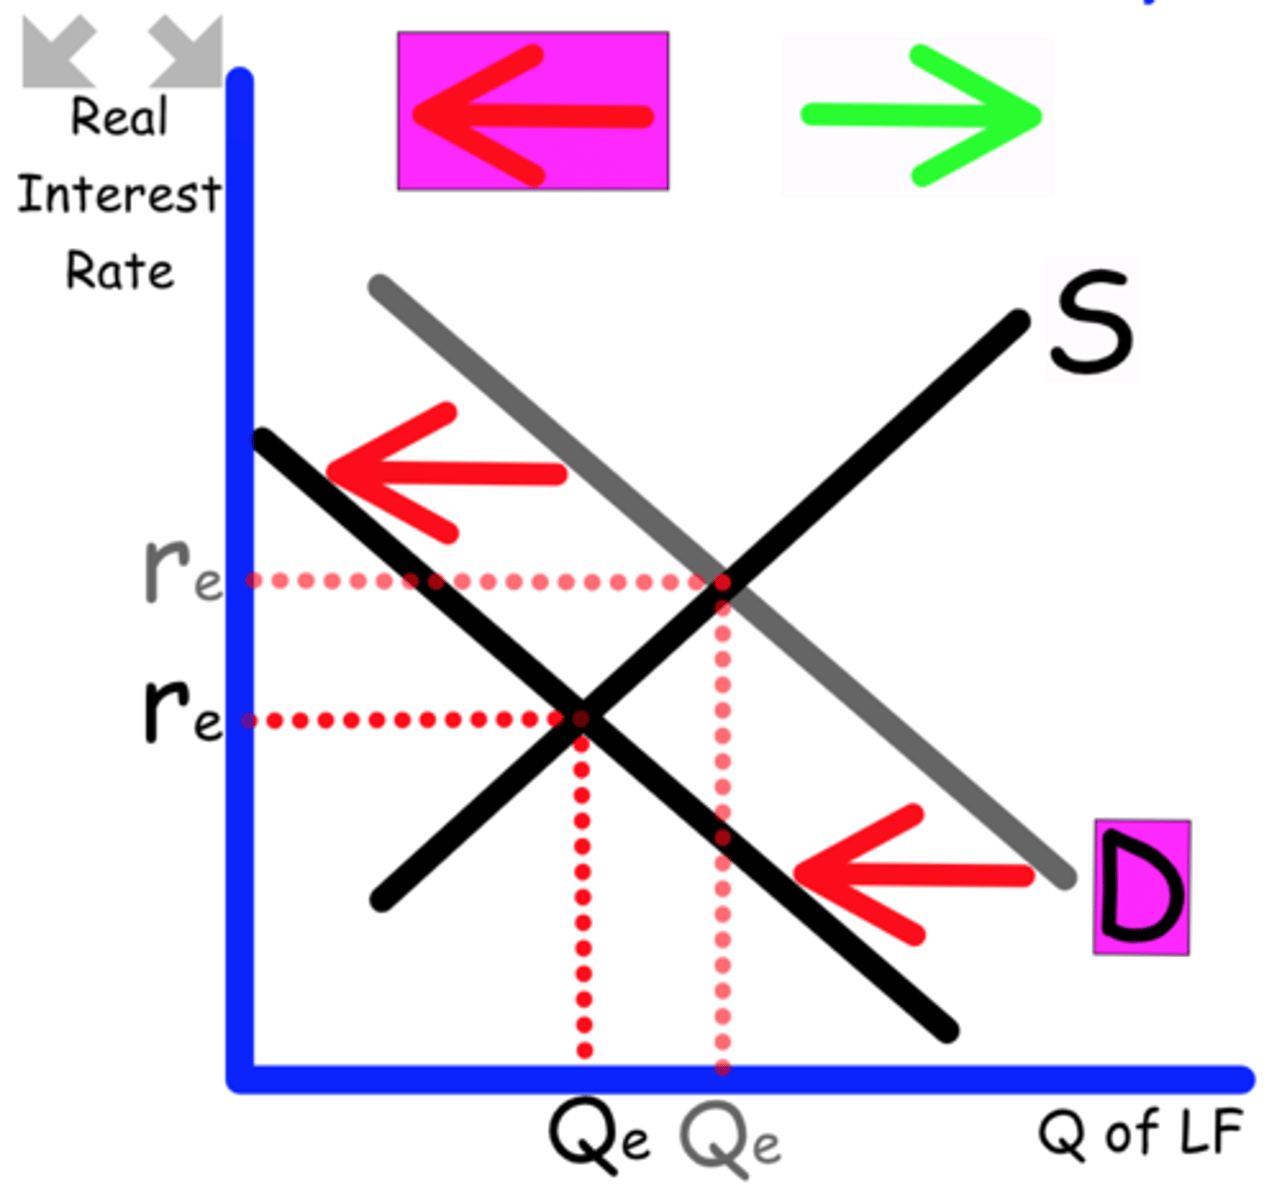
Explain what happens to the Loanable Funds graph when
Businesses expect recession to continue
Businesses invest less
Demand shifts to the left
Explain what happens to the Loanable Funds graph when
The government provides a tax credit for business investing.
Business invest more
Demand shifts to the right
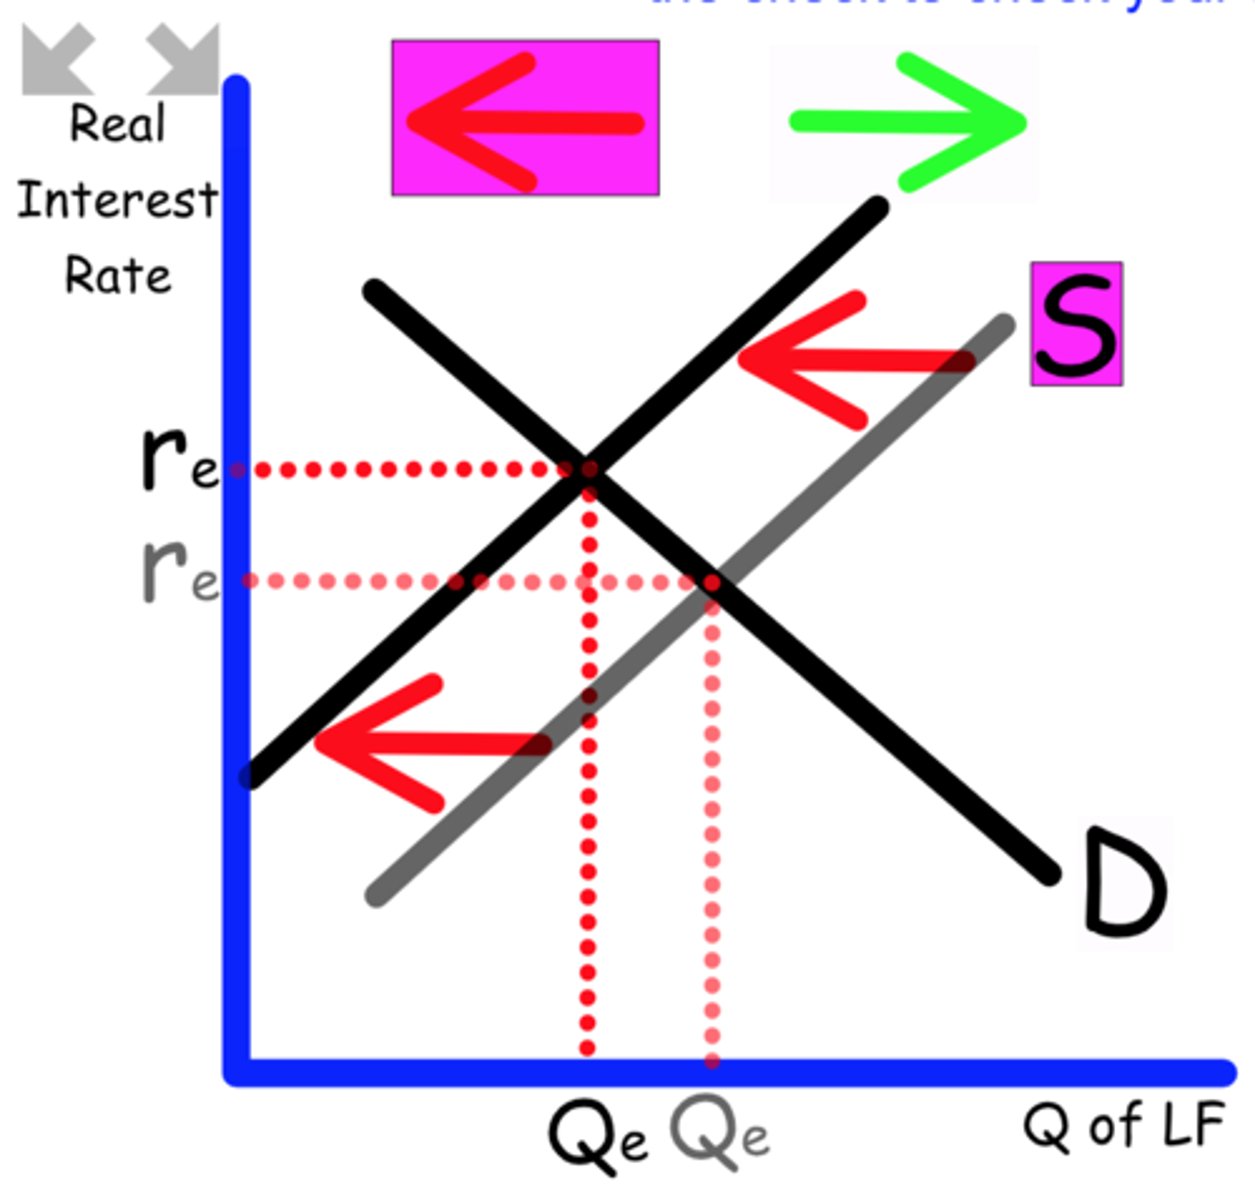
Loanable Funds graph is mainly used to show the impact of deficit spending.
Explain what happens when the government spends a $billion on infrastructure to fix bridges and roads.
This will increase the deficit, removing money from the banks
Supply shifts to the left
Explain what happens to the Loanable Funds graph when
Government cuts spending on social services.
The government is decreasing it's deficit spending leaving more money
Supply shifts to the right

Explain what happens to the Loanable Funds graph when
The government decreases taxes to stimulate the economy.
This will increase the government deficit
Supply shifts to the left

Explain what happens to the Loanable Funds graph when
Interest rates rise in other countries
Money flows out of this country because they can make more in other countries

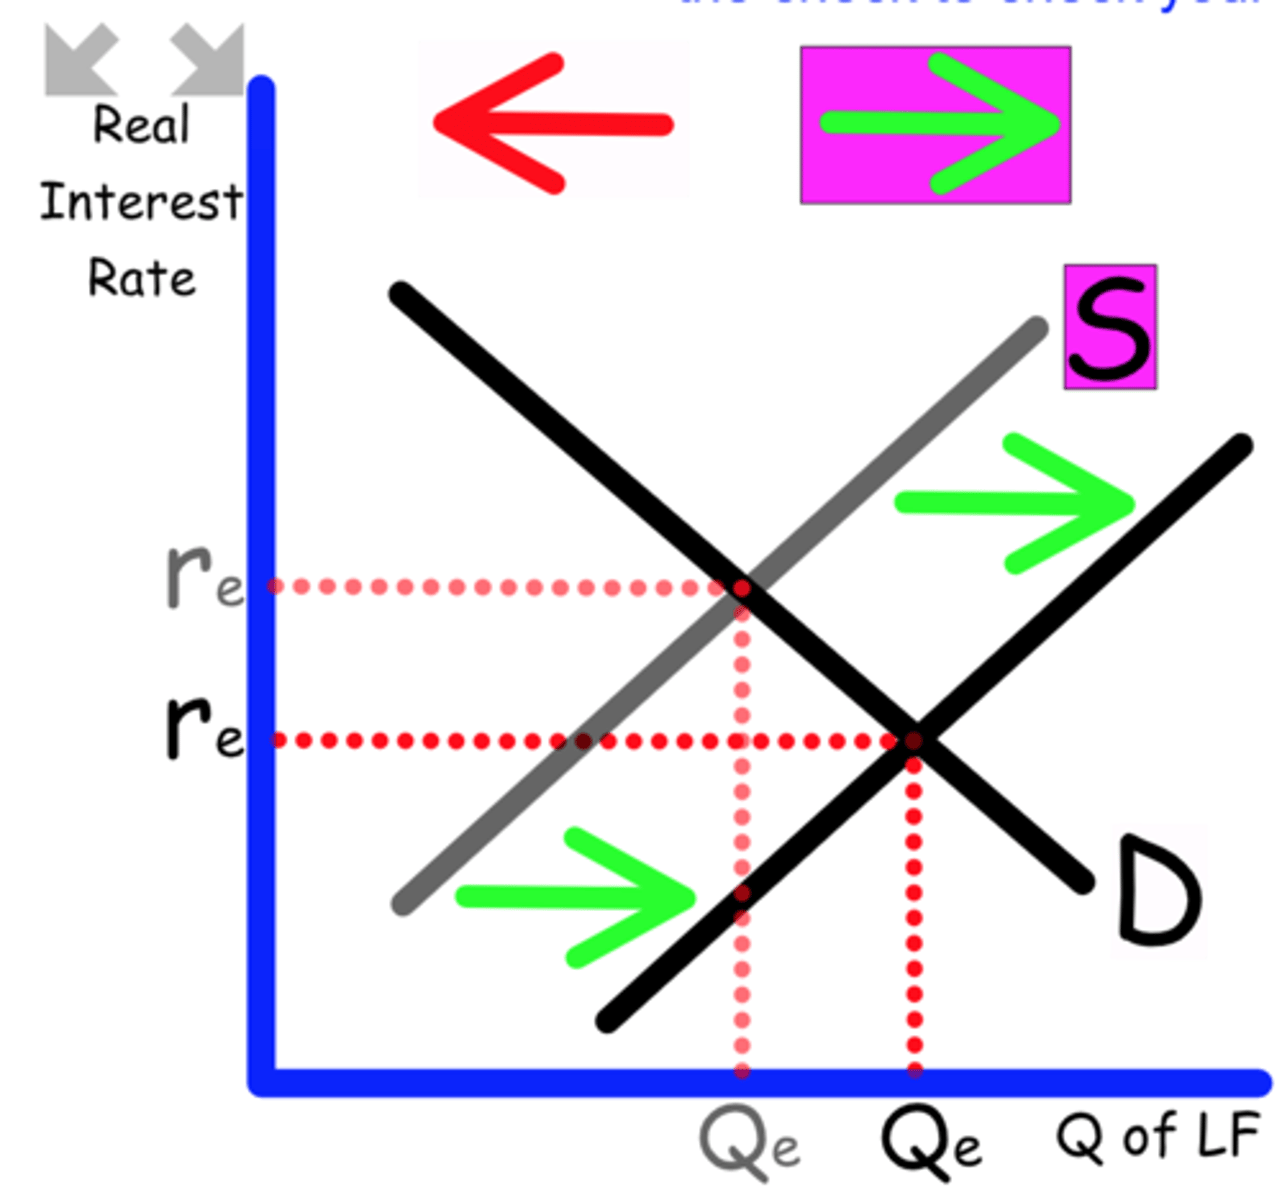
Explain what happens to the Loanable Funds graph when
Political instability in other countries cause more investment in this country.
Foreign countries bring more money into this country
Supply shifts to the right
Explain what happens to the Loanable Funds graph when
American consumers are bullish (positive) about the economy.
They will feel comfortable to spend and save less
Supply shifts to the left

Explain what happens to the Loanable Funds graph when
Disposable income rises
With more disposable income, consumers will more savings.
Supply shifts to the right
Explain what happens to the Loanable Funds graph when
High levels of inflation continue.
Consumers are forced to spend more to buy the same items
Supply shift to the left

Explain what happens to the Loanable Funds graph when
The average propensity to save increases.
Consumers will save more money
Supply shifts to the right

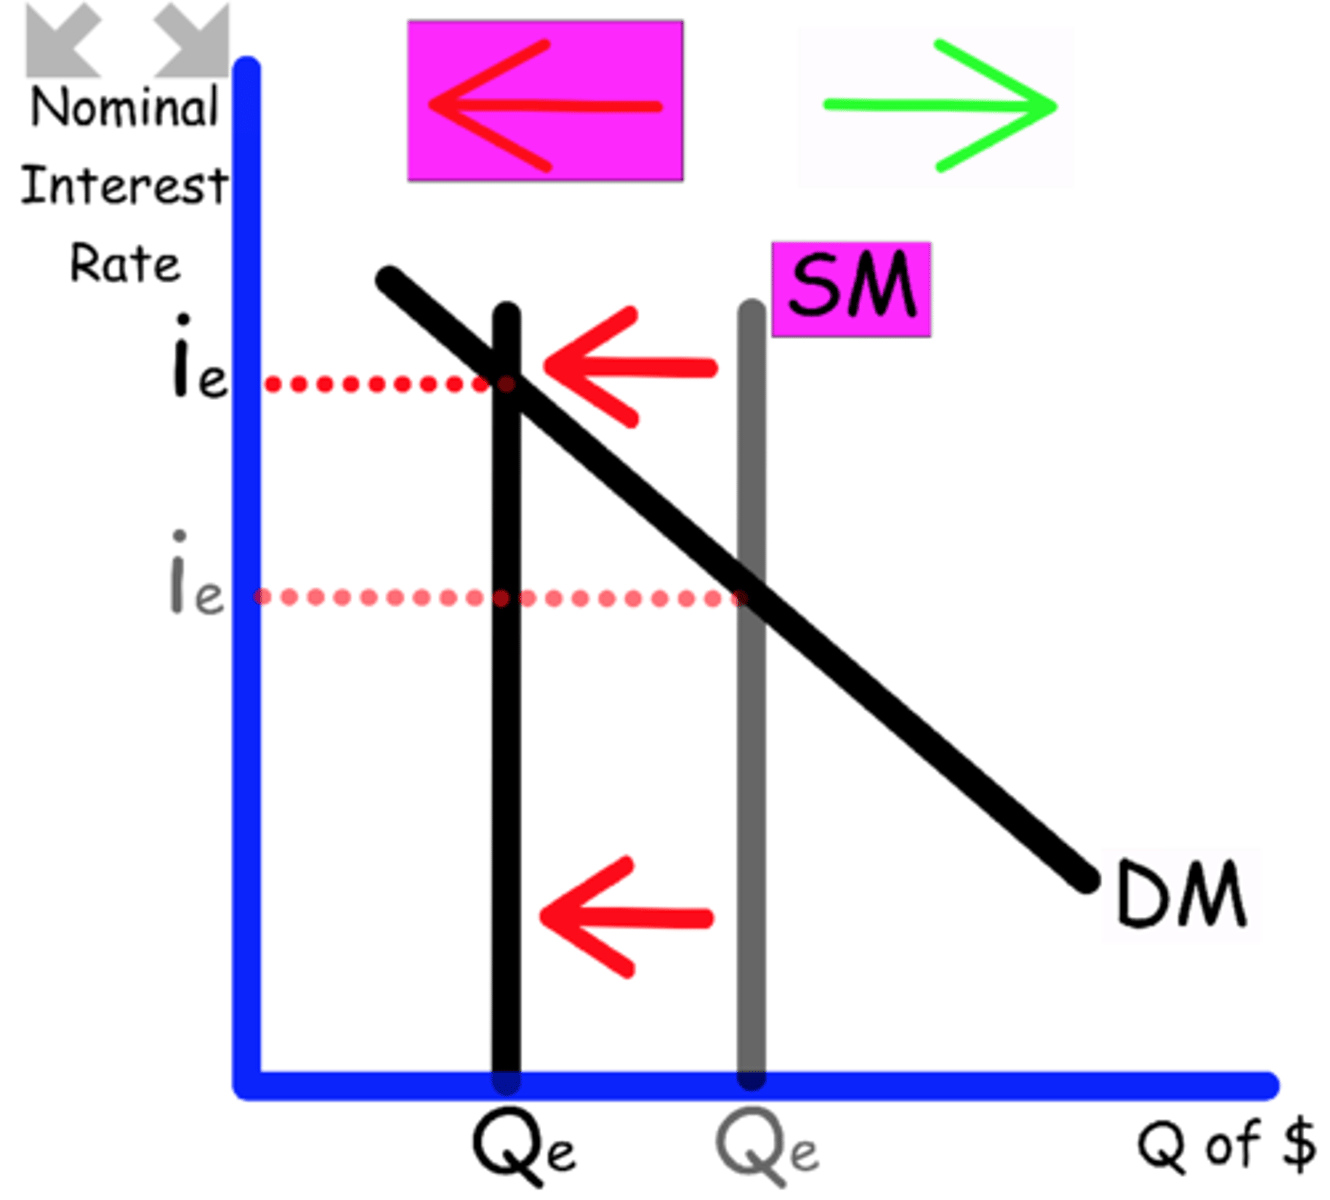
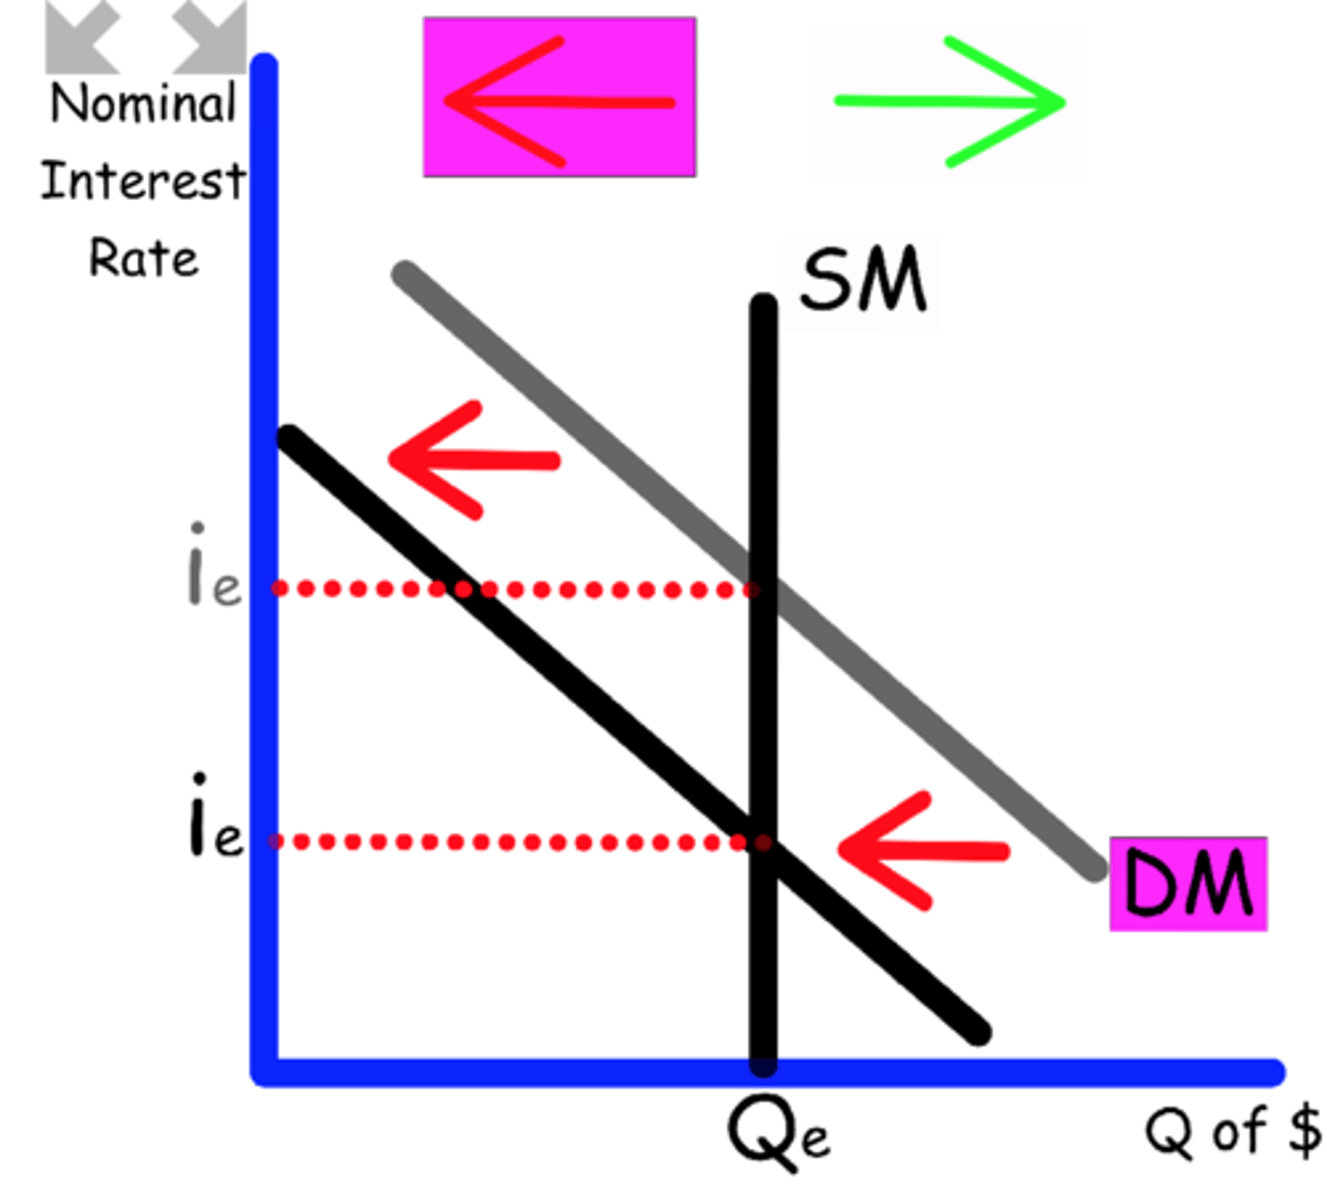
Explain what happens to the Money Market graph when
The Central Bank increases the discount rate.
Money is more expensive, less available
Supply shifts to the left
Explain what happens to the Money Market graph when
The Central bank lowers the discount rate.
Money get cheaper, and is more available
Supply shifts to the right

Explain what happens to the Money Market graph when
The Central Bank uses contractionary policy in the Open Market.
The government buy bonds, removing money
Supply shifts to the left

Explain what happens to the Money Market graph when
The Central Bank lowers the reserve requirement.
Banks have more money available to loan out
Supply shifts to the right
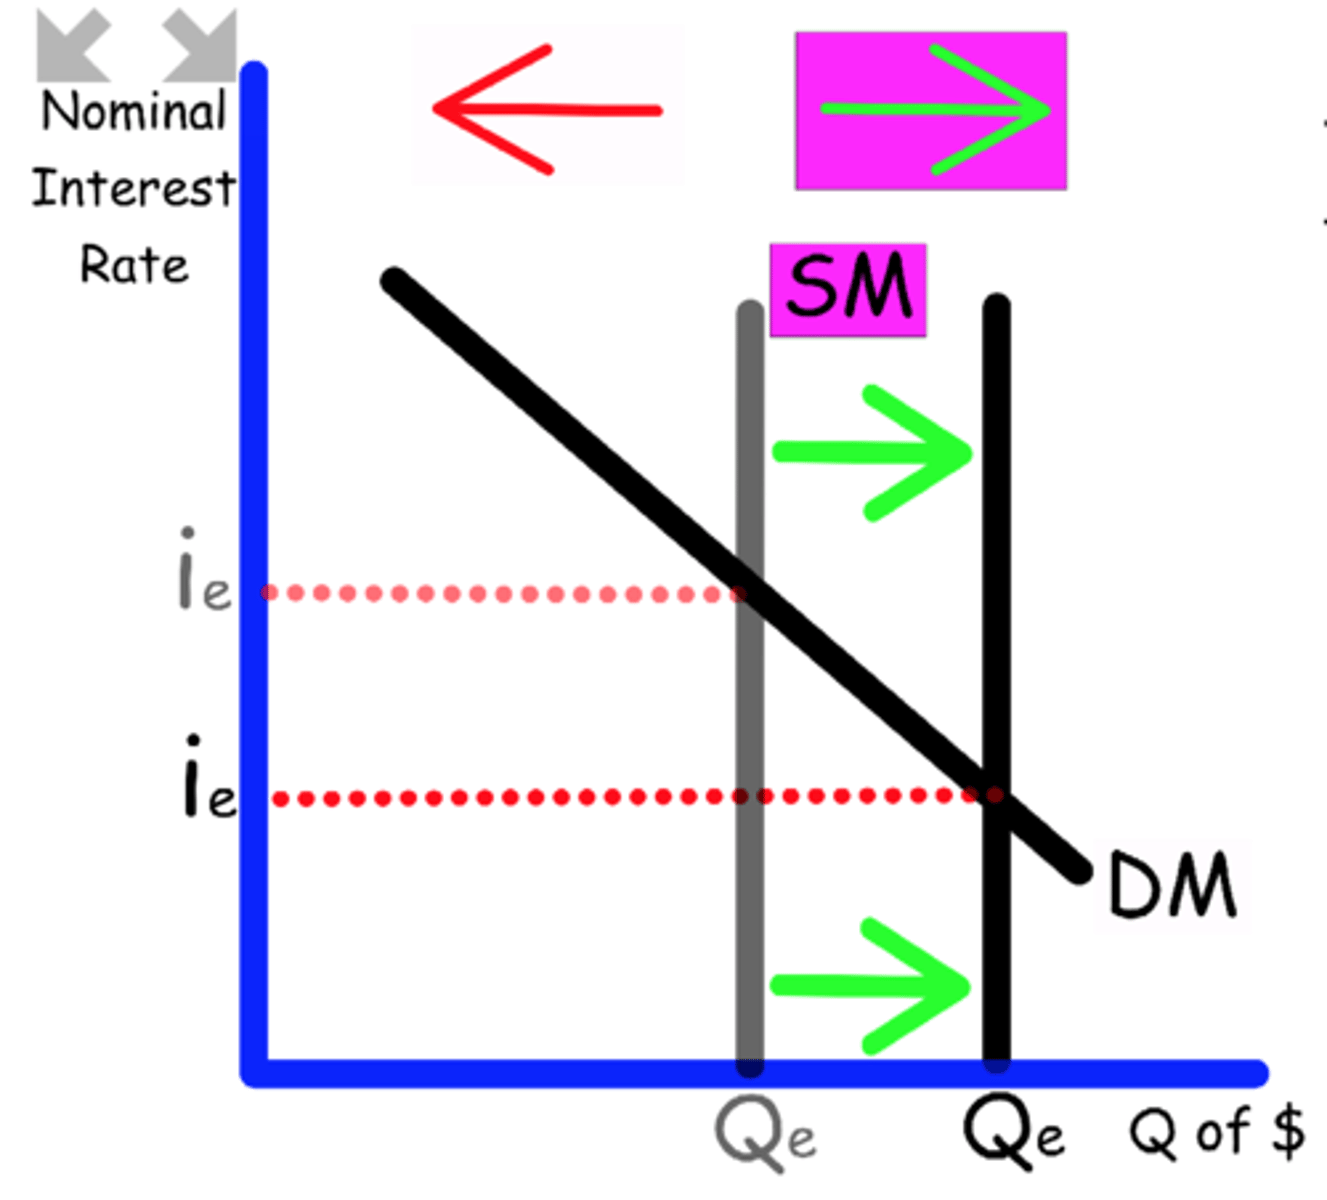
Explain what happens to the Money Market graph when
Central banks buys bonds
Buying bonds adds money to the market
Supply shifts to the right

Explain what happens to the Money Market graph when
The Central Bank raises the reserve requirement.
Banks have less money available to loan out
Supply shifts to the left

Explain what happens to the Money Market graph when
There is an increase in exports.
Exports impact GDP, the money supply
Demand shifts to the right
Explain what happens to the Money Market graph when
Government spending decreases.
Government spending is part of GDP, impacts demand
Demand shifts to the left

Explain what happens to the Money Market graph when
Consumers use their credit cards more since they are easier than cash.
Technology removes the use of money
Demand shifts to the left
Explain what happens to the Money Market graph when
Corporations expect a recession.
Businesses will hold more cash money to prepare for bad times
Demand shifts to the right

Explain what happens to the Money Market graph when
Consumer Spending increases
Consumer Spending is part of the GDP
Demand shifts to the right
