1D: Statistical Reasoning
 Call Kai
 Learn
Learn Practice Test
 Spaced Repetition
 Match
Match Flashcards
1/14

There's no tags or description
Looks like no tags are added yet.
Name | Mastery | Learn | Test | Matching | Spaced | Call with Kai | Chat |
|---|

15 Terms
Measures of central tendency
a set of statistical calculations used to identify a single value that represents the "typical" or "middle" point within a data set (Example: Mean, Median, Mode)
mean
the average of a distribution, obtained by adding the scores and then dividing by the number of scores.
median
The middle score in a distribution after putting them in numerical order. Half the scores are above it, and half are below it. (If there are two middle scores it is the average of both)
mode
the most frequently occurring score(s) in a distribution. (Note, it is possible to have more than one mode)
Measures of Variation
statistics that describe the amount of difference and spread in a data set (Ex. Range & Standard Deviation)
range
The difference between the highest and lowest scores in a data set. It provides a measure of how spread out the values are.
standard deviation
A value that tells you how much the scores VARY from the mean (how spread out they are). Higher standard deviations mean the scores vary more/ are more spread out. Lower standard deviations mean the scores vary less/ are closer together.
percentile rank
The position of a score in a data set relative to the scores of others, expressed as a percentage of scores falling below it. For example, a percentile rank of 70 indicates that the score is higher than 70% of the scores in the data set.
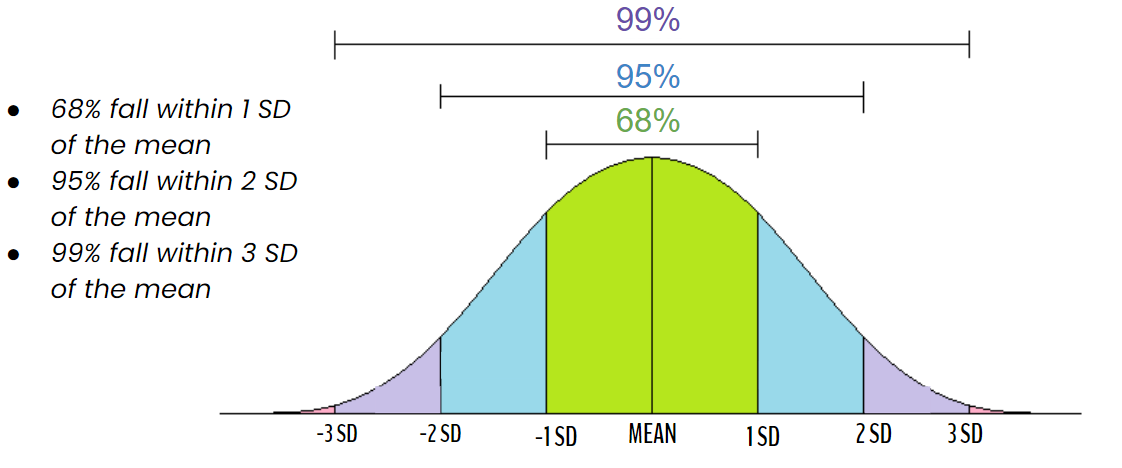
normal curve (aka normal distribution)
a symmetrical, bell-shaped curve that describes the distribution of many types of data; most scores fall near the mean and fewer and fewer near the extremes.
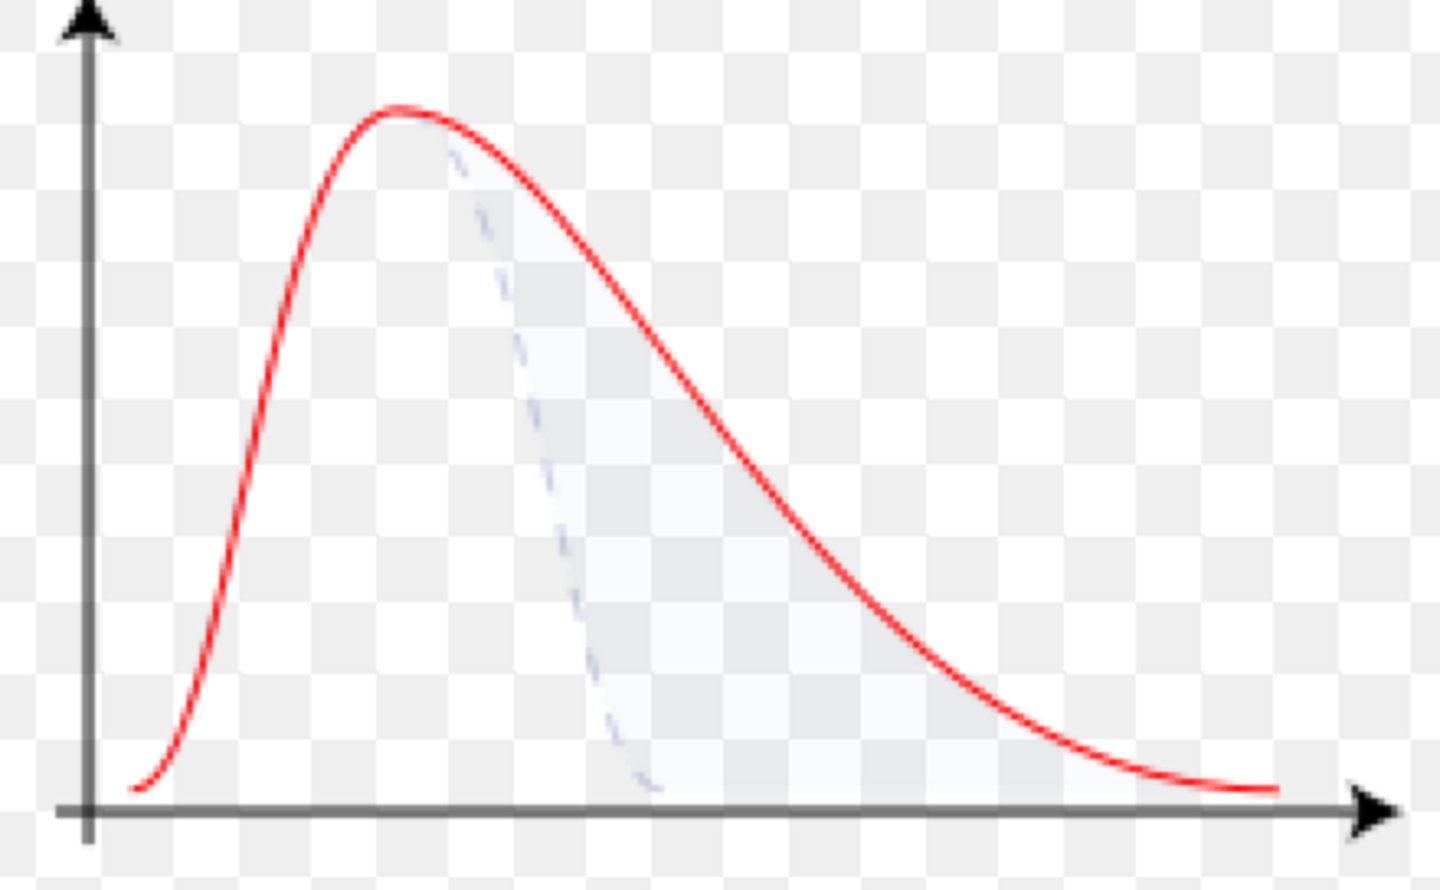
Positively skewed distribution
A distribution where most data points are lower in value, but a few high values (including possible outliers) pull the mean upward, resulting in a longer tail on the right side of the distribution.
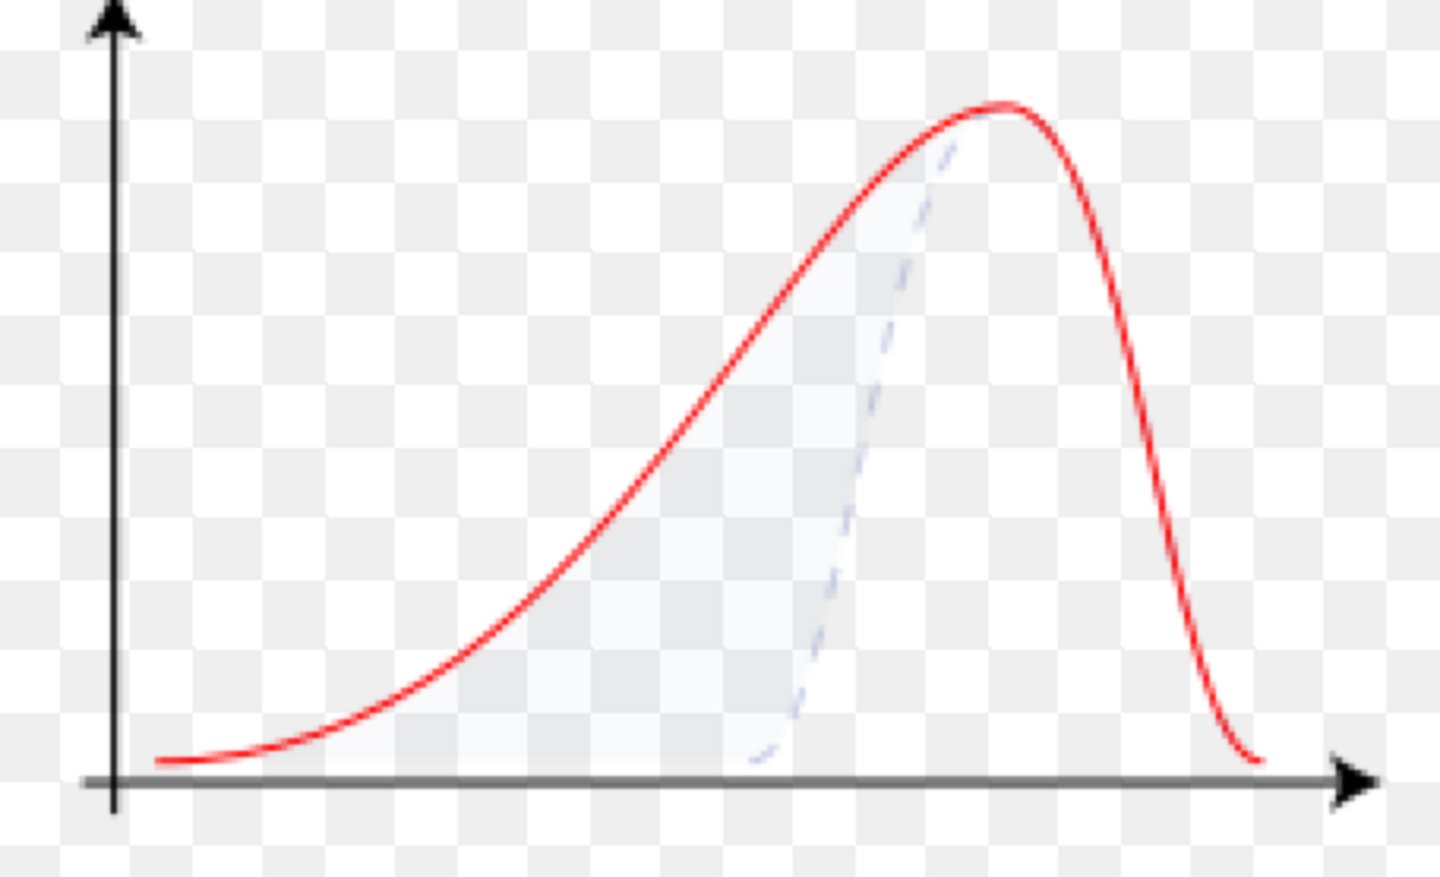
negatively skewed distribution
A distribution where most data points are higher in value, but a few low values (including possible outliers) pull the mean downward, resulting in a longer tail on the left side of the distribution.
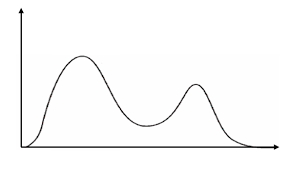
bimodal distribution
a statistical distribution with two distinct peaks, or modes, in the data
statistical significance
a statistical statement of how likely it is that an obtained result occurred by chance. (If the results are statistically significant, they were NOT due to chance)
Effect Size
Shows “how much” (small, medium, large) a variable influences/correlates with the other. (In an experiment, how much the IV impacts the DV; in a correlation the strength of the relationship).
regression toward the mean
A statistical phenomenon where exceptionally high or low measurements tend to be followed by measurements closer to the average, rather than remaining extreme. This occurs because extreme values are often the result of random variation, and as such, subsequent measurements are more likely to fall within the typical range.