Paired Samples and Blocks
1/14
There's no tags or description
Looks like no tags are added yet.
Name | Mastery | Learn | Test | Matching | Spaced | Call with Kai |
|---|
No analytics yet
Send a link to your students to track their progress
15 Terms
Paired data
Observations that violates independent groups assumption and arises in a # of ways (most common is to compare subjects with themselves before & after a treatment)
Blocking
type of pairing when pairs arise from an experiment
Matching
Type of pairing when pair arise from an observational study
Since Pythagorean Theorem of Statistics cannot be used for paired data (b/c Independent Groups assumptions is violated)..
find difference between the groups and treat it as its own set of data.
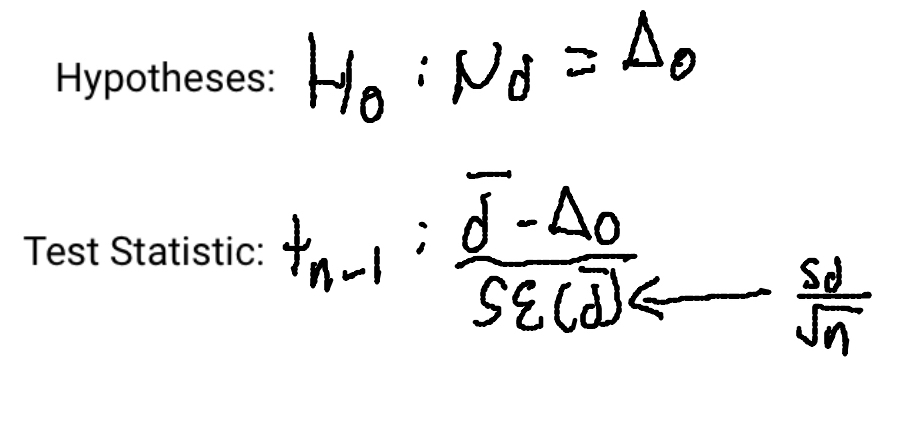
Paired t-test
Hypothesis test used for paired data; mechanically is just a one-sample t-test for the means of pairwise differences (sample size= # of pairs)
Assumptions and Conditions (paired data)
Paired data condition
Independence Assumption (each difference must be independent)
Randomization Condition
10% Condition
Normal Population Assumption (population of Differences follows a normal model don’t need to check individual groups)
Nearly Normal Condition (check with differences data)
Paired Data Condition
Data must be paired (samples cannot be independent from each other)
Paired t-test
When conditions are met, we’re ready to test whether the mean of paired differences is significantly different than 0; if H0 is true we can model the sampling distribution of this statistic with a Student’s t mode with n-1 degrees of freedom and use that model to obtain a P-value
PHANTOMS (Paired Data)
P: “ I want to know if (difference in μ) is significant” (state μ’s)
H: H0: μ(d)=0 HA: μ(d) doesnt equal 0
A: show histogram of differences and state that data is paired
N: “Because all conditions are satisfied I’ll use Student’s t with a n-1 degrees of freedom and perform a paired t-test at a% significance level”
T: Use calculator
O: Use Calculator
M: Low P-value (below a%) = reject H0, High P-value (above a%) = fail to reject H0
S: I do/dont have enough evidence to say there’s a μ(d)”
CI for matched pairs
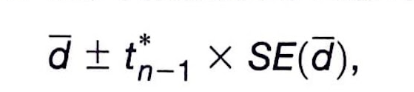
same steps as a one-sample t-interval (because the difference is the only set of data used); When conditions are met, we’re ready to find a CI for mean of paired difference.
PANIC (paired data)
P: “I want to estimate mean difference of __ b/w (group 1) and (group 2)” (state μ(d)!)
A: same as paired t-test
N: “Since all conditions are satisfied, I can use Student’s t with n-1 degrees of freedom
I: state given, then place in formulas (use calculator)
C: “Im C% confident that (group 1) is on average (lower bound in context) to (upper bound in context) more (all positive)/ less (all negative) than (group 2)
Effect Size and CI
A CI is a good way to get a sense for the size of the effect we’re trying to understand. It gives use a plausible range of values for the true mean difference. So even though we were unable to discern a real difference, the confidence interval shows that the effect we’re considering may be big enough to be important.
Pairing
Isolates extra variation and allows us to focus on individual differences
Paired Design
example of blocking and a good choice when designing a study if you can pair subjects based on something that’s likely to have an effect on a response variable
What can go wrong?
Dont use 2-sample test with paired data
Dont use a paired t-method when samples arent paired
Look out for outliers
Dont look for differences b/w means of paired groups with side by side boxplots or histograms