Data Analysis
1/43
Earn XP
Description and Tags
Data analysis summarised in ONE FLASHCARD!!!
Name | Mastery | Learn | Test | Matching | Spaced |
|---|
No study sessions yet.
44 Terms
Data vs. Information
Data: facts and figures: facts that are useless on themselves.
Information: produced when data is manipulated into meaningful/useful forms.
Qualitative v. Quantitative Data
Quantitative data is numbers-based, countable, or measurable; collected through observations and experiments.
Qualitative (why, what, how) data is interpretation/opinion-based, descriptive, and relating to language; collected through interviews, surveys, etc.
Primary v. Secondary Data
Primary Data: data that are collected from the field under the control /supervision of the investigator.
Collected from: interviews, questionnaires, surveys, etc.
Secondary Data: data gathered/recorded by second party, i.e. someone else.
Collected from: data from a book, etc.
Open-ended Questions
Questions that don’t limit the answers that can be given by the respondent, generates qualitative data. E.g., What do you want to do when you grow up?
Closed Questions
Questions that limit responses by the answerer generate quantitative data. E.g., What is your name?
Referencing Primary Sources
Includes interviews, questionnaires, and observations.
Name of respondent, date/time, place of interview, etc., will need to be carefully recorded for appropriate referencing.
Examples of Referencing
Footnotes—referencing listed at the bottom of page (where citation is made).
APA (American Phychological Association) - a style guide with academic writing such as essays and books.
Permission
MUST BE SOUGHT for collecting data due to laws. E.g., Australian Privacy Principles.
One method is consent forms.
Consent Forms: Components
Title, name of researchers
Purpose, reason of project to be undertaken
Requirements from participants e.g., time, cost, resources
Rights and interests of participants
Statement of whether the participant’s identity will be preserved.
Quality of Data/Information
Data Integrity - refers to quality of data
Factors that affects the quality of data:
Reference - how well is data/info connected to/appropriate to the matter in question.
Accuracy - how well do the data represent the objective truth.
Bias - may be intentional/not. Mostly based on factors such as culture, religion, etc. Note that people tend to support things they prefer.
Reliability - if all conditions above are ok - it is reliable.
Data types and structure
Data type: a set of data with predefined characteristics.
Common data types:
Text (String)
Numeric (Integer, Floating Point)
Date, Characters
Boolean - true (1) or false (0) evaluation
Common data structures:
Array
Record
File
Physical and software security controls
Encryption, Backups
Username, passwords
Firewall, malware protection
Whitelisting (allow) /blacklisting (block)
Australian Private Principles
Australian Privacy Principle 2 — Anonymity and Pseudonymity:
Individuals can choose to use fake names or stay anonymous so they aren’t identified. If their data or calls are used for training, their identity must be hidden.Australian Privacy Principle 6 — Use or Disclosure of Personal Information:
Personal info must only be used for the purpose it was collected for. Using it for anything else needs the individual’s consent. No sneaky sharing!Australian Privacy Principle 11 — Security of Personal Information:
Hold personal info like a vault—protect it from misuse, loss, or unauthorized access. When it’s no longer needed, destroy or anonymize it properly.
Ethical Dilemmas
Ethical - accepted moral standards that guide behaviour.
Ethical Dilemma - situations which only allow unethical/unacceptable outcomes.
Data Visualisation
The process by which large amounts of data are taken and processed → effective graphical representations that meet the needs of clients, such as graphs, charts, etc.
Purpose: educating, informing, persuading, etc. Making reading data more interesting, understandable, and less time-consuming (allowing data to be compared when glanced at) and effective (precise).
Types of Data Visualisation
Charts/Graphs;
Flowcharts/Diagrams;
Images;
Hierarchy charts;
Animations;
Maps/Timelines/Infographics.
Infographics
Shows data/information using different elements, which include:
Graphs, pictures, diagrams, narratives, timelines.
Complete story of data—more engaging than traditional ways of data.
Steps to create a data visualisation
Investigation;
Interpret Primary Data;
Mockup design;
Create (include citations and references!);
Formats/Conventions;
Validations.
Design Principles of Data Visualisation
Functional requirements: What the visualisation should do.
→ Usability (easiness to use) & accessibility (navigation, error tolerance).
Non-Functional Requirements: how the visualisation appears rather than what it does.
This includes:
Alignments of objects/text
Repetition of visual elements
Contrast of colour/tone
Space around/between objects/texts/images
Balance of visual appeal, harmonions.
Constraints/Scope of a solution
Constraints: Factors that limit/restrict the visualisation, such as economic, technological, social, legal, and usability constraints.
Scope of a solution: Work that must be done to complete solution.
Design tools
Functionality: IPO (Input-Process-Output)*/Flowcharts.
*a way of how people process information.
Annotated Diagrams
Mockups: hand-drawn representations of page/screen with detailed formatting information, i.e., prototype/demo model.
Designing an interface for a solution. Includes object, colours, and annotations when required (sometimes name of object).
Formats and Conventions
Formats: The way something looks—like font type, size, color, and layout.
Conventions: The usual rules or habits for using those formats—like putting titles in bold, using headings, or keeping shapes consistent.
Software Functions
Extracting data: using built-in functions, e.g., web query (Excel) and/or query (Access).
Validation of data:
Manual - data entered are checked for accuracy by person rather than machine, such as proofreading.
Electronic (machine) - ensure accuracy of data, built-in software functions e.g., range/existence/data type checking.
Evaluating data visualisations
Does the the solution meet the information needs of the client?
Relates to the initial solution, quantifiable/measurable criteria, effectiveness/efficiency, e.g., time/cost saved.
Evaluation Report - involves stating if the solution meets the information need(s) of the user.
Database and its components
A database is a structured collection of data, stored manually (e.g., telephone book) or electronically (e.g., library records).
A DBMS (Database Management System) is software that manages databases.
Key Components:
File: A group of related data stored together.
Record: A single entry containing multiple fields (e.g., a student's details).
Field: A specific data point within a record (e.g., "Name," "Age").
Character: The smallest unit of data, including letters, numbers, and symbols.
Library Comparison between components
File: The entire library holding many books (tables).
Table: A book full of pages (records).
Record: A page with lots of sentences (fields).
Field: A sentence — a single piece of info inside the page.
Character: A letter — smallest building block of info.
Form: The reading glasses or librarian’s desk — a tool to interact with the data, not part of the data itself.
📚 Format is how the books are displayed — shelves, sections, labels, catalog cards, or digital entries. It’s the presentation.
📖 Convention is the rules they follow — like alphabetical order by author, using Dewey Decimal, or putting the author's name before the title. It’s the system everyone agrees on.
Data Dictionary
A comprehensive description of each field in a database used to plan storage of software elements, e.g., variables, data structures, objects, etc.
Should list all variable names and data type/structure. May include data’s purpose, size, description, formatting, and validation.
Table/Form
Table: displays data using columns (fields) and rows (records);
Field: a specific piece of data;
Forms: displays data for every field of a single record (basically a specific SINGLE ROW OF DATA).
Queries
The ability to select a set of specific data based on a series of criteria.
Querying - selecting specific data based on criterias.
Reports
The final information gained after processing the list returned from a query into a useful form.
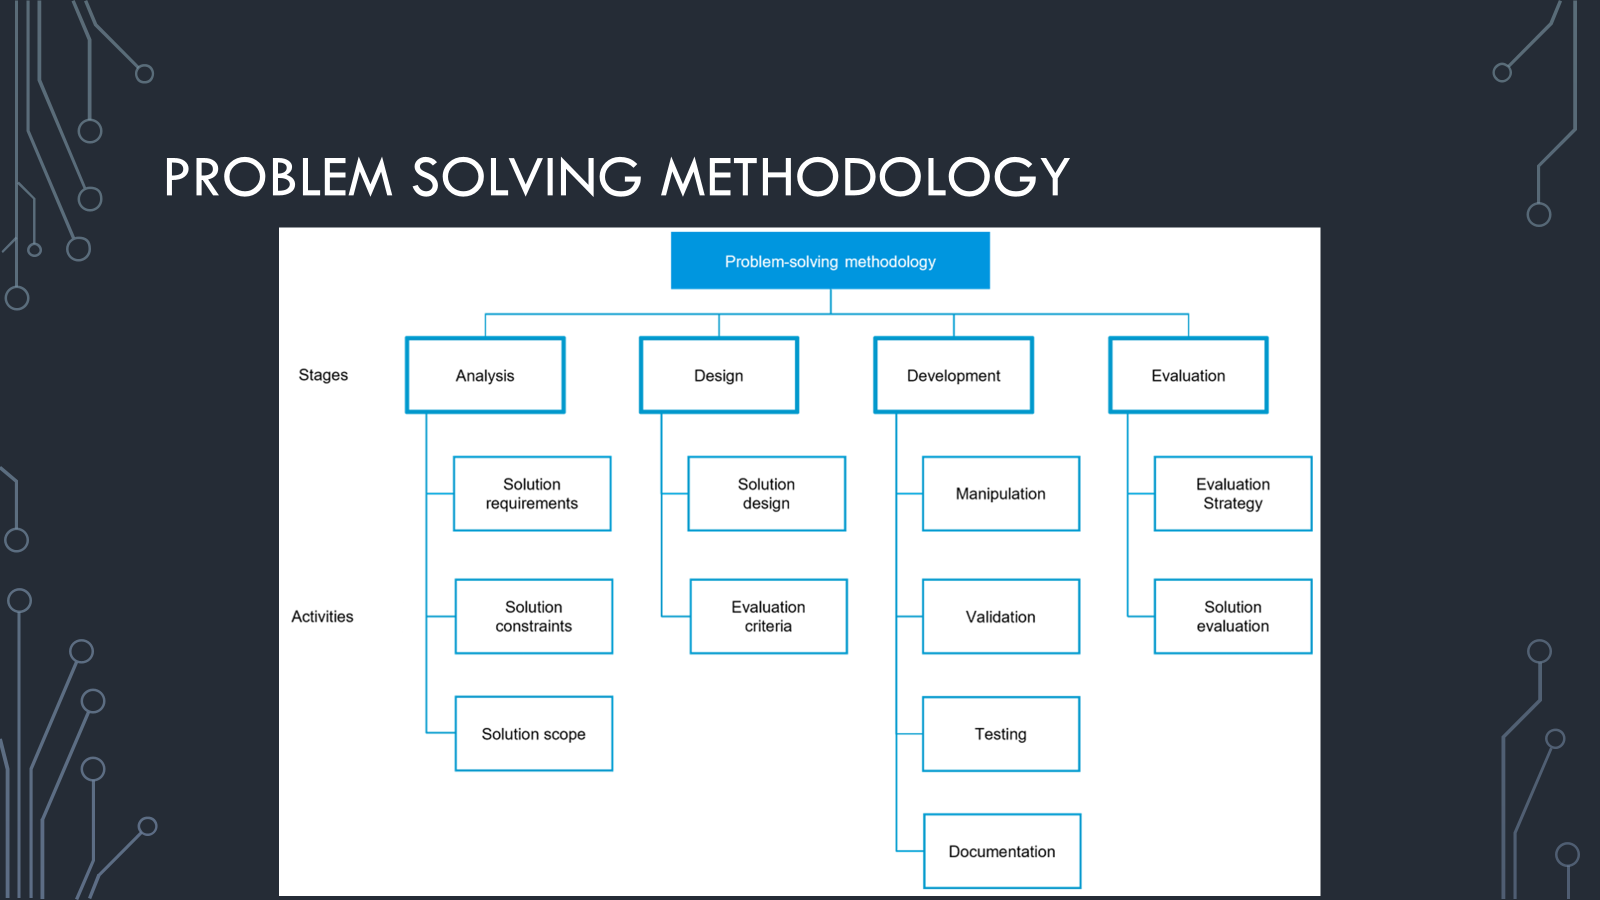
Problem Solving Methadology
SQL
Structured Query Language—a declarative language used for querying and updating tables in a relational database. Also can be used to create tables.
Basic Syntax for Extracting Data
Select - list of fields to be displayed;
From - list the table(s) data will come from;
Where - list of search criteria;
Order By - list the fields that the results are to be sorted on. By default, ascending order;
And - filter records based on more than one condition being true;
Or - filter records when any conditions are true.
Note: AND and OR functions are to be used ONLY in WHERE syntax exists.
Spreadsheets
Software tools that essentially perform calculations and create basic charts.
Best suited when working with smaller amounts of data, performing quick calculations, and simple sorting and analysis.
Their true power is in the ability to perform complex mathematical functions. These are:
Arithmetic operations (+, -, /, *)
Statistical or other mathematical functions (max, min, average, median, SD)
If (), Lookup(), etc.
Spreadsheet Terminology
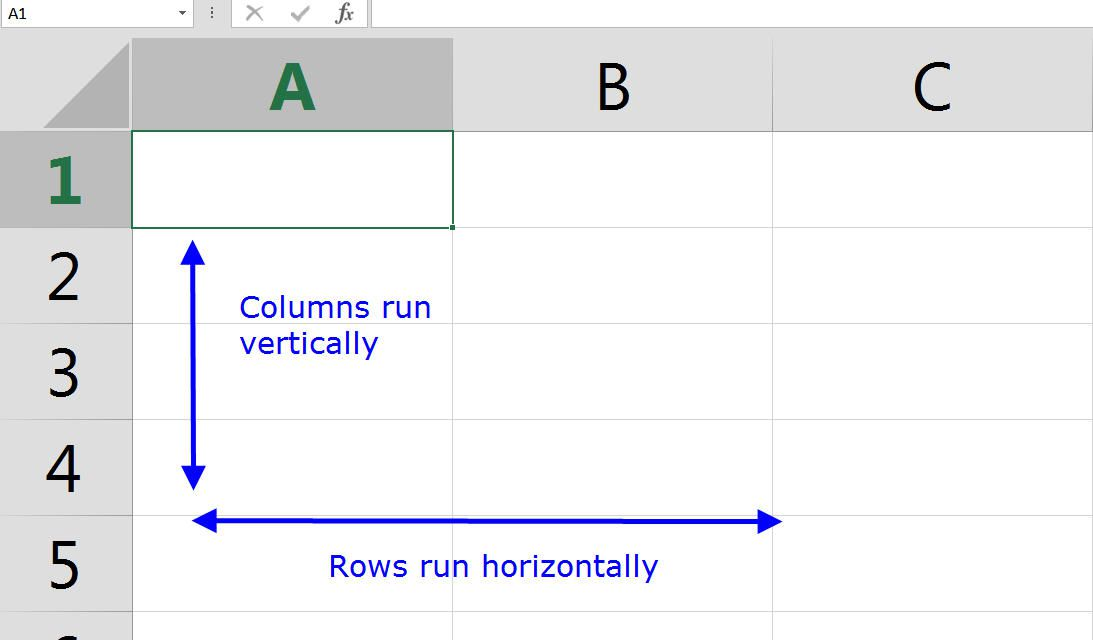
Cell: A single unit in a spreadsheet to store data.
Columns and Rows: Vertical and horizontal arrangements forming a spreadsheet grid structure.
Formulas: Mathematical expressions for calculations within spreadsheet cells.
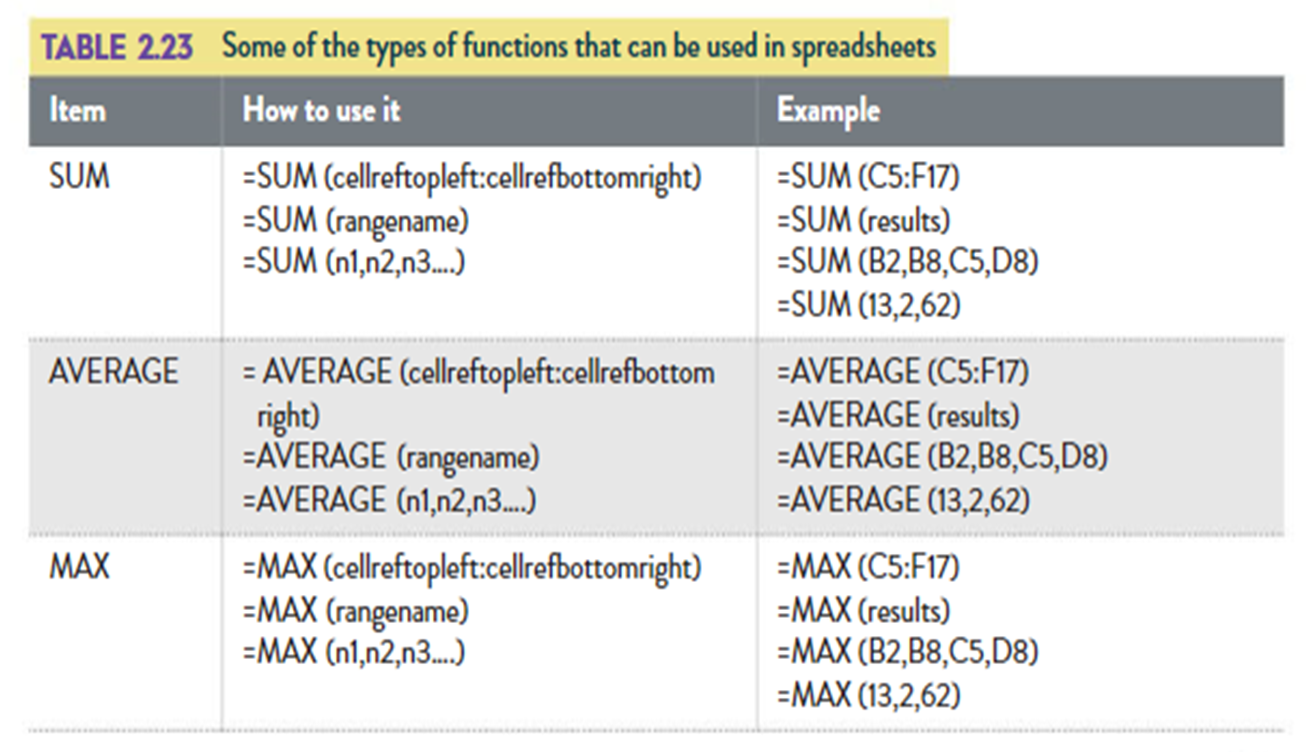
Functions (table 2.23): Predefined formulas for specific tasks, like SUM or AVERAGE.
Relative Referencing: Cell references adjust relative to their new position.
Absolute Referencing: Fixed cell references remain constant when copied or moved
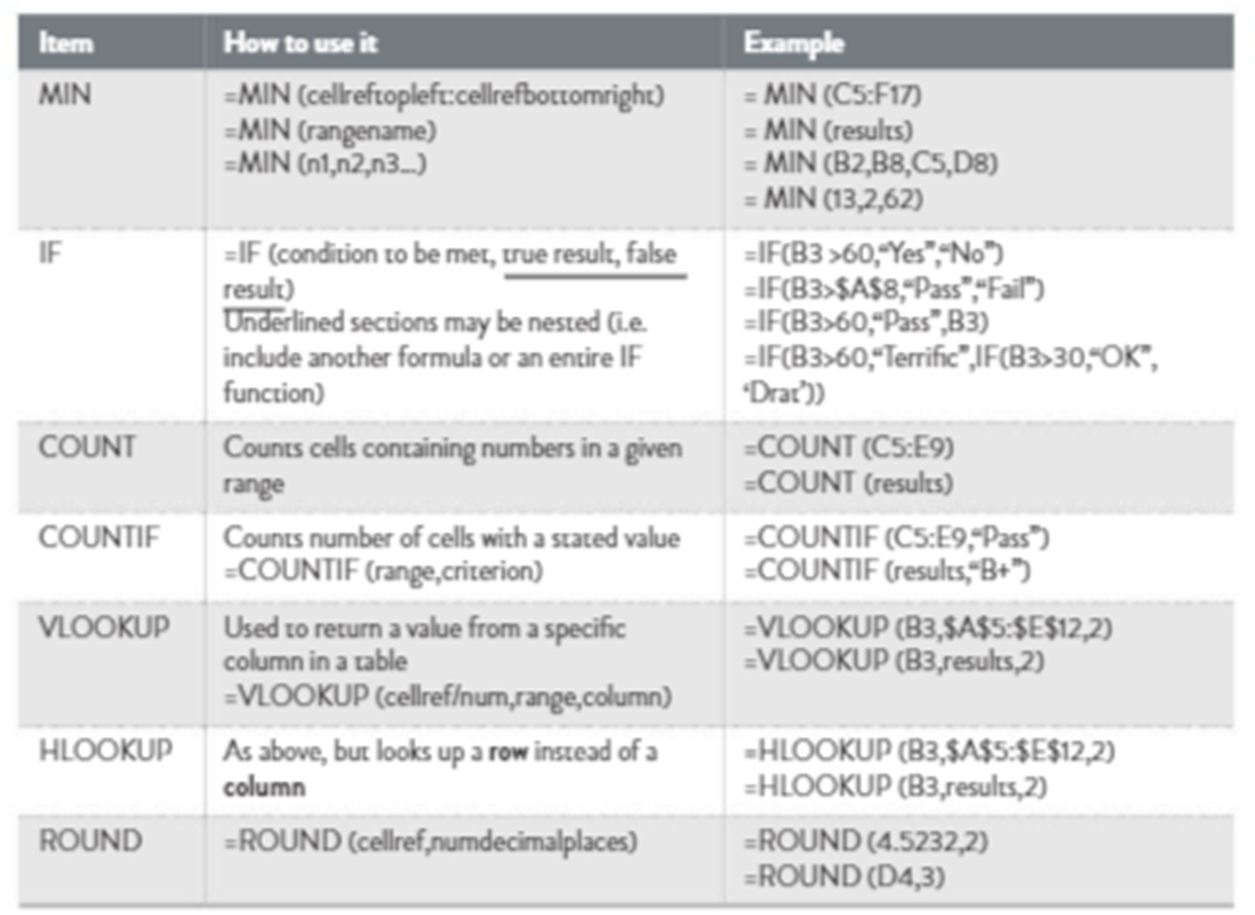
Functions that can be used in spreadsheets
Hungarian Style Naming Convention
Labels - lbl
Textbox - txt
Buttons - btn
Option Buttons - opt
Check Box - chk
Combo Boxes - combo
Relationships in MS Access
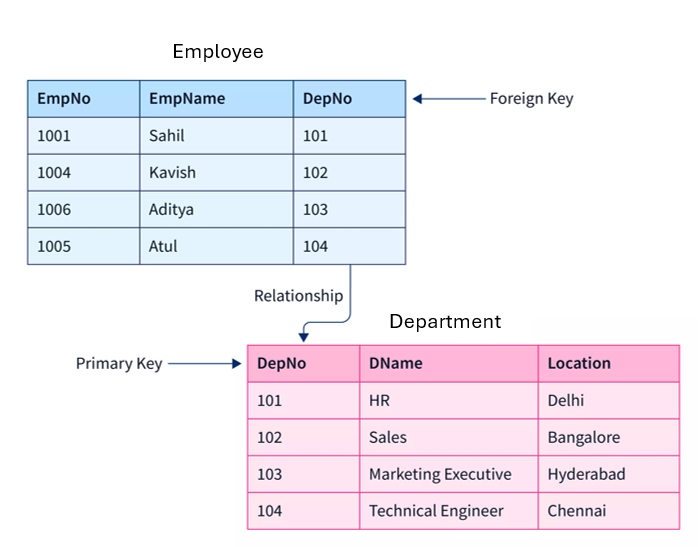
A relationship connects two table using a common field (key).
Ensures data integrity and eliminates redundancy.
Types of relationships includes one-to-one, one-to-many (common), many-to-many (junction table).
Preparing for Relationships
Identify common fields (e.g., StudentID in both Students and Enrollments).
Ensure tables have primary keys.
A foreign key is a primary key used in another table to establish a relationship.
Close all open tables to prevent errors.
Steps to create relationship
Go to Database Tools > Relationships.
In Show Table, select and Add tables.
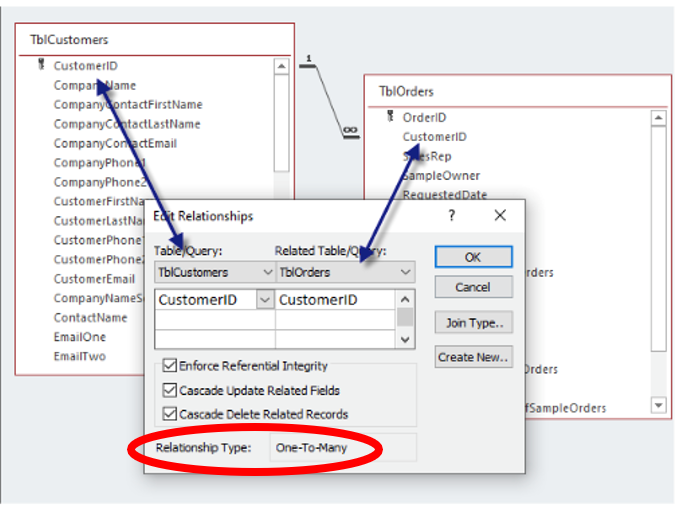
Drag the common field between tables.
In Edit Relationships, verify relationship type.
Check Enforce Referential Integrity to prevent orphan records.
Click Create to establish the relationship.
Referential Integrity
Maintaining valid relationships – Preventing orphan records.
Restricting deletions – A parent record cannot be deleted if child records exist.
Ensuring data consistency – Keeping data accurate across related tables.
Relationships Types
One-to-One:
Each record in Table A has one matching record in Table B.
E.g. Vehicle to RegistrationOne-to-Many:
A record in Table A can have multiple related records in Table B.
E.g. Customer to OrdersMany-to-Many:
Requires a junction table to link records from both tables.
Edit/Deleting Relationships
To Edit a Relationship:
Open the "Relationships" window.
Double-click on the relationship line.
Modify settings as needed.
To Delete a Relationship:
Select the relationship line.
Press "Delete" to remove it.
SQL JOIN Example - Relational Database
Definition: Relationships allow querying multiple tables using JOIN in SQL to retrieve related data.
Example: Matching customers with their orders using
CustomerID.SQL Query:
SELECT Customers.CustomerID, Customers.Name, Orders.OrderIDFROM Customers
INNER JOIN Orders ON Customers.CustomerID = Orders.CustomerID;