The market forces of supply and demand
1/18
There's no tags or description
Looks like no tags are added yet.
Name | Mastery | Learn | Test | Matching | Spaced |
|---|
No study sessions yet.
19 Terms
Market
A group of buyers and sellers of a particular good or service
The buyers: determine the demand for the product
The sellers: determine the supply of the product
Competitive market
Many buyers and sellers, each has a negligible impact on market price
Perfectly competitive market
The goods are all exactly the same
Price takers: so many buyers and sellers that no one can affect the market price
At the market price, buyers can buy all they want, and sellers can sell all they want
Demand
Quantity demanded: the amount of a good that buyers are willing and able to purchase
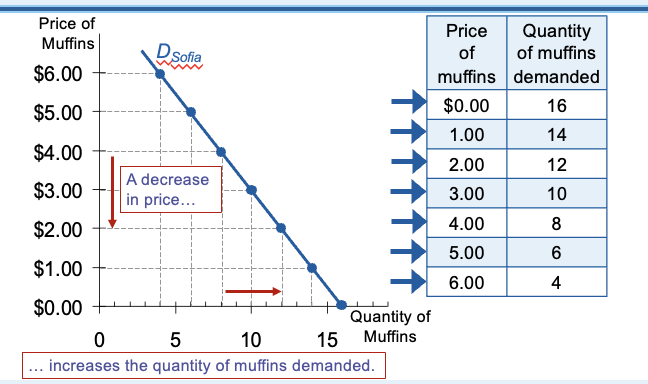
Law of demand: other things being equal, the quantity demanded of a good falls when the price of the good rises; the quanity demanded of a good rises when the price of the good falls
Demand schedule
A table that shows the relationship between the price of a good and the quanity demanded
Demand curve
A graph of the relationship between the price of a good and the quanity demanded
D schedule and D curve
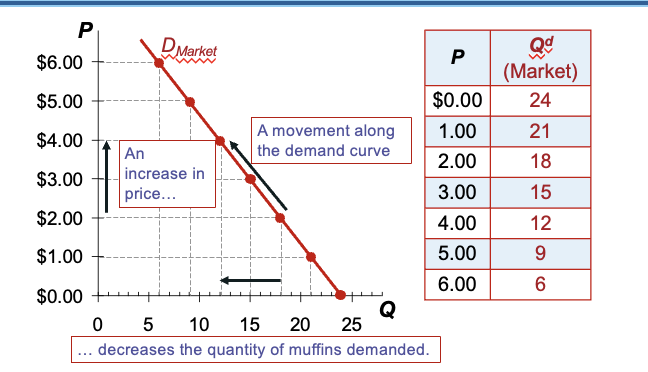
Market demand
The sum of all individual demands for a good or service
Market demand curve
Sum the individual demand curve horizontally
To find the total quantity demanded at any price, we add the individual quantities demanded (on the horizontal axis)
Market demand curve for muffins
Shifts in the demand curve
The demand curve shows how price affects quantity demanded, other things being equal
These “other things: are non-price determinants of demand
Things that determine buyers’ demand for a good, other than the good’s price
Changes in them shift the D curve
Shifts in the demand curve (determinants)
Number of buyers
Income
Prices of related goods
Tastes
Expectations
Changes in number of buyers
Increase in the number of buyers
Increases the quantity demanded at each price
Shifts the demand curve to the right
Decrease in the number of buyers
Decreases the quantity demanded at each price
Shifts the demand curve to the left
Changes in income
Normal goods, other things being equal
An increase in income leads to an increase in demand
Shifts the demand curve to the right
Inferior good, other things being equal
An increase in income leads to a decrease in demand
Shifts the demand curve to the left
Changes in prices of related goods (Substitutes)
Two goods are substitutes if
An increase in the price of one leads to an increase in the demand for the other
Example: An increase in the price of pizza increases demand for hamburgers, shifting the hamburger demand curve to the right
Changes in prices of related goods (complements)
Two goods are complements if
An increase in the price of one leads to a decrease in the demand for the other
Example: If the price of a smartphone rises, people buy fewer smartphones; app demand curve shifts to the left
Changes in tastes
Advertising convinces consumers that drinking 3 glasseses of orange juice a day will help lower cholesterol; demand for oramge juice increases
Expectations about the future
People expect an increase in income - the current demand increases
People expect higher prices - the current demand increases
Shift vs. Movement along curve
Change in demand