Statistics Quiz #1
1/82
There's no tags or description
Looks like no tags are added yet.
Name | Mastery | Learn | Test | Matching | Spaced | Call with Kai |
|---|
No analytics yet
Send a link to your students to track their progress
83 Terms
Type II error
we agree with null, when it is in fact false.
theorietical construct
thing you are taking measurement of (ex. age, gender, opinion).
scales of measurement
distinguishing between different types of variables.
ordinal scales
order different possibilities.
Variability
how spread our is the data, how far away from the median or mean are the values.
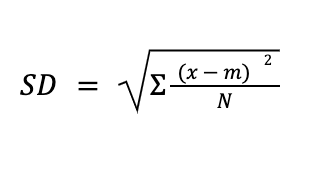
standard deviation
the square root of the variance
platykurtic data set
too flat.
mesokurtic data set
pointiness is just about perfect.
leptokurtic data set
too point
z-score
(raw score-mean)/standard deviation
boxplots
provide visual depiction of the median, the interquartile range and range of data.
inferential statistics
uses measurements from the sample of subjects in the experiment to compare treatment groups and make generalizations about large populations.
probability theory
how often different kinds of events will happen.
probability
how often something is too happen.
frequentist view
defines probability as a long-run frequency, objective, and unambiguous.
Bayesian view
subjectivist view, allows you to assign probabilities to an event you want, but we cannot be be purely objective.
Law of Probability
if we add up all the probabilites of the events, they sum to 1.
binomial distribution
The probability distribution of a binomial random variable, discrete.
normal distribution
bell curve distribution, use two parameters 1. mean of distribution 2. standard dev. of the distribution, continuous.
t distribution
arises in situations where you think that the data actually follow a normal distribution but you do not know the mean or the standard dev.
x squared deviation
seen in categorical data analysis.
sampling theory
specifies assumptions upon which your statistical inferences rely.
population
set of all possible people.
sampling method
relationship between two depends on the procedure by which the sample was selected.
stratified sampling
population is or can be divided into several different sub-populations.
snowball sampling
sampling from a "hidden" or hard to access population, gets data in situations that might be challenging otherwise.
convienence sampling
Samples are are chosen in a way that is convenient to the research and not randomly selected from the population of interest.
population parameters
characteristics of the entire population.
sample statistics
properties of my data set.
sampling distribution of the mean
replicating an experiment over and over again.
sampling distribtution of the maximum
keeping track of highest (max) number in each set of data taken.
Central Limit Theorem
tells us if the pop. distribution has mean μ and standard dev σ, then the sampling distribution of the mean also has mean μ and the standard error of the mean is SEM = σ/ square root N
σ
population standard deviation
σ (hat)
estimate of population standard deviation
s^2
sample variance
σ^2
population variance
σ hat^2
estimate of population variance.
hypothesis testing
researcher has theory about the world and wants to determine whether or not the data actually support that theory.
research hypotheses
fundamentally about psychological constructs,
statistical hypotheses
must be mathematically precise, and correspond to specific claims about the characteritiscs of the data generating mechanism.
type I error
reject null, when it is true.
critical region
corresponds to those values of X that would lead us to reject null hypothesis
effect size
how big the difference between the true population parameters and the parameter values that are assumed by null.
x^2 (chi-squared) goodness of fit test
use when you have a table of observed frequencies of different categories, and the null hypothesis gives you a set of "known" probabilities to compare them to.
x^2 (chi-square) test of independence
used when you have a contingency table of two categorical variables. the bull is that there is no relationship or association between variables.
Measurement
data collection.
self report
fast, cheap, easy, only works if people understand the question.
operationalism
taking meaningful but vague concept and turn it into a precise measurement.
measure
method or tool used to make observations.
nominal scale
categories, no particular realtionship between the different possibilities.
interval scales
difference between variables, number does not have a natural zero.
ratio scale
difference between two numbers gathered for data (ex. ryan took 2.1 sec to respond, and Carl took 3.1 seconds to respond
--> 3.1-2.1= 1.
continuous variable
between any two values, it is possible to a have another number in between.
discrete variable
no possible number in the middle. set value.
Likert Scale
choose between several options (strongly agree, strongly disagree...)
Reliability
consistency of measurement
validity
how accurate the measure is
internal validity
extent to which you are able to draw the correct conclusions about the relationship between two variables.
external validity
extent you see the same pattern of results in real life, that you saw in your study.
construct validity
if you are measuring what you want to measure.
confounder variable
additional, often unmeasured variable, that turns out to be related to both predictors and outcome.
descriptive statistics
summarizing data in compact, easily understood fashion.
central tendency
average or middle of where your data lies.
mean
average.
N
number of numbers.
median
middle value.
mode
most frequently occurring.
frequency table
A table that uses numbers to record data.
range
biggest value - smallest value
interquartile range
difference between the 25th percentile and 75th percentile is taken.
Variance
standard deviation squared
histogram
bars touching, interested in shape of distribution.
F distribution
compare two x squared distributions together.
μ / Mpop
population mean
μ w a hat
estimated population mean
x̄ / M
sample mean
σ / SDpop
Population Standard Deviation
σ w a hat
estimated population standard deviation
S / SD
Sample Standard Deviation
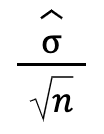
S x̄ / SEM / SE
Standard Error
SD formula
CI formula
M + SE (times a critical value)
SE formula