2.1 The determinants of the demand for goods and services
1/11
There's no tags or description
Looks like no tags are added yet.
Name | Mastery | Learn | Test | Matching | Spaced |
|---|
No study sessions yet.
12 Terms
Demand
the quantity of a good or service that consumers are able and willing to buy at a given price during a given period of time
Demand varies with prices
generally, the lower the price, the more affordable the good and so consumer demand increases. This can be illustrated with the demand curve
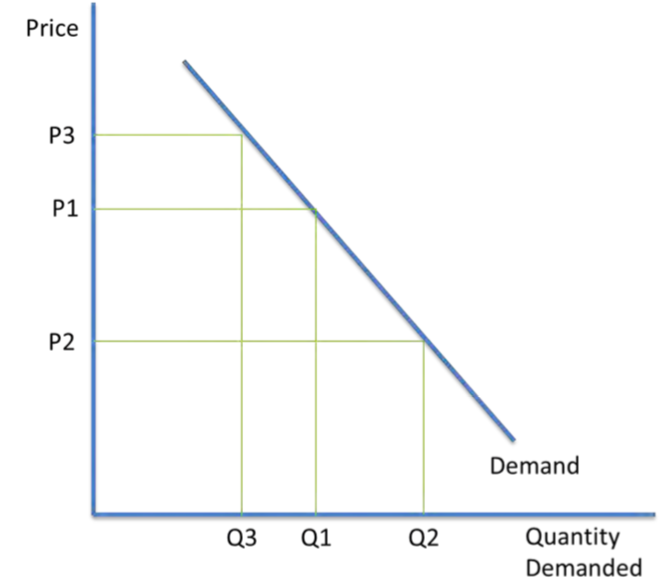
movements along the demand curve
-At price p1, a quantity Q1 is demanded. At the lower price of p2, a larger quantity of Q2 is demanded. This is an expansion of demand. At the higher price of p3, a lower quantity of Q3 is demanded. This is a contraction of demand. Only changes in price will cause these movements along the demand curve.
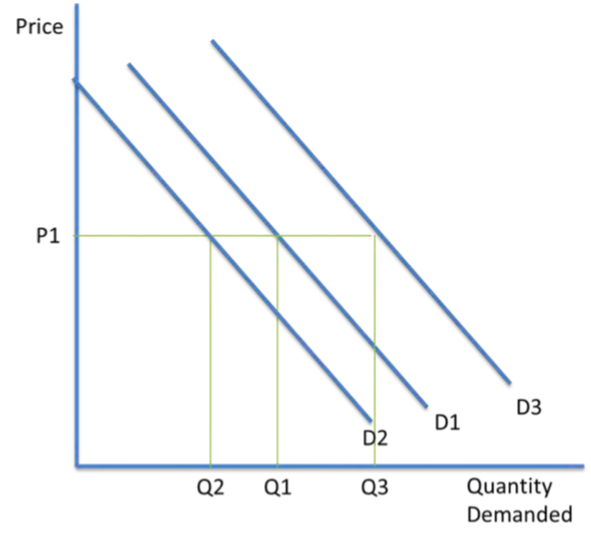
Shifting the demand curve
price changes do not shift demand curve. A shift from D1 to D2 is an inward shift in demand, so a lower quantity of goods is demanded at the market price p1. A shift from D1 to D3 is an outward shift in demand. More goods are demanded at the market price of p1.
Population
The larger the population, the higher the demand. Changing the structure of the population also affects demand, such as the distribution of different age groups.
income
if consumers have more disposable income, they are able to afford more goods, so demand increases. Also, a consumer’s wealth affects their demand. consumers generally spend more as they perceive their wealth to increase. Likewise, consumers spend less when they believe their wealth will decrease.
Related Goods
Related goods are classified as substitutes or complements. Substitutes can replace each other, meaning if the price of one substitute falls, demand for the original good decreases as consumers opt for the cheaper substitute. Complements are goods that are consumed together; if the price of one good (e.g., strawberries) increases, the demand for its complement (e.g., cream) decreases as fewer consumers buy the first good.
Advertising
This will increase consumer loyalty to the good and increase demand.
Tastes and fashions
The demand curve will also shift if consumer taste changes. For e.g, the demand for physical books might fall, if consumers start preferring to read e-books.
Expectations
This is of future price changes. If speculators expect the price of shares in a company to increase in the future, demand is likely to increase in the present.
seasons
demand changes according to the season. For e.g in the summer the demand for sun lotion and ice cream increases.
Diminishing Marginal utility
The demand curve is downward sloping, indicating the inverse relationship between price and quantity. According to the law of diminishing marginal utility, as more units of a good are consumed, the benefit (marginal utility) from each additional unit decreases, leading consumers to pay less. For example, the first chocolate bar provides high satisfaction, so consumers are willing to pay more; subsequent bars offer less satisfaction, resulting in lower willingness to pay.