Beam limitation and filtration pt 3 ( filtration part)
0.0(0)
Card Sorting
1/34
There's no tags or description
Looks like no tags are added yet.
Last updated 8:15 PM on 10/28/25
Name | Mastery | Learn | Test | Matching | Spaced | Call with Kai |
|---|
No analytics yet
Send a link to your students to track their progress
35 Terms
1
New cards
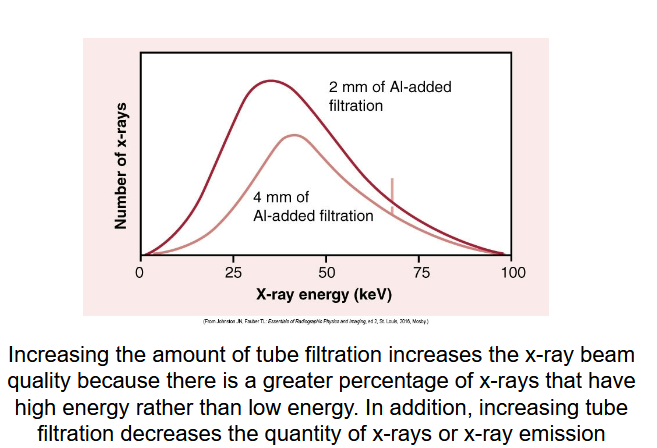
Beam filtration graphical representation of our beam THis graph shows less filtration of 2mm means more photons when the 4mm of filtration less photons
When the curve is more on the right compared to the other curve more right means higher average energy of beam harder beam and higher quality beam
2
New cards
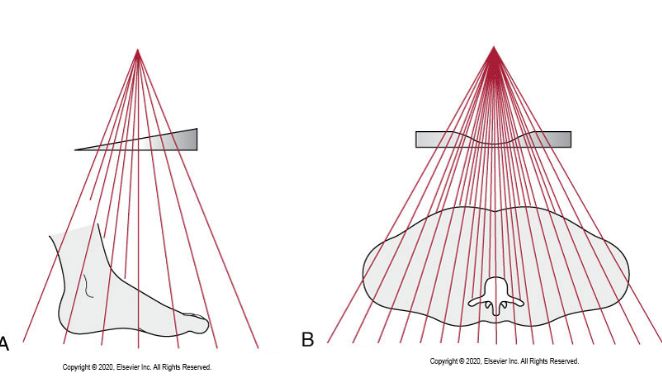
Example of compensating filtration
3
New cards
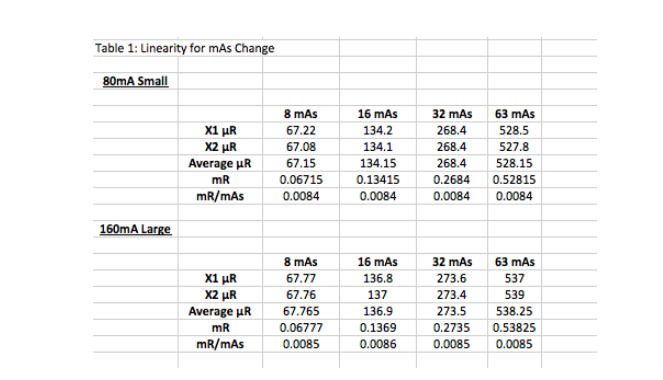
This image shoes how doubling mAs increasing the uR millreontgen by double and that shows good lineraity
4
New cards
What is the purpose of filtration in radiography?
Filtration removes low-energy photons and allows high-energy photons to pass toward the anatomy.
5
New cards
Why are low-energy photons removed from the x-ray beam?
They only add unnecessary skin dose without contributing to image quality.
6
New cards
What is it called when filtration removes low-energy photons?
Hardening the beam.
7
New cards
What are the types of filtration?
Inherent, Added, and Total filtration.
8
New cards
What is the main purpose of filtration?
Increases the mean (average) energy of the x-ray beam and markedly reduces patient dose without compromising image quality.
9
New cards
What happens when filtration increases beam energy?
There are fewer photoelectric interactions, which only add dose but not image quality.
10
New cards
What is inherent filtration?
Filtration that is built into the x-ray tube and cannot be removed.
11
New cards
What parts make up inherent filtration?
Glass envelope, oil around the tube, glass window (0.5 mm Al), and collimator mirror (adds 1 mm Al).
12
New cards
What is the total inherent filtration typically equal to?
1.5 mm aluminum equivalent.
13
New cards
What is added filtration?
Thin sheets of aluminum or equivalent material placed outside the glass window, above the collimator shutters.
14
New cards
How much added filtration should there be?
1.0 mm aluminum equivalent.
15
New cards
What is total filtration?
The sum of inherent and added filtration.
16
New cards
What is the minimum total filtration required for fixed x-ray units operating above 70 kVp?
2.5 mm aluminum equivalent.
17
New cards
What type of photons does aluminum filtration remove?
Low-energy (soft) photons, not the useful high-energy photons.
18
New cards
What is the Half Value Layer (HVL)?
The thickness of a material (usually aluminum) required to reduce the intensity of the x-ray beam by 50%.
19
New cards
What does HVL measure?
The quality and penetrability of the x-ray beam and determines if the tube has adequate filtration.
20
New cards
Who is responsible for measuring HVL?
The physicist, not the radiographer.
21
New cards
What does it mean if the HVL falls below the minimum requirement?
The beam is “soft” and not filtered enough.
22
New cards
What does it mean if the HVL is above the minimum requirement?
The beam is “hard,” meaning adequately filtered for good image quality and reduced patient dose.
23
New cards
What are compensating filters used for?
To reduce patient dose and produce uniform images of body parts that vary in thickness or tissue composition.
24
New cards
What are compensating filters made of?
Aluminum, lead-acrylic, or other suitable materials.
25
New cards
How do compensating filters work?
They partially attenuate x-rays directed toward thinner areas while allowing more x-rays to strike thicker, denser areas.
26
New cards
Are compensating filters commonly used in digital imaging?
Rarely.
27
New cards
What are the main types of compensating filters?
Wedge filter and Trough (bilateral wedge) filter.
28
New cards
Where are compensating filters placed?
They slide over the x-ray tube head and have a clear material for visualization during imaging.
29
New cards
Are compensating filters dose-limiting tools?
No, they are image quality tools.
30
New cards
What is reproducibility in radiography?
The ability to produce consistent exposures with the same technical settings.
31
New cards
What is the acceptable variance for reproducibility?
±5% or less between exposures.
32
New cards
Who sets the reproducibility standard?
The physicist, not the radiographer.
33
New cards
What is linearity in x-ray output?
When doubling the mAs results in approximately double the radiation output.
34
New cards
What is the acceptable variance for linearity?
±10% between exposures.
35
New cards
What does linearity ensure?
That changes in mA or time result in proportional changes in x-ray output.