RP3: Production of a dilution series of a solute to produce a calibration curve with which to identify the water potential of plant tissue
 Call Kai
 Learn
Learn Practice Test
 Spaced Repetition
 Match
Match Flashcards
 Knowt Play
1/17

There's no tags or description
Looks like no tags are added yet.
Name | Mastery | Learn | Test | Matching | Spaced | Call with Kai | Chat |
|---|
No analytics yet
Send a link to your students to track their progress
18 Terms
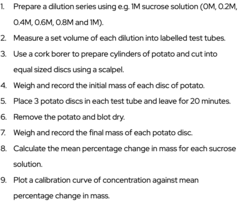
What is the method for this reaction? (9)
What is the water potential of pure water? (1)
0 kPa
What effect does the addition of solute have on water potential? (1)
It lowers the water potential (makes it more negative)
In which direction does water always move in terms of water potential? (1)
Water moves from a higher water potential to a lower water potential
How can the water potential of plant tissue be determined? (3)
- Place the tissue in solutions with known solute concentrations.
- If the plant tissue gains mass, water has entered by osmosis.
- If the tissue loses mass, water has left by osmosis
How can you determine the concentration that has the same water potential as the tissue? (1)
It is the concentration at which there has been no loss/gain of water
State two variables that should be controlled in an osmosis experiment. (2)
- Temperature
- Length of time the plant tissue is immersed in the solution
Which type of graph should be used to display the results of an osmosis experiment? (1)
A line graph because both variables are continuous
How can a graph be used to determine the sodium chloride solution with the same water potential as the potato tissue? (2)
- Plot a graph with concentration on the x-axis and percentage change in mass on the y-axis.
- Find the concentration where the curve of best fit crosses the x-axis (where percentage change is zero).
What is the advantage of giving results as a ratio or percentage change? (1)
It allows a fair comparison when cylinders/discs start with different masses
Why do additional readings at each concentration improve the reliability of results? (1)
They allow anomalies to be identified and enable a mean to be calculated
Why do additional readings improve the accuracy of the graph? (2)
- The curve of best fit will be more accurate, improving the determination of where it crosses the x-axis.
- Allows standard deviation values to show the spread of the results.
How would evaporation affect the water potential of the solution in the test tubes? (1)
It would lower the water potential
Why is it important to use potato cylinders from the same potato? (1)
To ensure they have the same water potential and avoid genetic differences
The potato skin is removed from the cylinders. Suggest one reason why this could affect osmosis. (1)
Potato skin is impermeable to water or has a different tissue with a different water potential
Why did the student blot dry the outside of each cylinder before reweighing? (1)
To remove excess water and only measure the water taken up (or lost) by the potato cylinder due to osmosis
Why does a small cube show a greater percentage increase in mass than a large cube? (1)
Due to the larger surface area to volume ratio of the small cube, allowing more osmosis to occur.
Why would a potato cylinder in distilled water gain mass? (3)
- Water moves into the potato cells by osmosis
- From a less negative water potential outside to a more negative water potential inside
- Opposite for loss in mass