3.3 revenue,costs and profits.
1/39
There's no tags or description
Looks like no tags are added yet.
Name | Mastery | Learn | Test | Matching | Spaced | Call with Kai |
|---|
No analytics yet
Send a link to your students to track their progress
40 Terms
Average and total revenue
TR= price x quantity
TR= how much money a firm receives in total from sales.
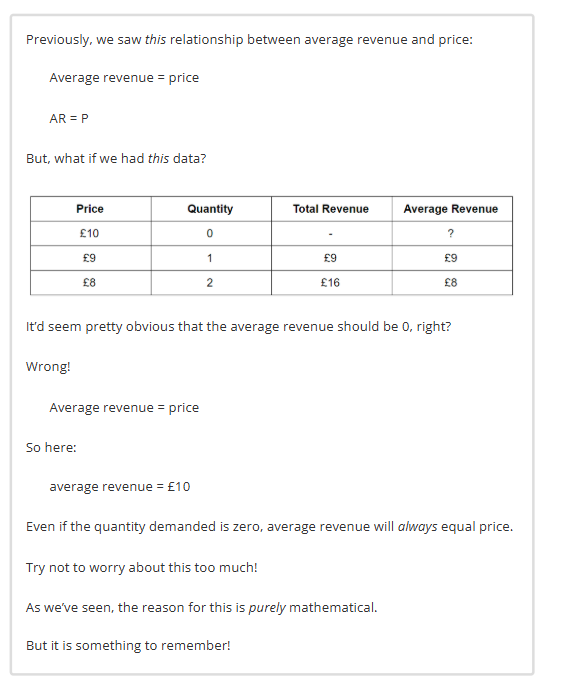
AR: what a business receives on average from each sale.
AR= TR/Q
AR= Price because PXQ/Q
Marginal and total revenue
Marginal means additional
marginal revenue: additional revenue a firm makes from selling one extra unit.
When marginal revenue is positive, total revenue increases quantity.
When marginal revenue is 0 total revenue doesn’t change.
When marginal revenue is negative, total revenue decreases with quantity.
marginal revenue formula: change in TR/ change in Q
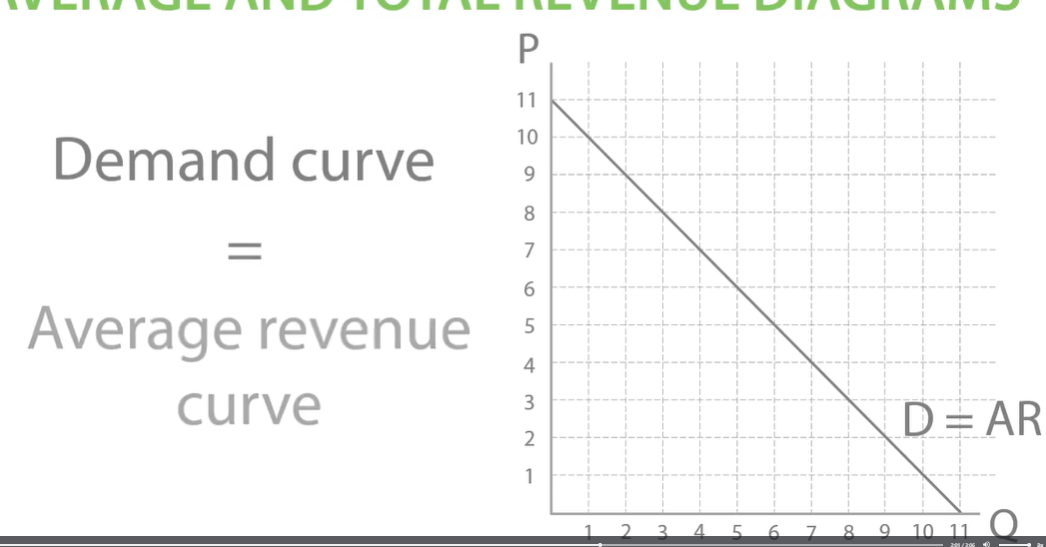
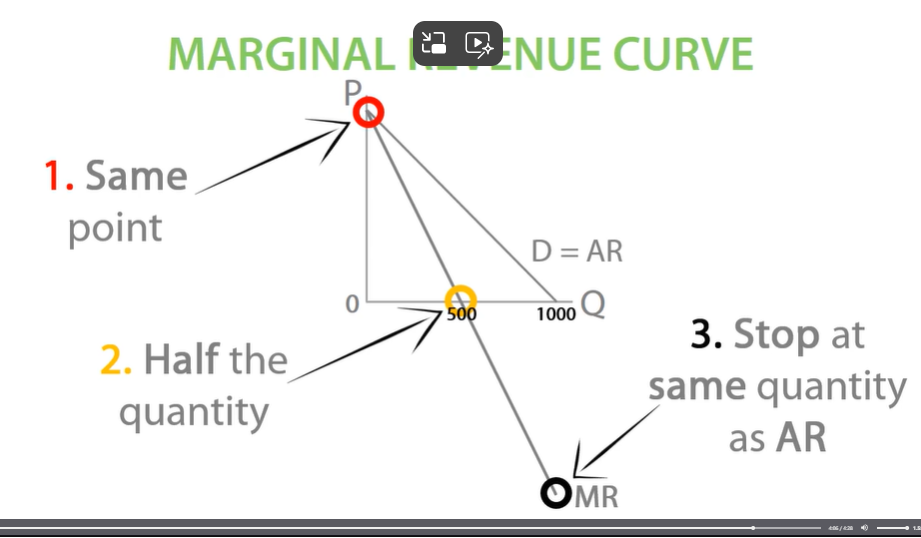
Marginal revenue curve
Demand curve shows us price so its also AR.
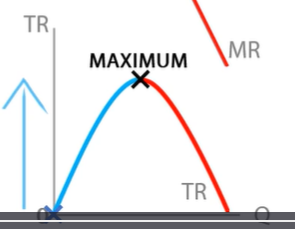
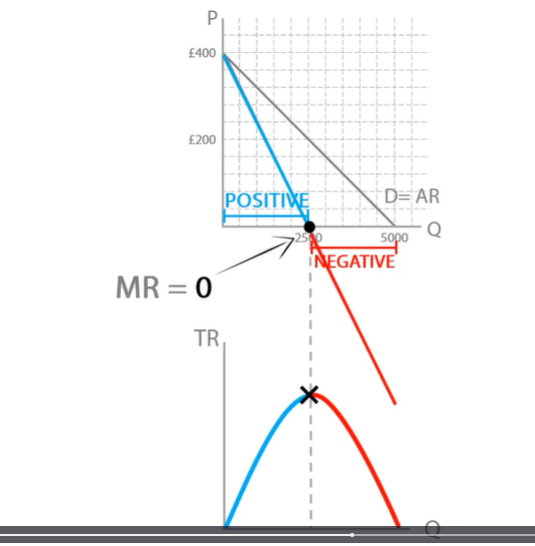
Total revenue Curve.
As quantity increases, TR will continue to increase as long as MR is positive.
Eventually MR reaches 0, TR is maximised.
If marginal revenue is negative, as quantity increases, total revenue will decrease.
total revenue and elastic demand.
When MR is positive, demand is elastic. When MR is negative, demand is inelastic.
MR= 0 unitary elastic.
Because price has fallen by 20%, quantity demanded will increase by more than 20%- elastic.
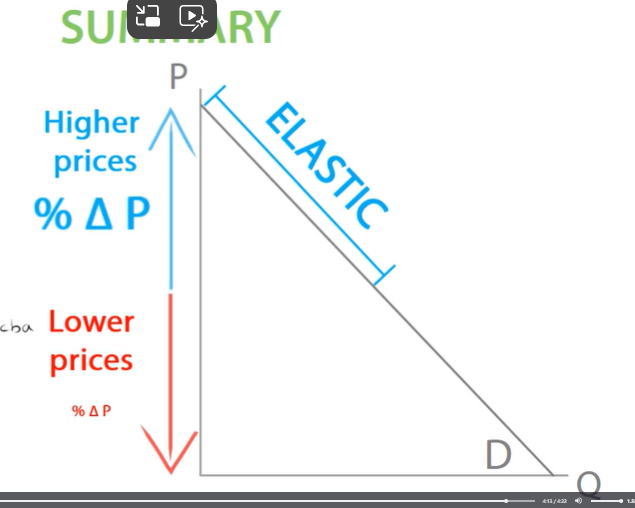
Elastic:
When MR is positive, demand is elastic.
When price is high, a % change in price will have a big effect, so consumers will be very responsive and demand will be elastic.
Price increase, total revenue decreases
Price decreases, total revenue increases if quantity demanded increases by a larger percentage.

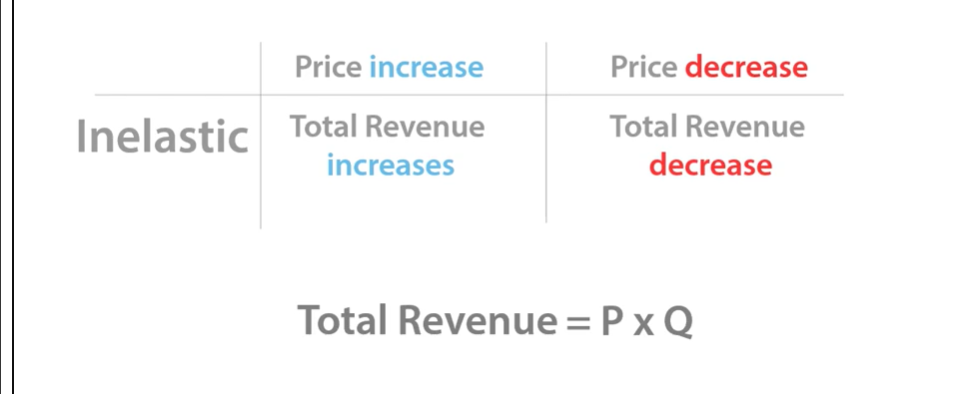
Total revenue and inelastic demand
Demand is inelastic, following a 75% increase in price, quantity demand would decrease by less than 75%
Inelastic:
When price is low, a & change in price will have a small effect, so consumers will be unresponsive and demand will be inelastic.
When MR is negative, demand is inelastic.
Price increase, total revenue increase
Price decreases, total revenue decreases
Price decreases, total revenue decreases, if quantity demanded increases by a smaller percentage.
When MR=0. PED will be unitary elastic.
Why does price elasticity change along the demand curve?
PED IS % CHANGE IN QD/ %CHANGE IN PRICE.
higher price: %change in price will have bigger impact on consumers. so demand will be elastic.
such as iPhone £1000 decreased by 10%= 900
lower price: a % change in price will have a smaller impact on consumer, so demand will be inelastic.
at a lower price of £10, if the price decreases by 10% its£9
lower price, % change in price has a smaller impact.
So as price falls, elasticity changes from elastic to unitary to inelastic.
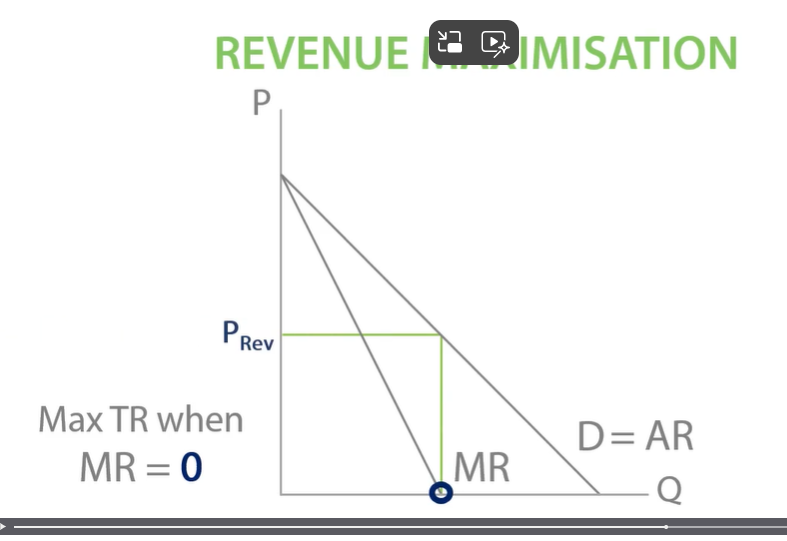
Revenue maximisation
TR is maximised when MR=0- WHEN A BUSINESS WANT TO MAXIMISE TR. then go up to demand curve to find price.,
short run v long run
fixed costs and variable costs
Short run is when at least one factor of production is fixed.
Long run is when all factors of production are variable so only have variable costs.
short- fixed amount of ovens
long run-expand kitchen size and more builders.
In the short run fixed costs and variable costs.
Variable costs- vary with output.
e.g. wages, increases output such as meals.
in a newspaper variable costs would be ink, paper.- vary as output changes.
fixed costs- don’t vary with output because fixed costs are fixed.
e.g. printer, salaries and office space.
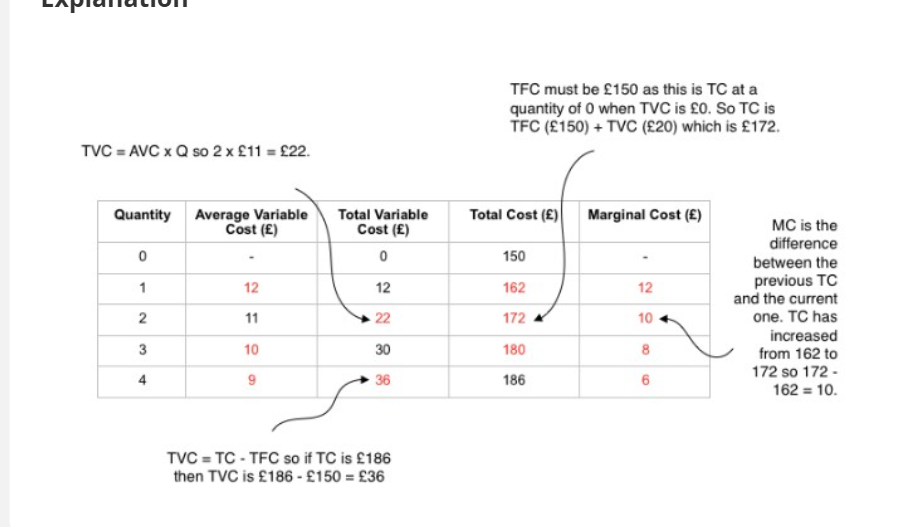
total cost- total variable cost + total fixed cost.
TC = TVC + TFC
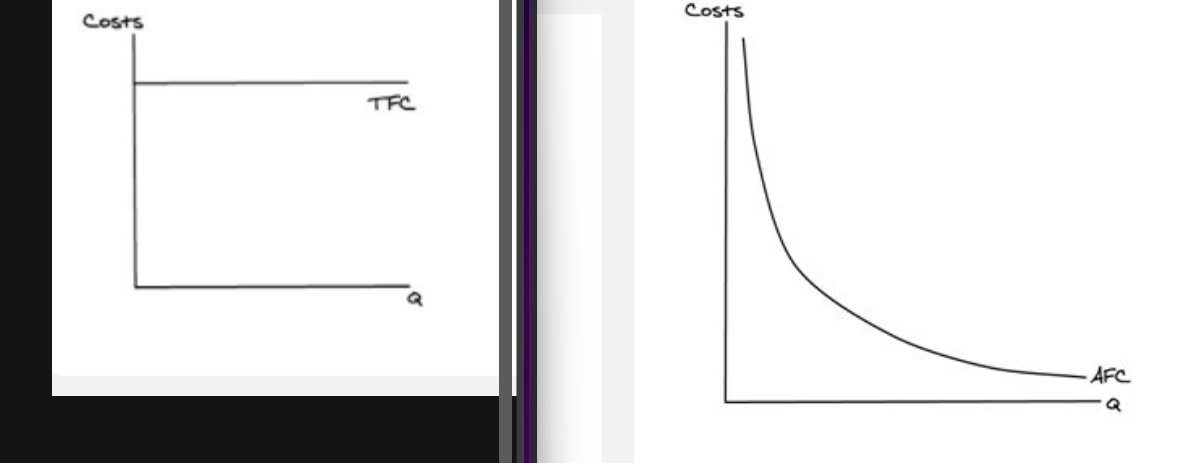
Total fixed cost and average fixed cost
development costs = fixed costs
Average fixed cost = total fixed cost / quantity
AFC= TFC/Q
total fixed cost curve on left and average fixed cost curve on right.
AFC is always falling because as quantity increases total fixed cost is spread across more units.
AFC= average falling curve.
TFC AND AFC are relevant in the short run as factors are fixed in the short run
No fixed cost in the long run when all factors are variable.
marginal cost
marginal cost- additional cost of selling one extra unit.
fixed costs do not vary with output, so as quantity increases they will remain the same.
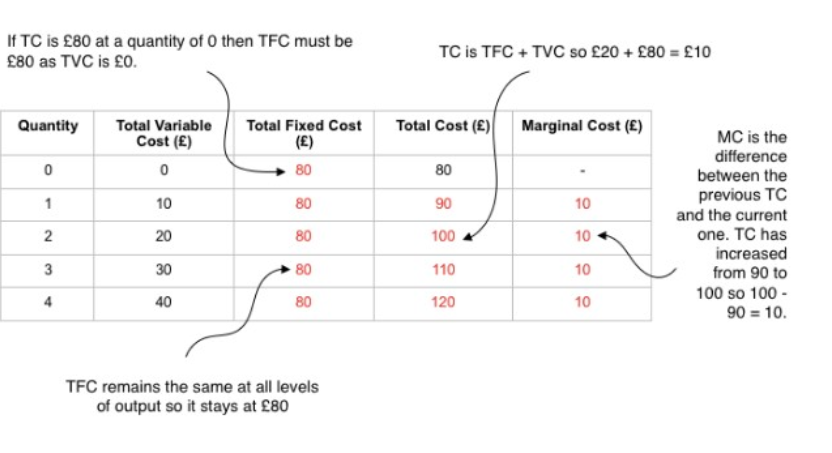
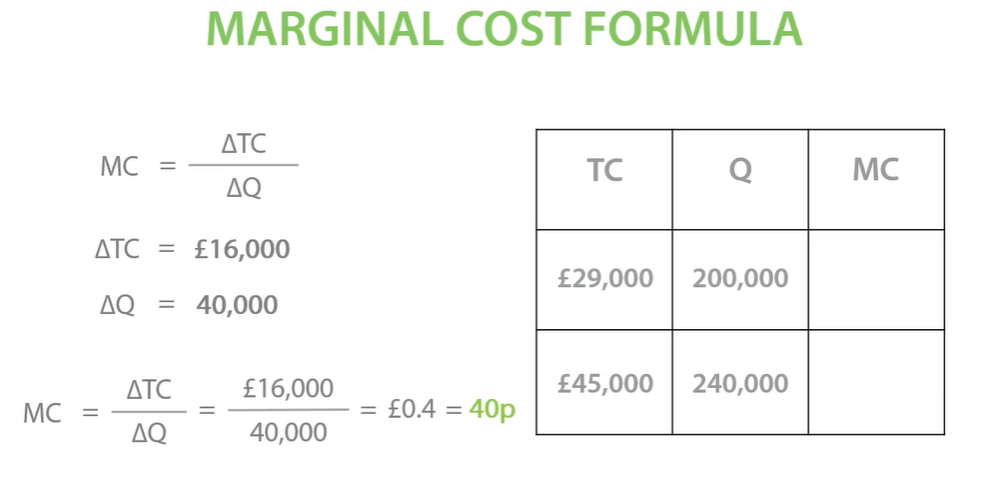
marginal cost formula
marginal cost is the additional cost of producing one extra unit.
MC- change in total cost/ change in quantity.
MC= change in TC/ change in Q.
When Q increases by more than one we need to use MC (marginal cost) formula.
If productivity increases, marginal cost will decrease.
Initially, Specialise using division of labour, increase productivity.
However, additional labours at this point wont be effective in the short run at least one factor of production fixed, so productivity falls- law of diminishing returns and marginal cost increases.
In the long run, factors variable, productivity wont diminish,
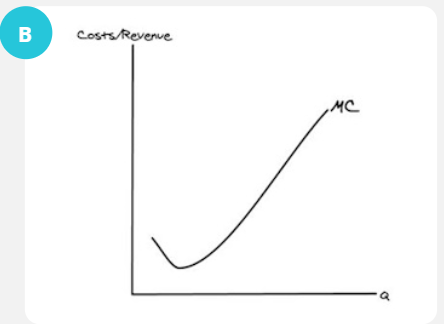
Marginal cost curve.
In the short run, as we increase output and employ more factors of production, productivity will increase and decrease marginal cost but eventually decrease as we continue adding factors because of law of diminishing marginal returns, this will decrease productivity.
DIAGRAM:
As output increases, MC initially slops downwards as workers specialise which increases productivity, marginal cost decreases.
Diminishing marginal returns will decrease productivity therefore increase marginal cost.
Factors that affect and shift MC:
-changes in unit costs of production, lower unit costs mean business can supply more at each price, higher labour productivity.
-higher unit costs cause an inward shift of supply e.g. rise in wage rates or an increase in energy prices or other raw materials.
-depreciated exchange rate causing the price of imported raw materials to go up.
-advances in new technology, outward shift in supply. entry of new producers into the market, outward shift. subsidies.
-indirect taxes cause an inward shift and regulations increase costs cause an inward shift in supply.
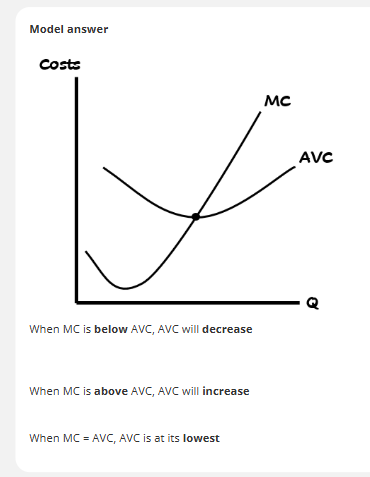
Total Variable cost and Average variable cost.
AVC= TVC/Q
Up to Q1, MC is below AVC. (marginal cost below AVC will drag AVC down.
AVC will be at its lowest when AVC = MC.
MISCONCEPTIONS:
If MC is below AVC, AVC will decrease.
If MC is above AVC, AVC will increase.
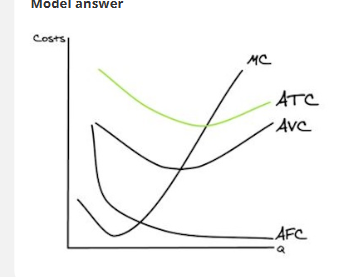
Average Total Cost
ATC= TC/Q
ATC= AVC + AFC
Average total cost is above average variable cost and average fixed cost.
Lowest ATC will interest MC just as lowest AVC intersects MC at its lowest point.
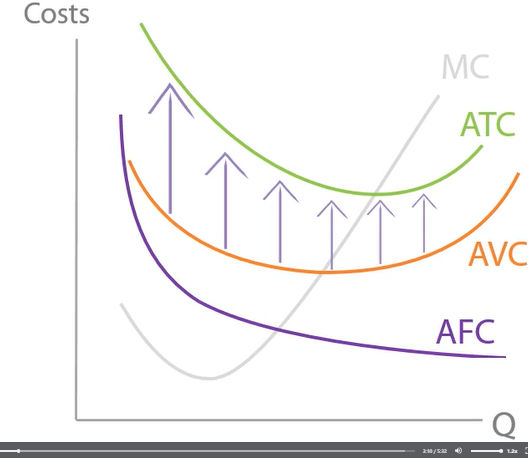
draw a diagram using marginal cost, average variable cost, average fixed cost and average total cost.
AC= ATC
ATC= short run average cost curve
These cost curves only apply in the short run because we have fixed costs AFC on our diagram -and fixed costs are only present in the short run. In the long run, all factors become variable.
Long run average cost curve
SRAC- will represent a companies average total cost in the short run when at least one factor of production is fixed. e.g. limit companies output as limited kitchen.
SRAC 1- in the short run as output increase as new kitchen and more pizzas are produced with new SRAC curve.
What do we notice about our LRAS curve?
As quantity increases, LRAC decrease then increases.

PURCHASING ECONOMIES
TECHNICAL ECONOMIES
MANAGERIAL ECONOMIES
MARKETING ECONOMIES
FINANCIAL ECONOMIES
RISK BEARING ECONOMIES
Internal economies of scale only apply to long run average costs, because in the long run, when firms can expand enough to take advantage of economies of scale. In the long run, internal economies of scale help a firm reduce their long run average costs.
purchasing economies - firms expand, they can bulk buy, reducing long run average costs. They can negotiate lower costs.
technical economies- firms expand, they can exploit technical economies of scale and invest in specialist capital to increase their productivity and decrease their LRAC.
managerial economies— hiring highly skilled specialist managers, productivity increase and LRAC decrease. small firms cant do this as this is too expensive.
marketing economies- big firms spread their marketing costs across many units, decrease LRAC. small company would go bankrupt doing this.
financial economies- as firms expand and grow bigger they become less risky making more sales and profits, so they can borrow at lower interest rates, reduce LRAC.
risk bearing economies- diversify to new areas, reduce cost of failure in one sector. e.g. virgin have diversified into 400 different areas.
what are the six types of internal economies of scale?
Richards mum flies past the moon
risk bearing
managerial
financial
purchasing
technical
marketing
Internal economies of scale are when long run average cost falls as a firm expands.
Internal diseconomies of scale.
ALIENATION
BUREAUCRACY
COMMUNICATION
Internal diseconomies of scale lead to a rise in long run average costs, as a firm expands.
Alienation- workers feel lost and disconnected at work, this leads to demotivation, productivity falls, and long run average costs rise. e.g. large call centres in India.
Bureaucracy- is all the paperwork, managers, filing and secretaries that a firm has to pay for when it expands, increasing LRAC.
estimated over 21bn spent on bureaucracy, increasing costs
communication - firms get bigger, communication slows down as big firms have so many layers. e.g. tesco. this wastes time reduces productivity and increase LRAC.
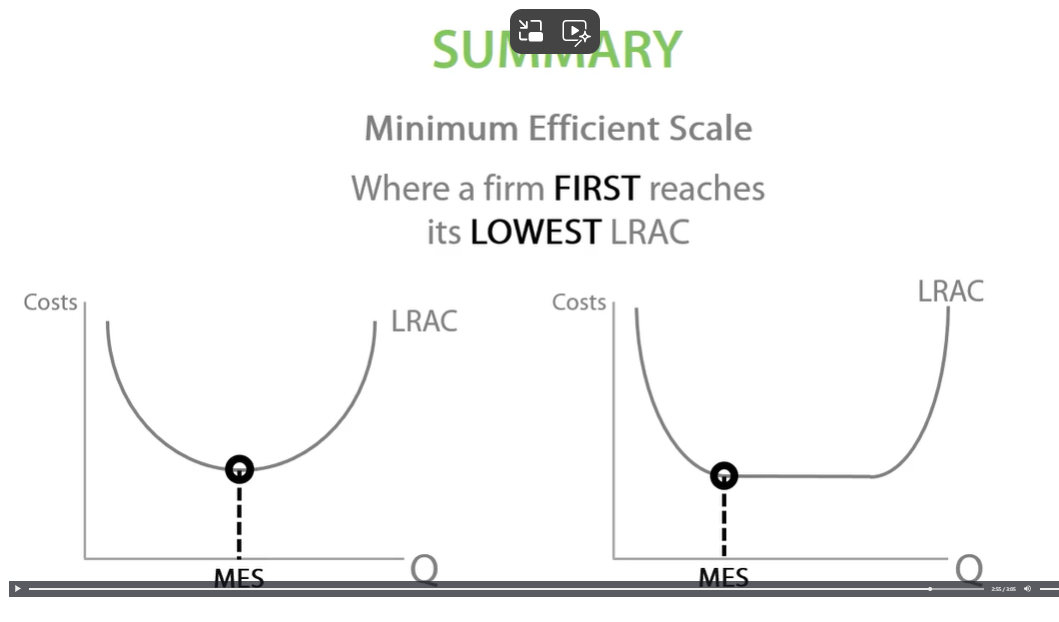
The Minimum Efficient scale
Minimum efficient scale- Where a firm reaches its lowest LRAC.
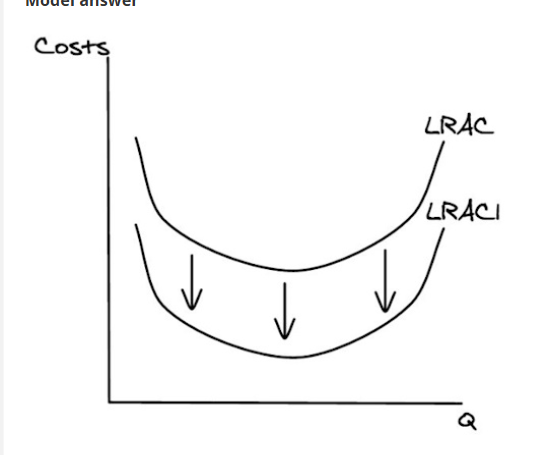
External economies of scale
Internal economies of scale are when long run average costs fall as a firm expands.
External economies of scale are reductions in long run average cost for a firm, as industry’s output increases.
When an industry expands, lots of specialist workers will move to that area to find work. This makes it easier to recruit workers, reducing a firm’s recruitment costs, decreasing their LRAC.
knowledge transfers: when an industry expands, knowledge will be transferred between firms. This helps firms learn more effective new production techniques, decreasing their LRAC.
e.g. LA’s film industry, green screen technique spread by knowledge transfer. using green screens has reduced film producers long run average costs.
showing external economies on a diagram
….
Transport infrastructure- improved infrastructure (roads, railways, airports) decrease costs for all firms in an industry.
Suppliers move closer to firms, lowering transport and input costs.
R&D firms nearby: proximity to research firms brings new technology, reducing costs for all businesses in the industry.
PROFIT
PROFIT- TR- TC(including opportunity cost)
normal profit TR= TC When a firm is making normal profit, they will stay in the market, because their opportunity cost is just covered.
Losses: When TR is less than TC. The firm will make less than normal profit, so it will leave the market because it can’t cover its opportunity cost.
Supernormal profit: When TR is greater than TC. The firm will make more than normal profit.
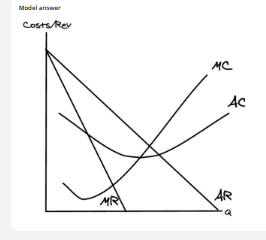
COSTS AND REVENUE DIAGRAM.
PRICE IS AR
Marginal revenue is the additional revenue from selling one extra unit.
Marginal cost is the additional cost of producing one extra unit.
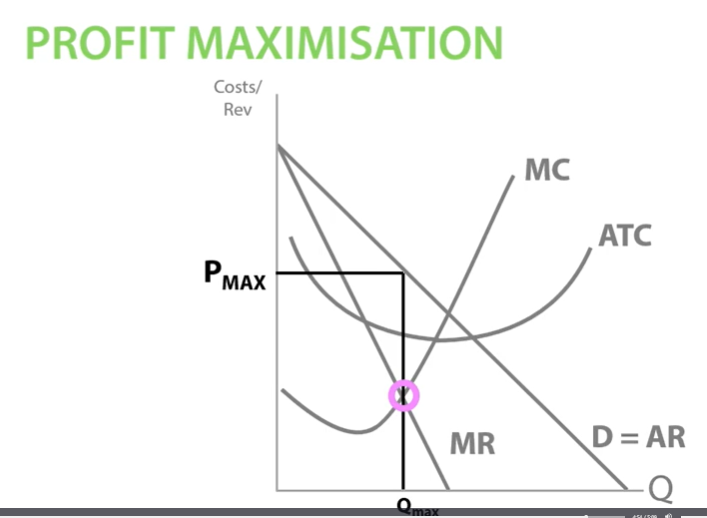
Profit maximisation
MR=7 MC=2 additional profit is £5
Marginal revenue above marginal cost, increase the quantity to make additional profit by selling more units.
Qmax- MC and MR are the same. additional £0 profit. Therefore profit is maximised. No more extra profit to make selling extra units.
Pmax- To find price, look at AR curve.
Therefore, to fine profit maximising price it is at Qmax, MC = MR , the profit maximising quantity and then Pmax would be AR.
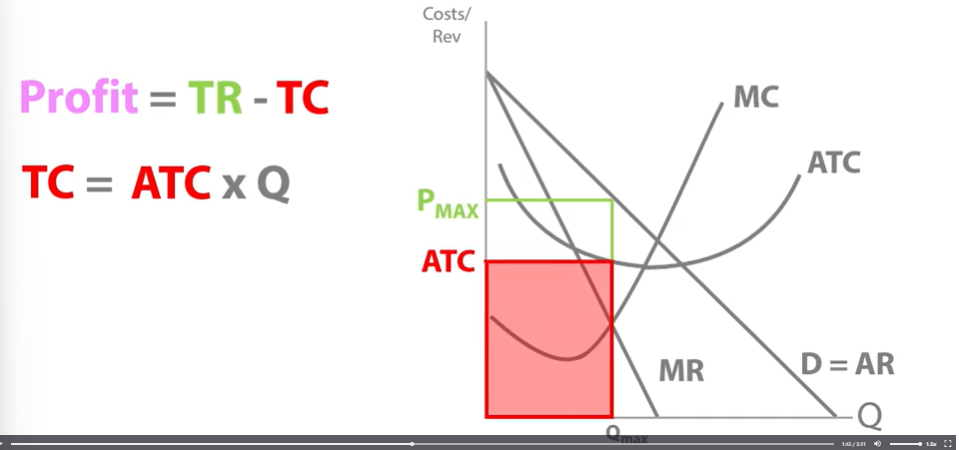
Showing profits.
At profit-maximising quantity Z. What is the total cost on diagram?
Profit= TR-TC
At profit-maximising quantity Z, what is the total revenue?( on the left)
What is the profit for the diagram (on the right)- supernormal profits because TR is higher than TC.
Profit= TR-TC

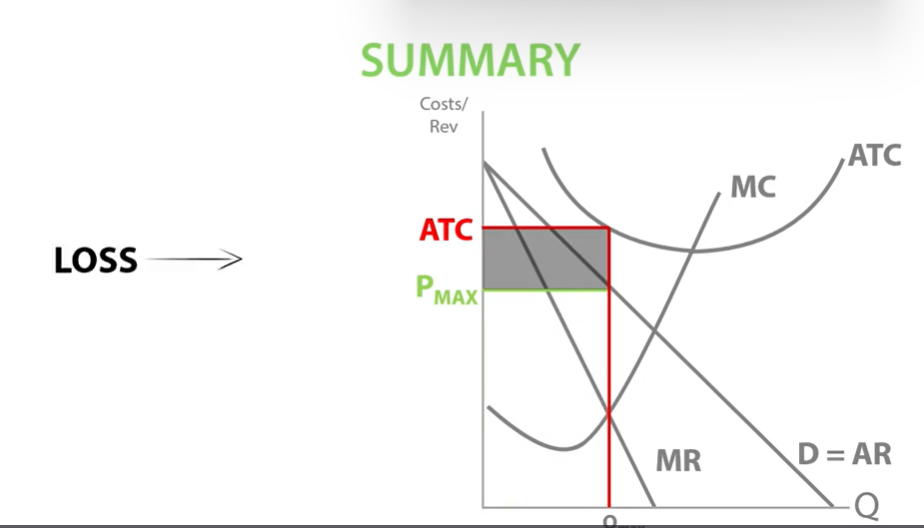
Showing losses.
ATC is above AR (price) then the firm will make a loss.
Total cost bigger than total revenue.
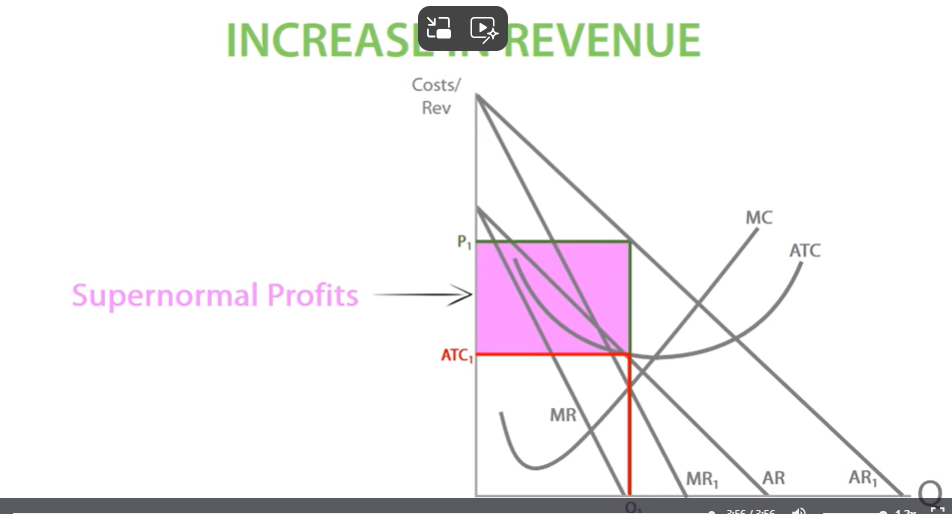
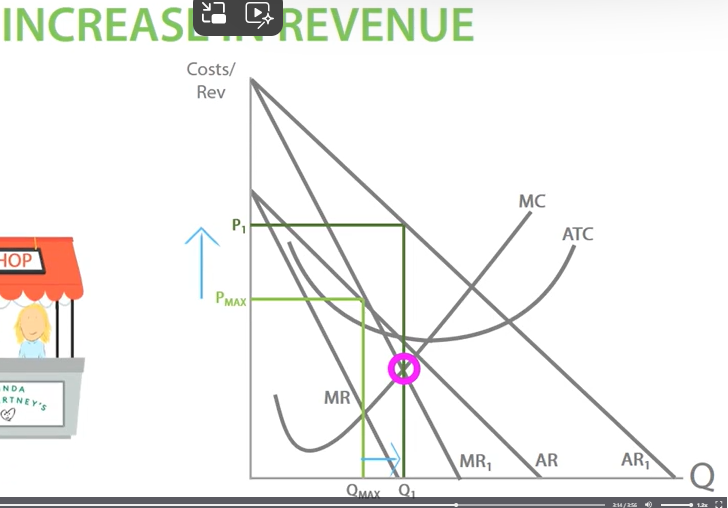
Increase in revenue.
Quantity increases from Qmax to Q1 and Pmax to P1
MR AND AR increase, demand increase
This is after celebrities advertising the shop, then quantity increases and price increases as consumers would buy for higher price.
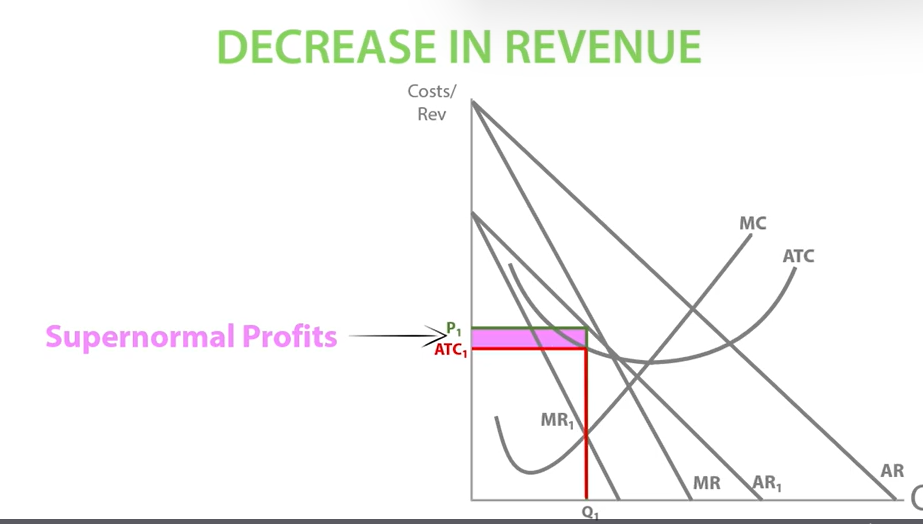
Decrease in revenue.
What would happen if Netflix entered the market, stealing Blockbuster’s customers?
Blockbusters MR AND AR would decrease, demand decreases.
Price decreased and quantity decreased.
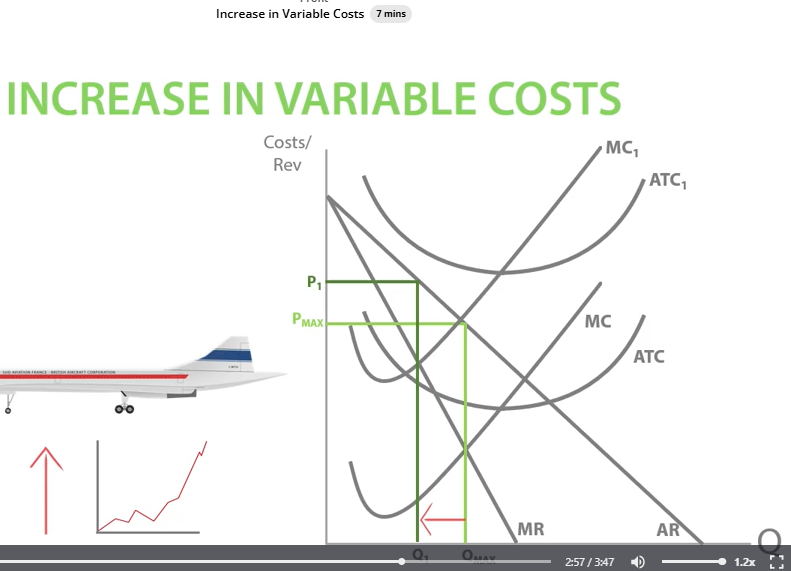
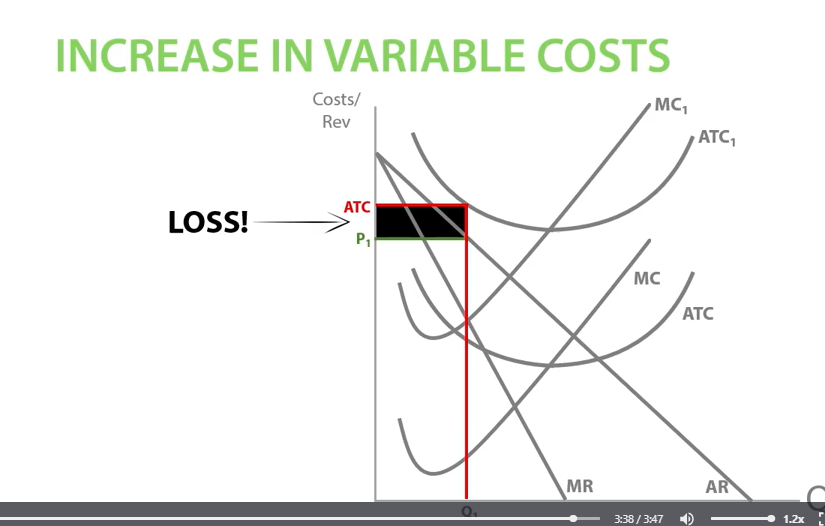
Increase in Variable costs.
What happened to the price and quantity when fuel costs increased?
MC and AC would increase.
Price increased and quantity decreased.
Variable costs increases, profit decreases.
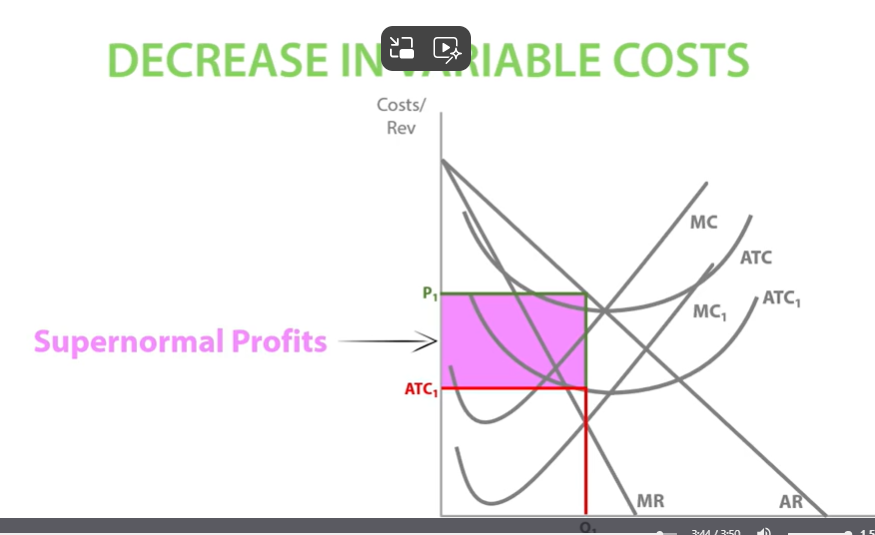
Decrease in Variable costs.
What’s most likely to happen after Pizza Hut replaces its human waiters with more efficient robot waiters?
Less wage costs and more productivity.
Pizza hut MC and AC would decrease.
Price decreased and quantity increased.
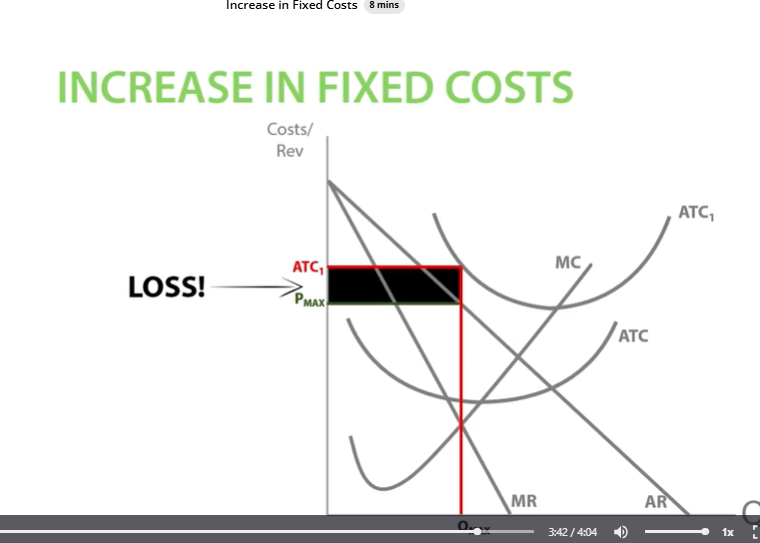
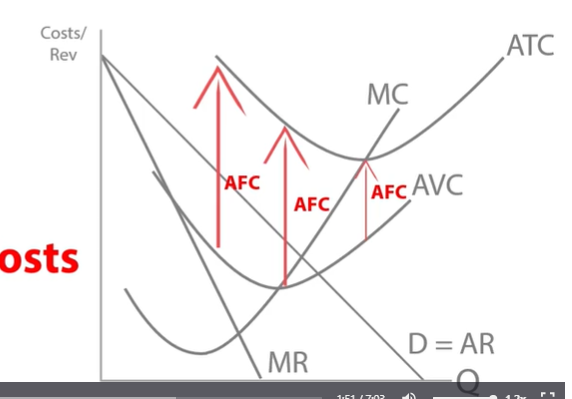
Increase in fixed costs.
What would happen if the rent Ramsay had to pay suddenly increased?
Ramsay’s ATC would increase.
Rent is a fixed cost, so if rent costs increase, average total cost would also increase. ATC=AFC+AVC
The marginal (additional costs) wouldn’t increase.
Make a loss.
Short run shut down points.
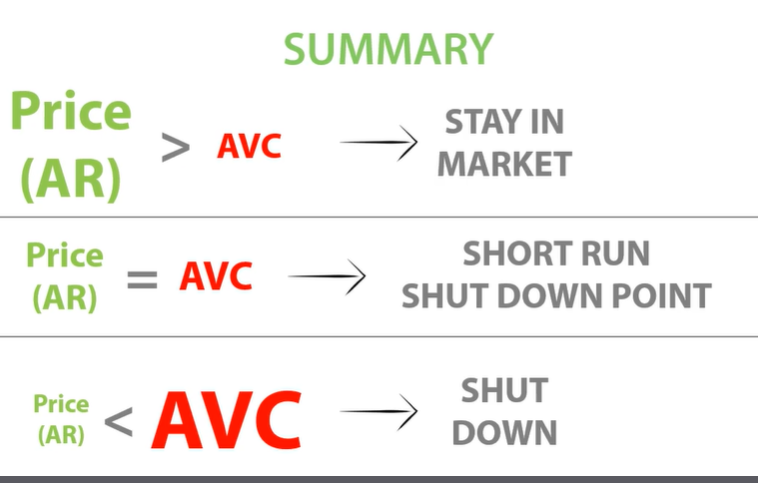
In the short run, if a loss-making firm’s Price (AR) is greater than AVC, the firm will stay in the market because it is covering its average variable costs.
It can pay of its fixed costs and make profit in the long run.
If AR is less than AVC then shut down.
AR= AVC. short run shut down point. above it will stay in the market.
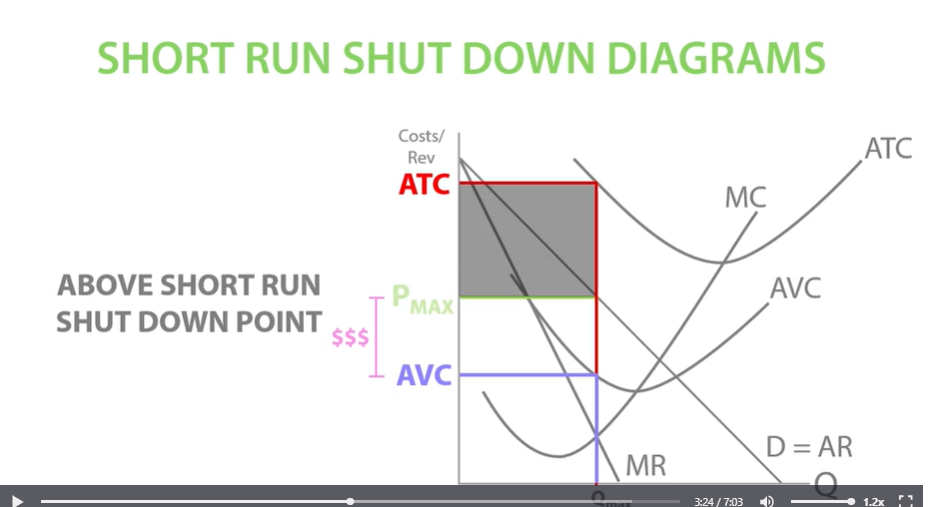
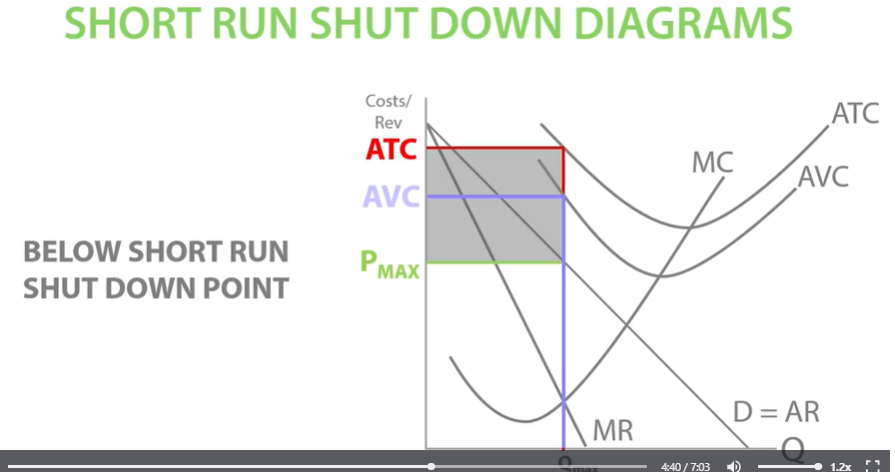
Short run shut down diagrams.
Short run shut down point is where Price AR = AVC.
Below the shut down point is when AR is below AVC. loosing money on each unit sold.
Above the shut down point when AR is above AVC, loss making firm is at least covering its AVC. some money on each sale, some money on sales, pay off high fixed costs, break even and make a profit in the long run.
The gap between AVC and ATC represents average fixed costs.
In the short run if AR <AVC, the firm will leave the market because its not covering its average variable costs.
Short run shut down diagram:
AR is above AVC., above the short run shut down point.
What will Apply do?
Apple will stay in the market because price is higher than AVC, so its covering its variable costs.
Make some money on each unit it sells and use the money on each unit to pay of its fixed costs
So in the long run it will break even and make a profit.
Short run shut down point diagram:
AVC is above AR, below the short run shut down point.
The diagram shows that Trump is below his short run shut down point- price is below AVC. It will shut down and leave the market.
If price AR, is below AVC, he is selling the price below the variable cost of producing each unit. He is losing money on each unit sold, so he should shut his company down to avoid further losses.
Diagrams for short run shut down
So far we’ve seen that in the short run, if a loss-making firm’s AR > AVC, the firm will stay in the market because...
If a loss-making firm’s AR > AVC in the short run, it will still be making some money on each sale. The firm will use this money to pay off its fixed costs, break even and eventually make profit in the long run. So it will stay in the market and wait to make long run profits!

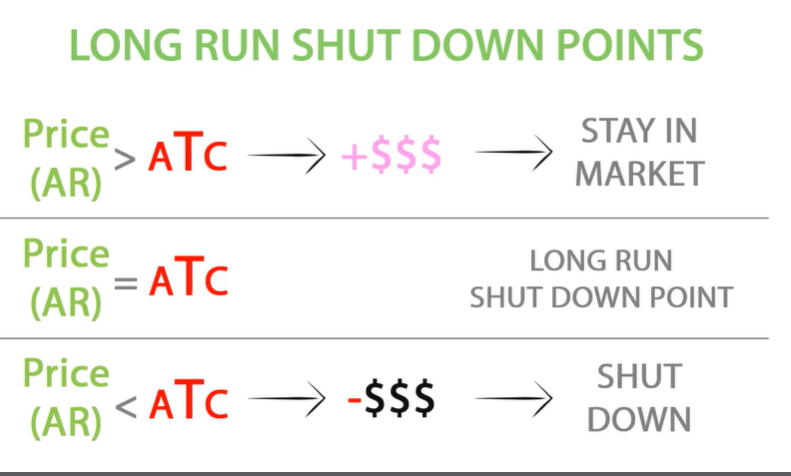
Long run shut down points
Long run shut down point = AR=ATC
In the long run, all factors of production are variable.
In the long run= ATC= AVC+0, as there are no fixed costs in the long run.
In the long run, above our long run shut down point AR>ATC the firm will stay in the market because its covering its average total costs.
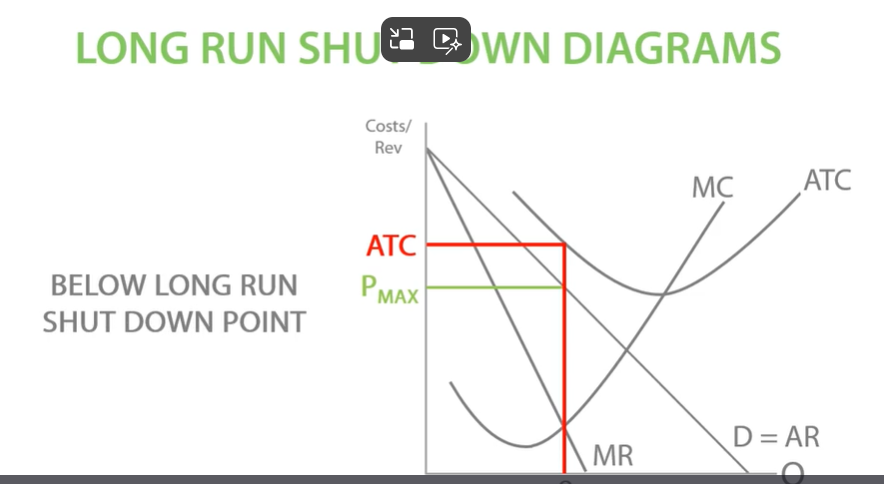
Long run shut down point diagram
If a firm is below long run shut down point AR below ATC, it will leave the market.
If a firm is profit maximising it will stay in the market, ATC<AR.
