Biostats test 1
1/48
There's no tags or description
Looks like no tags are added yet.
Name | Mastery | Learn | Test | Matching | Spaced |
|---|
No study sessions yet.
49 Terms
2 types of statistics
Descriptive
Inferential
Descriptive statistics are calculations that produce a number that _______ or ______ a set of data
summarizes or describes
Examples of descriptive statistics
Mean, median, mode, range, std dev, variance
Inferential statistics are calculations based on measurements from a _____ used to reach a conclusion about a ______,______ population
sample, larger, unmeasured
Population vs Sample
Population: ALL scores of individuals of interest
Sample: scores of a SUBSET of population
Representative sample
scores of subset, goal to explain behavior/characteristics of population
what is the issue with representative sample
too large
What is a parameter
a characteristic of a population; is constant and DOESNT change unless population does
becomes variables
What are 2 types of parameters
Numerical or nominal (categorical)
How is a statistic different than a parameter
Statistics are used to estimate population parameter
they DIFFER from sample to sample (are variable)
Parameters describe _____ while statistics describe ______
Parameters= populations, statistics = sample
Descriptive statistics describe your _____ but allow you to make infrences about _____inferences
sample, population
variable
any measurable characteristic that varies across different situations
score
measurement of a variable
two major types of variables
quantitative
qualitative
What do quantitative variables measure
amount or degree of variable
NUMERIC and CONTINUOUS
Examples of quantitative variables
weight in pounds, length in feet
(have range limits)
time is always a ______ variable
continuous (quantitative)
What do qualitative variables measure
categorical characteristics
not continuous —> they are discrete
not numeric
Examples of qualitative characteristics
religions, gender, political affiliations, university classification
2 qualitative scales of measure
nominal and ordinal
What does a nominal scale of measure show
membership in a group (qualitative, not continuous)
Examples of nominal measures
zodiac signs, jersey numbers, occupations
what do ordinal scales of measure show
same as nominal, but have GREATER and LESS than relationships (qualitative, categorical)
Examples of ordinal scales of measure
Pageant contests, race finish places, university classifications
Note: there is an ORDER (ie one better than the other)
2 quantiative scales of measure
interval, ratio
what are interval scales of measure
same characters as nominal and ordinal, but the intervals between each number is equal
EX of interval scales of measure
Temperature, IQ
what are ratio scales of measure
same as interval, nominal, and ordinal BUT has true 0 point (showing absence of variable) —> nothing BELOW zero
EX of ratio scales of measure
height, weight, time, money
confounding variable
type of extraneous variable, varies with IV, can’t see true relationship
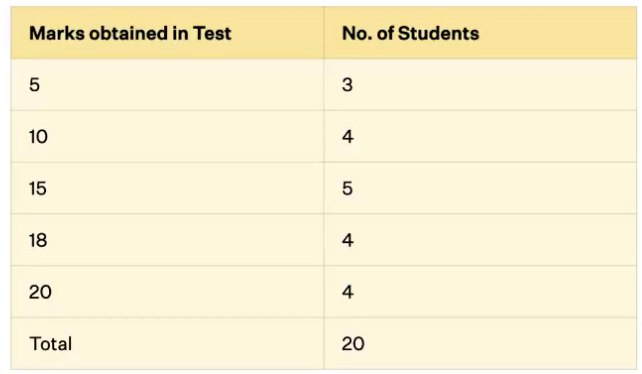
simple frequency distribution
ordered arrangement of score that show each scores frequency
grouped frequency distribution
ordered arrangement of scores condensed into MEANINGFUL GROUPS (class intervals)
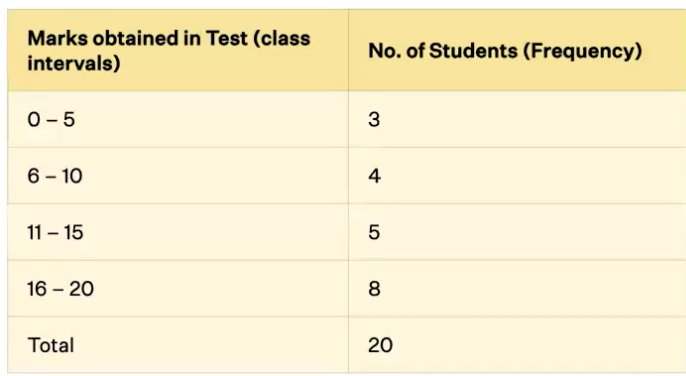
class intervals
groups of equal sized ranges of data on grouped frequency distribution
abscissa
X axis (horizontal axis)
ordinate
Y axis (vertical)
frequency polygons are used to graph _____ data
quantitative
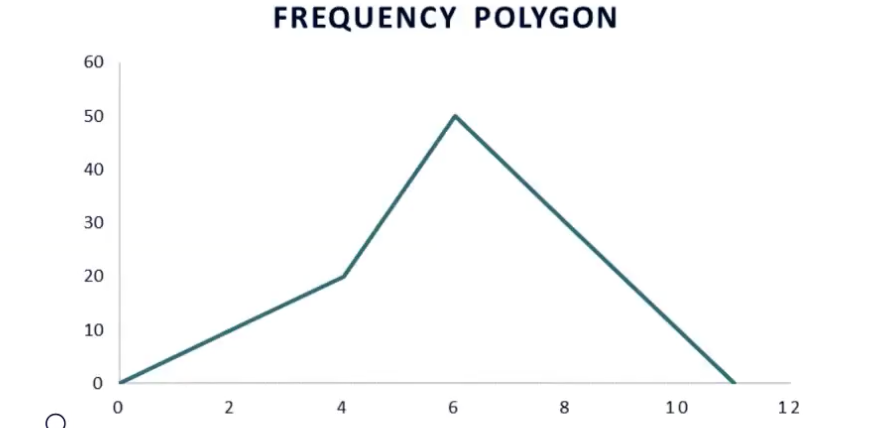
reflect intersecting point
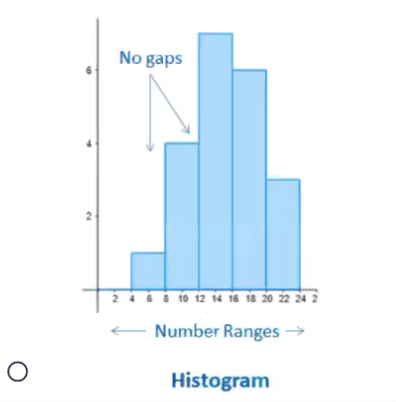
Histograms are used to graph _____ data, (____ data)
quantitative, discrete
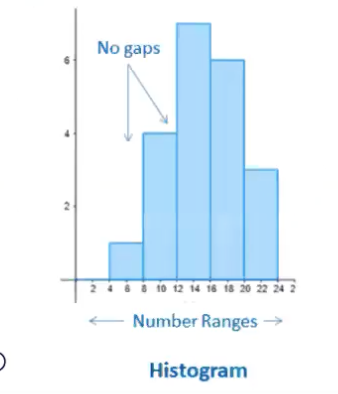
Histograms represent _____ of scores
distribution
Bar graphs are used to graph categories of a ______ variable
qualitative
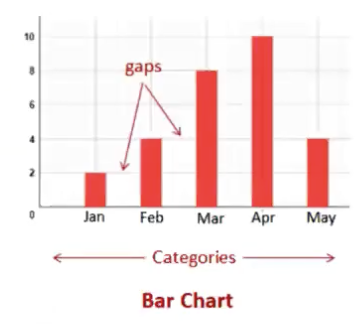
Looks like a histogram but spaces in between each
line graph (scatterplot) is used to graph relationships between ______
two variables
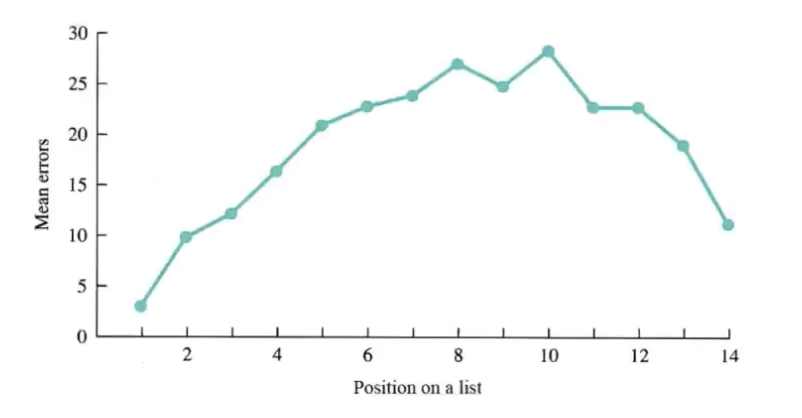
points reflect intersection of X and Y variables
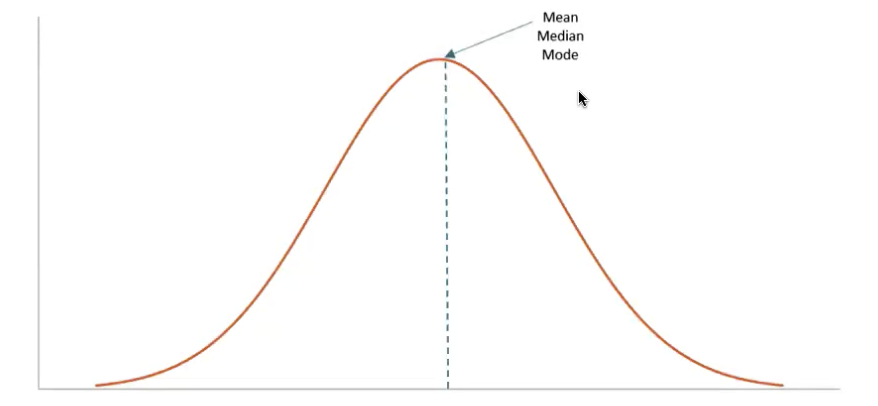
What do bell-shaped distributions show (aka normal distribution/ normal curve)
Most frequent scores fall close to the mean
Extremes are less common
Skewed distributions occur when
highest frequency scores are not near mean bc of presence of outliers
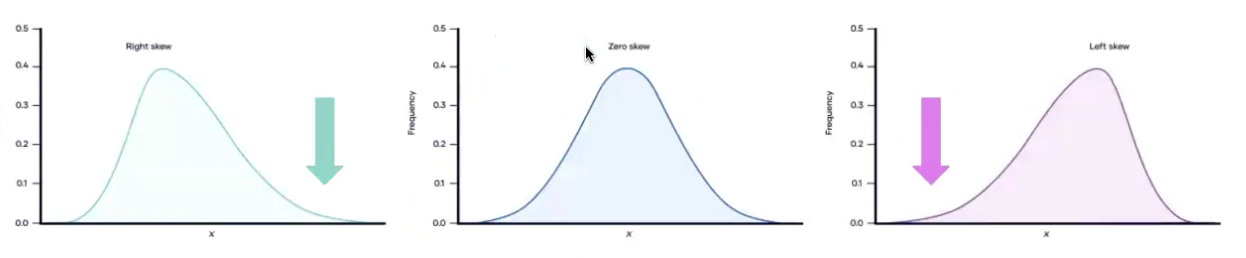
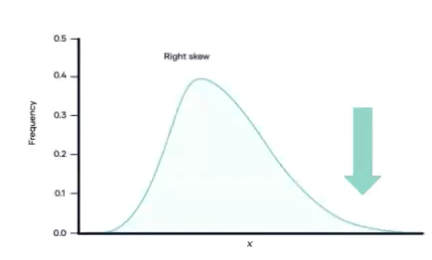
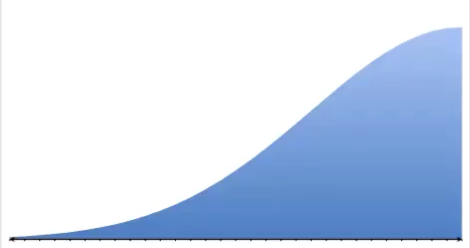
In positively (right) skewed, most frequency scores are ____ and tail is toward _____
LOW, tail is toward right (high scores)
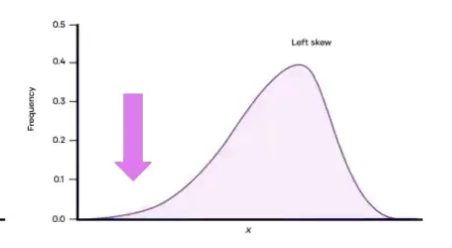
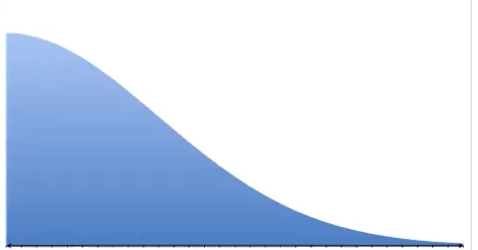
In negatively (left) skewed, most frequency scores are ____ and tail is toward _____
HIGH, tail is toward LOW scores (left)
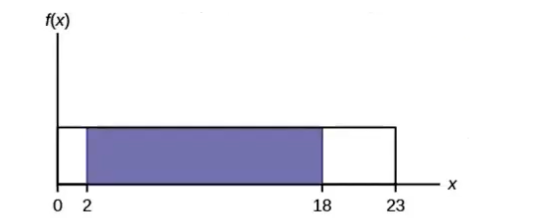
in a rectangular (uniform) distribution….
all X values have same frequency
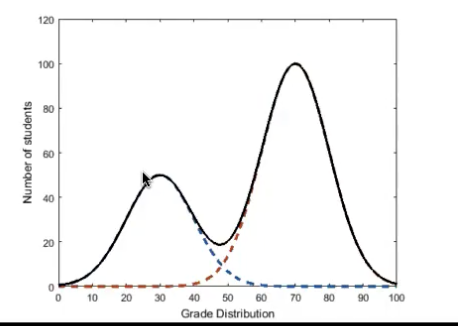
A bimodal graph has…
2 peaks (2 averages)
what type of curve is this
negative skew
what type of curve is this
positive skew