4. Population and Migration info
 Call Kai
 Learn
Learn Practice Test
 Spaced Repetition
 Match
Match Flashcards
 Knowt Play
1/15

There's no tags or description
Looks like no tags are added yet.
Name | Mastery | Learn | Test | Matching | Spaced | Call with Kai | Chat |
|---|
No analytics yet
Send a link to your students to track their progress
16 Terms
Define Birth and death rate
Births/deaths per 1000 people each year
Define Fertility rate/TFR + what is replacement rate
Average number of children a woman is expected to have over her lifetime assuming she survives
Replacement rate: 2.1bpw
Define infant mortality rate
Number of deaths for infants under 1 years old per 1000 live births
Ages of different age categories
Young dependents = 0-15
Working population = 16-64
Elderly dependents = 65+
Define Dependency ratio
Ratio of countries working population to dependent population
Factors affecting fertility + acronym
Female literacy/employment - Afghanistan around 7% woman employed, UK around 70%
Access to contraception - Taliban birth control ban in Afghanistan
Economic burden/asset of children
Religion/cultural norms - Catholics → discourages contraception - supports large families
Natalist policies - 1CP
Conflict
CREEP - contraception, religion, education, economic, politics
Factors affecting mortality
Access to healthcare
Nutrition
Population structure - Age
Lifestyle factors - smoking, alcohol, drugs - 40% of Serbians smoke
GDP per capita
Communicable/non-communicable diseases - heart diseases largest global cause of death
Pollution
War
Describe population pyramid for LIC, MIC and HIC
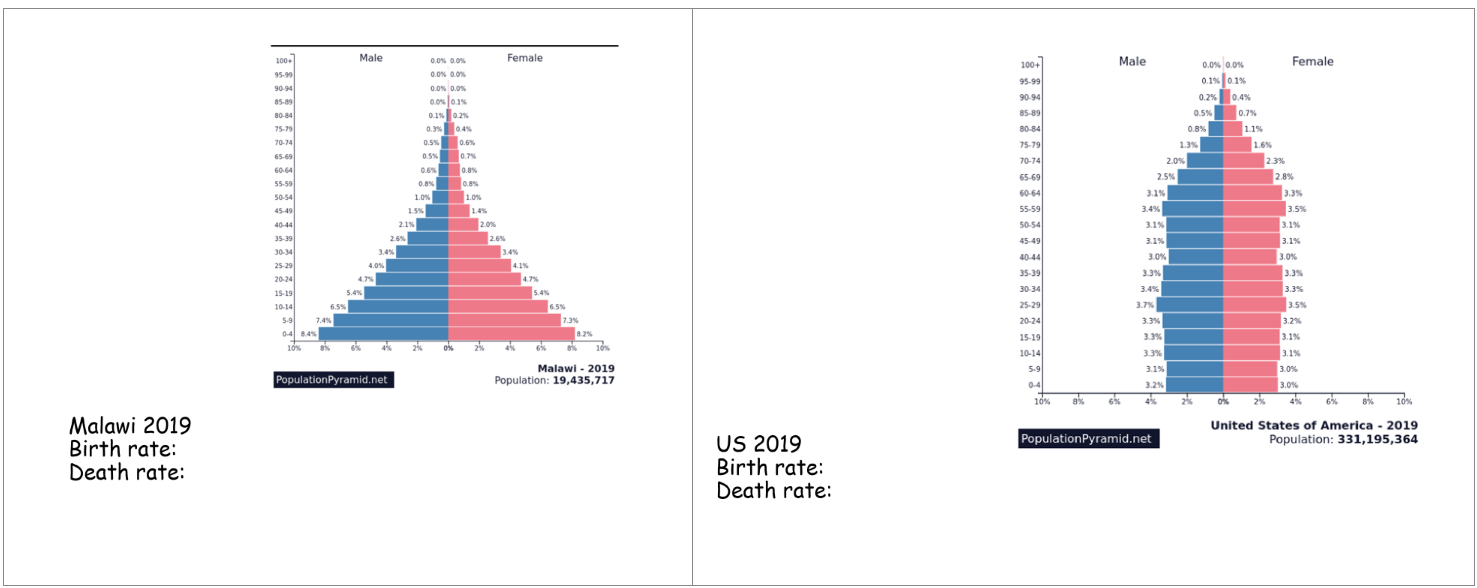
How does gender ratio change with age
At birth: more men
Slightly higher chance of male birth
prenatal sex selection - 1CP
Elderly population: more woman
5 year gap in life expectancy
Higher infant death rate in men
Men are more vulnerable to communicable diseases/genetic disorders/accidents/violence/suicide
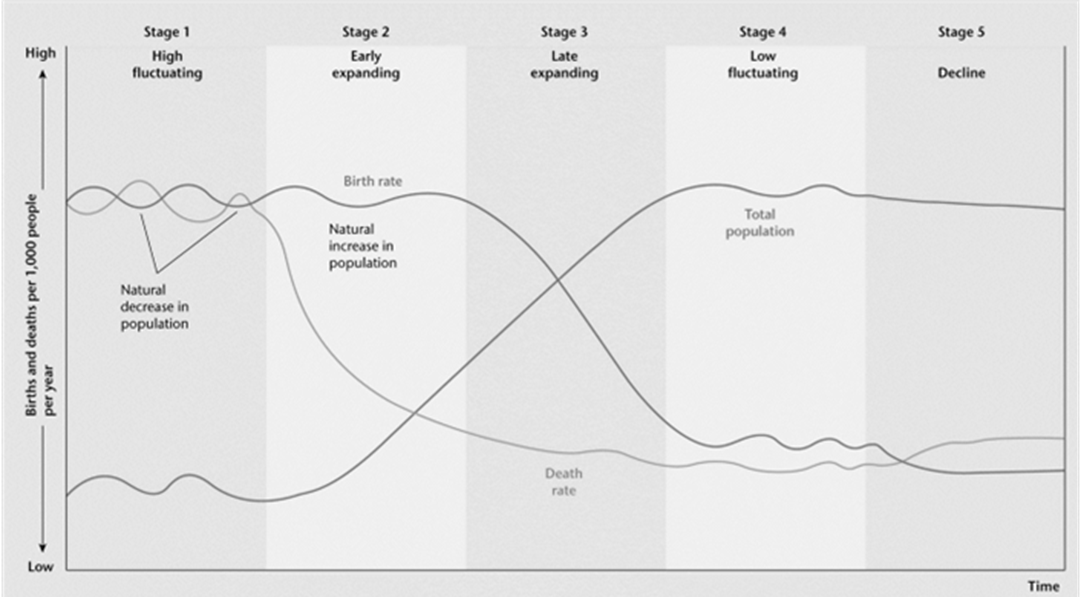
Describe each stage of DTM
Stage1: High birth and death rate - no population change
Stage2: High birth and decreasing death rate - rapid population growth
Stage3: Decreasing birth and low death rate - slower population growth
Stage4: Low birth and lower death rate - very slow/no population growth
Stage5: Lower birth and low death rate - population decline
Evaluation of DTM
DISADVANTAGES
Migration - does not account for migration
Political anomalies - 1CP
Eurocentric model
Impacts of rapid population growth
Low access to infrastructure/education
Higher taxes may be needed
House shortages
Congestion
Growing workforce
Unemployment/underemployment
Higher demand on resources - fossil fuels
Younger voters beliefs - environment/equality
Define distance decay
Number of migrants declines as distances between source area and destination increase
Refugees vs asylum seekers vs Internally displaced persons(IDP)
Refugees: have been granted official refugee status and are legally allowed to stay in destination country due to risks in source country
Asylum seekers: Forced migrants who are yet to be granted refugee status
IDPs: forced migrants who remain in source country
Forced vs Impelled migration by who
W. Peterson
Forced: real threats
Impelled: perceived threats - element of choice remains
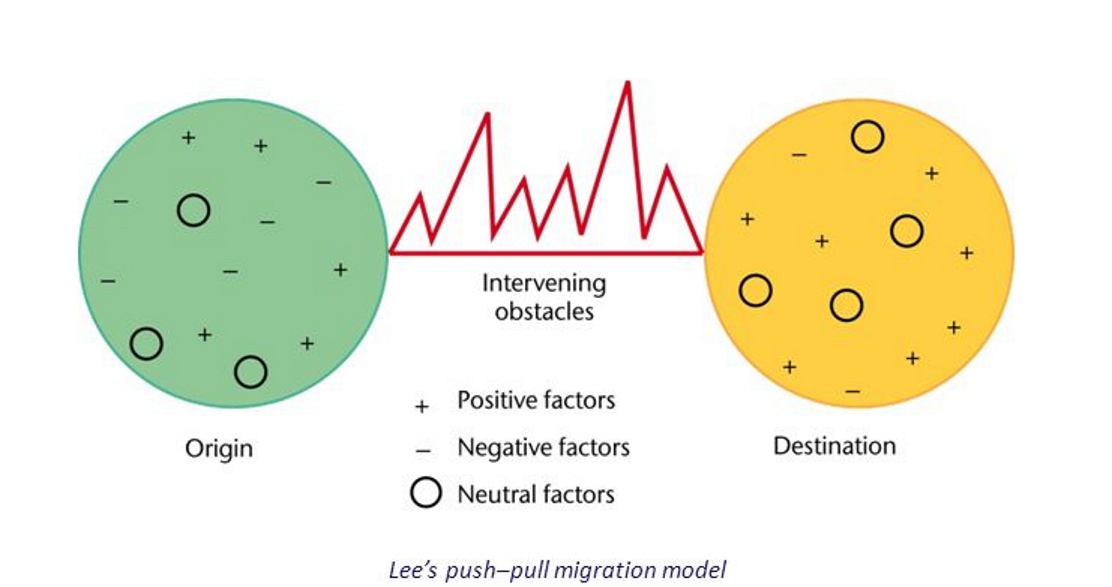
____’s Push-pull migration model
Lee’s 1966 model
If pull factors outweigh the push factors of a particular place and the intervening obstacles can be overcome then migration will take place
Intervening obstacles: cost of travel, leaving family behind, danger