[inc.] Rates and Equilibria
1/98
There's no tags or description
Looks like no tags are added yet.
Name | Mastery | Learn | Test | Matching | Spaced | Call with Kai |
|---|
No analytics yet
Send a link to your students to track their progress
99 Terms
T/F a successful collision is particles colliding in the correct orientation
FALSE. they also need to have enough energy
what happens during an unsuccessful collision
particles collide and bounce off each other
define rate of reaction, and give its units
speed at which reactant concentration decreases or product concentration increases
mol dm-3 s-1
define collision theory
that particles will only react if
they collide in the right orientation
they have energy greater than or equal to the activation energy
define activation energy
the minimum amount of energy required for a successful collision between particles
ways of measuring the rate of a reaction
VISUAL: time taken for precipitate to disappear or form, colour change (colorimeter/light sensor and data logger)
MASS: measuring loss of mass of a reaction over time when a gas is produced (open system apparatus)
VOLUME: measuring volume of gas given off by a reaction over time (gas syringe/balance)
CONC: pH, titration
T/F titration is a way of measuring the rate of reaction
FALSE, during titration you keep adding reactant until there is a colour change, time is not measured
although i think uplearn says it does… keep going to find out !!
T/F the rate of reaction during an experiment is never constant
explain why or why not
TRUE. as reactant concentration decreases, there are less reactant molecules to react with each other, so lower frequency of successful collisions, so a lower rate of reaction. rate is constantly changing.
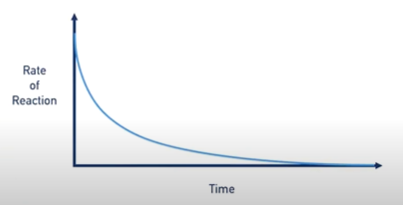
why is the clock experiment a useful experiment
as previously discussed the rate of reaction changes during the reaction
so the true rate of reaction is the initial rate, before the concentration of substances starts to change
in a clock reaction, a colour change happens when a small proportion of reactants have reacted
so the rate of reaction is barely affected by decreasing reactant concentration
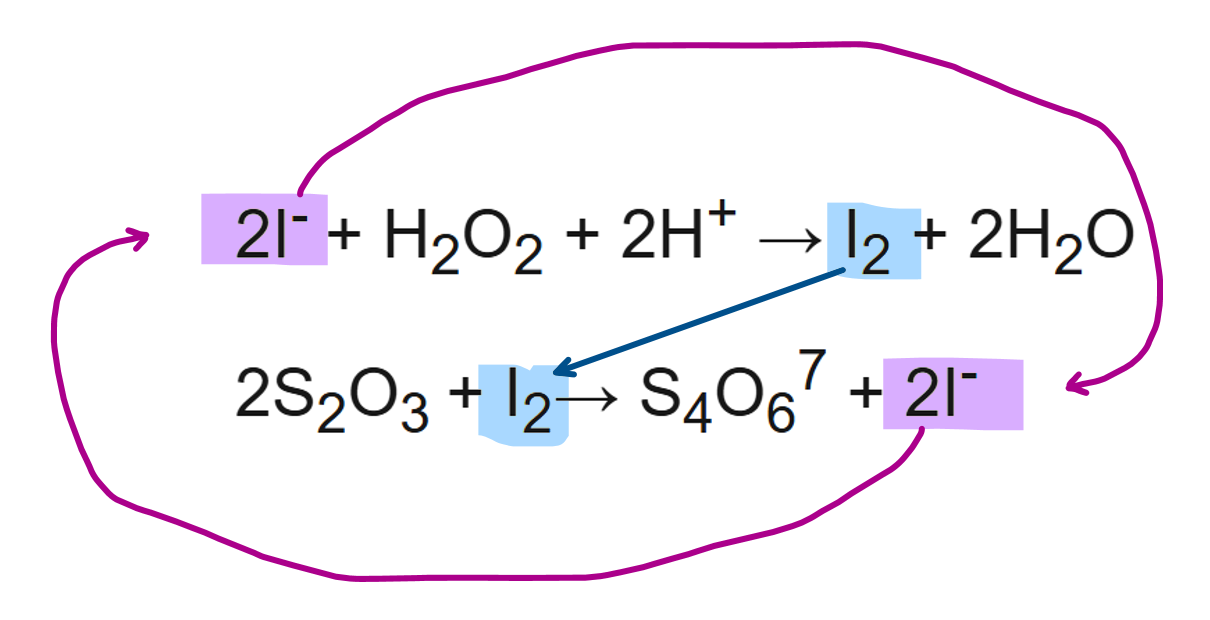
describe an iodine clock reaction (3)
I- ions react with hydrogen peroxide to form I2.
these I2 immediately reacts with S2O32- ions to form I- again, preventing them from turning starch indicator blue black
only after all the thiosulfate ions have reacted, is there any I2 remaining which turns starch indicator blue black
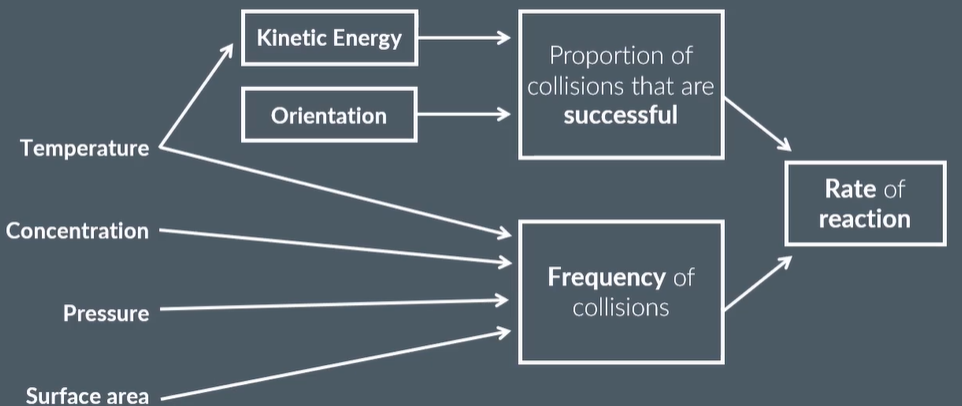
factors that affect rate of reaction
temperature
concentration (liquids)
pressure (gases)
surface area (solids)
describe how to carry out an iodine clock reaction
add K2S2O8 into the small beaker
add KI, H2O, Na2S2O3 and starch into the large beaker
pour the small beaker into the big beaker, immediately start the stopwatch and stir
wait for the colour change into blue-black
stop the timer and record the time
repeat the experiment with different volumes of water and potassium iodide in the big beaker.
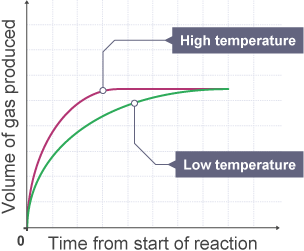
explain how temperature affects the rate of reaction
particles have more kinetic energy
so more particles will have the required activation energy and can react
so there will be a higher proportion of collisions with enough energy to react
so rate increases
and,
increasing kinetic energy means particles move faster
this increases the frequency of collisions, thus frequency of successful collisions increases
so rate increases
define catalyst
a substance that increases the rate of reaction
that is not used up in the reaction
or permanently chemically changed.
it lowers the activation energy by providing an alternative reaction pathway /
OR it provides lower activation energy through alternative reaction pathway with lower Ea
so that more a greater proportion of molecules have more energy greater than/equal to activation energy ✓
UPLEARN SAYS IT DOES NOT LOWER EA except PMT accepts that
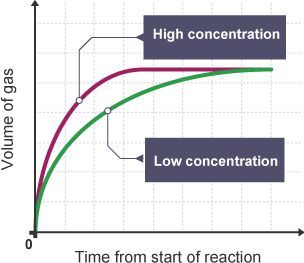
explain how concentration affects the rate of reaction
increasing concentration means there are more reactant particles in the same volme of liquid
so more frequent collisions
and the rate increases
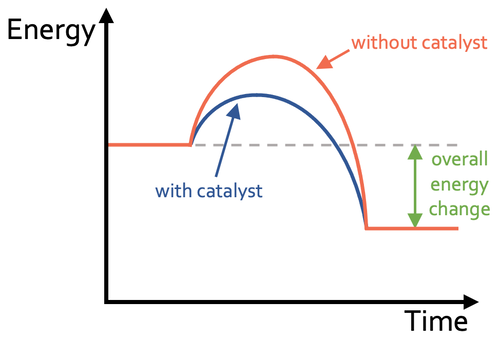
this is the graph of a reaction with a catalyst
copy this graph, and draw the rate graph for without the catalyst
In this reaction, which substance is a catalyst?
One mole of E-but-2-ene gas is heated with one mole of solid platinum. When one mole of hydrogen gas is added, a reaction takes place. At the end of the reaction, there is one mole of butane gas, and one mole of nickel.
Pt is the catalyst
its not hydrogen, because the reaction will not take place without hydrogen
there is the same amount at the end.
T/F higher concentration means there will be a higher proportion of successful collisions
FALSE. because concentration does not affect the kinetic energy or orientation of particles
temperature does! pressure does not, neither does surface area
sure, though, if there’s a higher freq of collision there’s a higher freq of successful collisions, but the PROPORTION does not increase
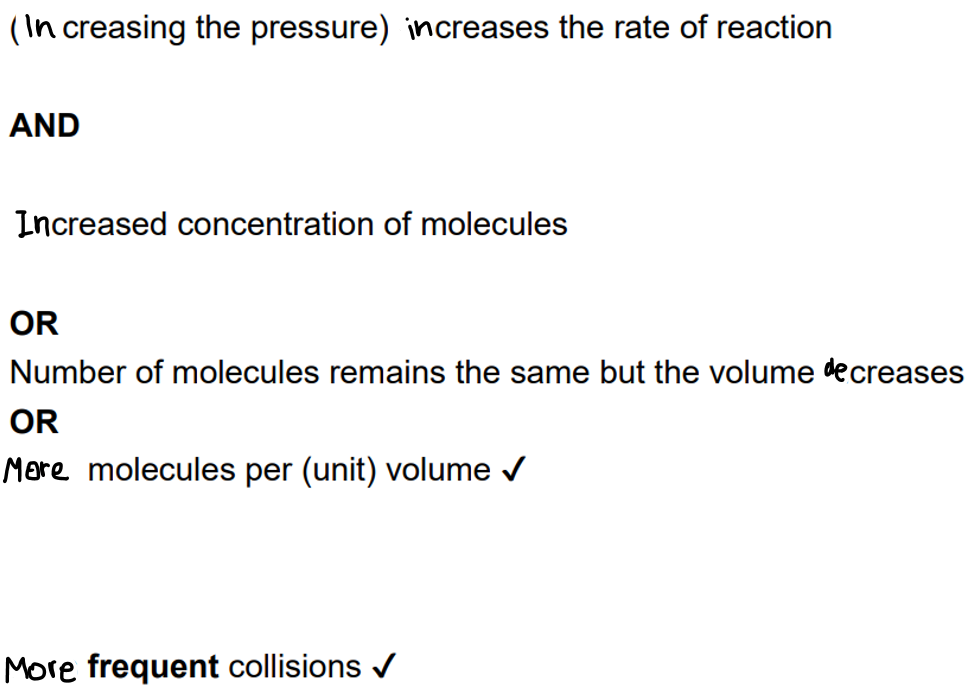
explain how pressure affects the rate of reaction [3]
explain how surface area affects the rate of reaction
larger surface area means higher frequency of collisions that can take place
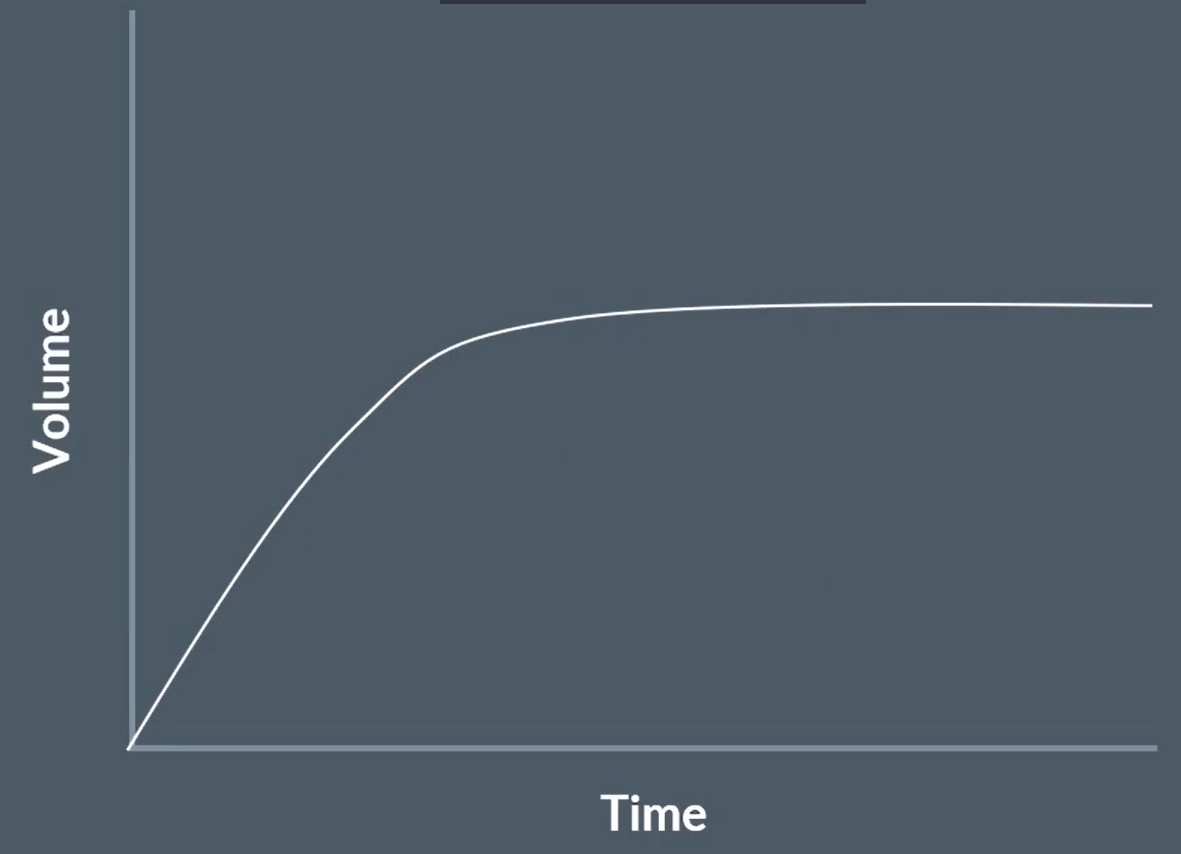
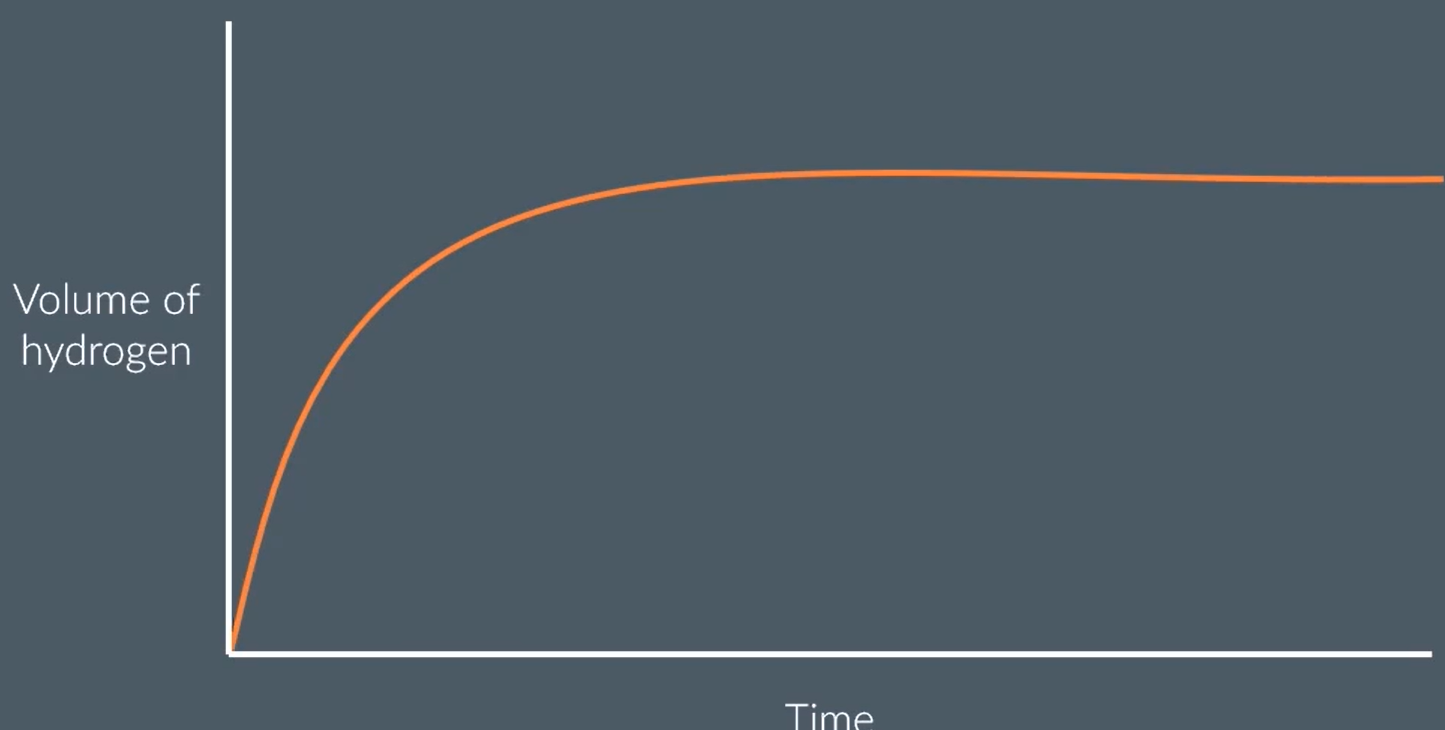
Zn + 2HCl → ZnCl2 + H2
sketch a graph of volume of hydrogen produced over time for this reaction
eplain the shape of the graph
at the start, there is a high concentration of reactant particles, that collide most frequently to produce a high rate of reaction. steepest gradient.
as time goes on, there are fewer and fewer Zn and HCl particles remaining as many have reacted to form the product. the concentration of HCl decreases, so fewer successful collisions. rate of reaction decreases
the graph plateaus eventually when all the reactant has been used up and the reaction has finished

in his exam paper, john reads the question:
“the graph shows that a rate of reaction decreases over time. explain why.”
john writes this in response to a question:
concentration decreases, so there are less collisions
improve his answer
concentration (of acid) decreases
DO NOT ACCEPT LESS COLLISIONS, BECAUSE THAT ISN’T LINKED TO RATE
instead: less frequent collisions
explain three types of catalysts
homogeneous — catalyst is in the same phase/physical state as reactants
heterogeneous — catalyst is in a different phase/physical state as reactants
autocatalysis — one of the products acts as a catalyst
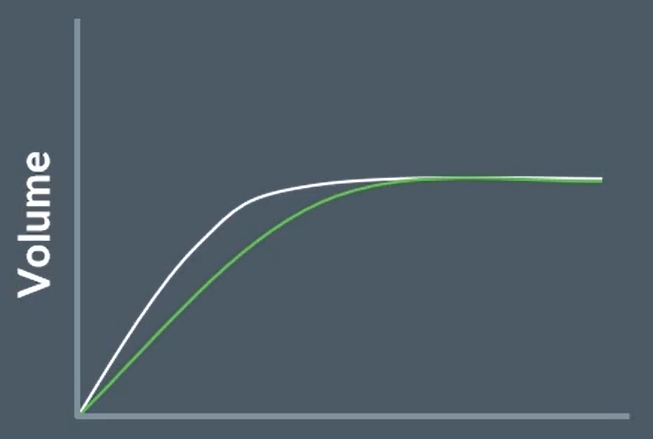
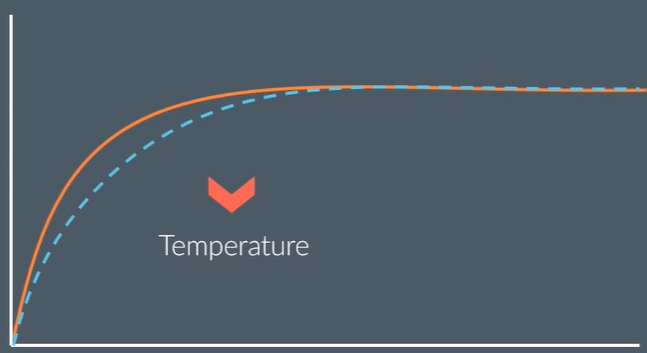
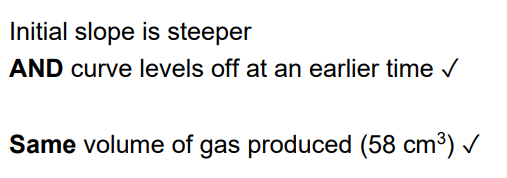
draw this graph at a lower temperature
explain why
decreasing temperature decreases the rate of reaction, so gas is produced more slowly, so gradient decreases
the final volume of hydrogen is not changed because this doesn’t affect how much is being produced

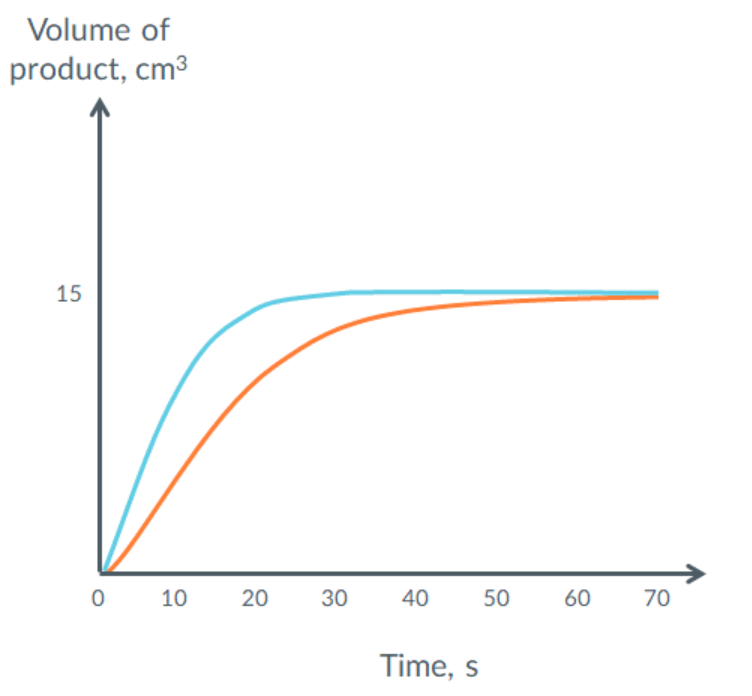
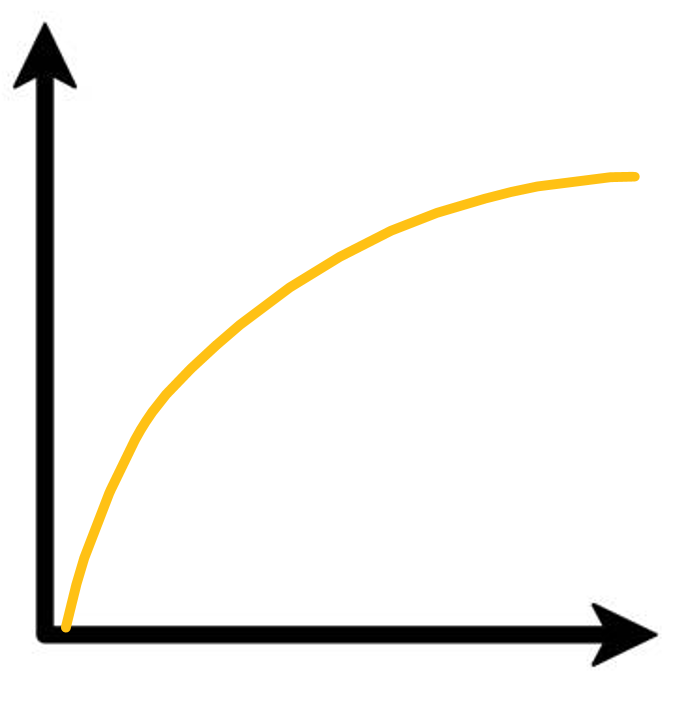
this shows the volume of product formed during a reaction.
describe and explain, in words, what this graph would look like at lower pressure.
(orange)
less particles per volume OR less volume same particles
less frequent collisions
so (initial) rate is slower and curve is less steep
so takes longer time to plateau
volume of product is not changed, so plateaus at the same volume of hydrogen produced
john has written the following statement:
a catalyst provides an alternative route. this has a lower activation energy. all reactant particles now undergo this reaction
improve his answer
homogeneous
particles can still undergo the direct route — its just not common
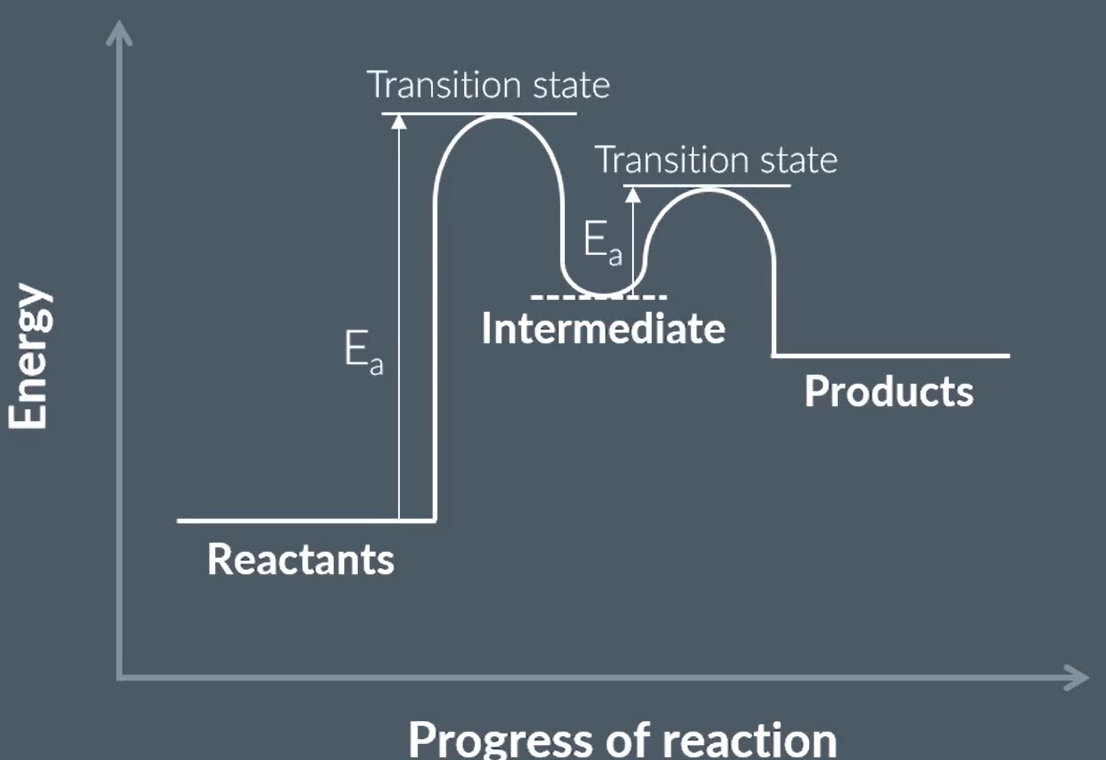
explain how homogeneous catalysts work (4)
same phase as reactants
produces an intermediate
provides an alternative route which has a lower activation energy
so more particles have the required activation energy or greater and can react
so a higher proportion and frequency of successful collisions
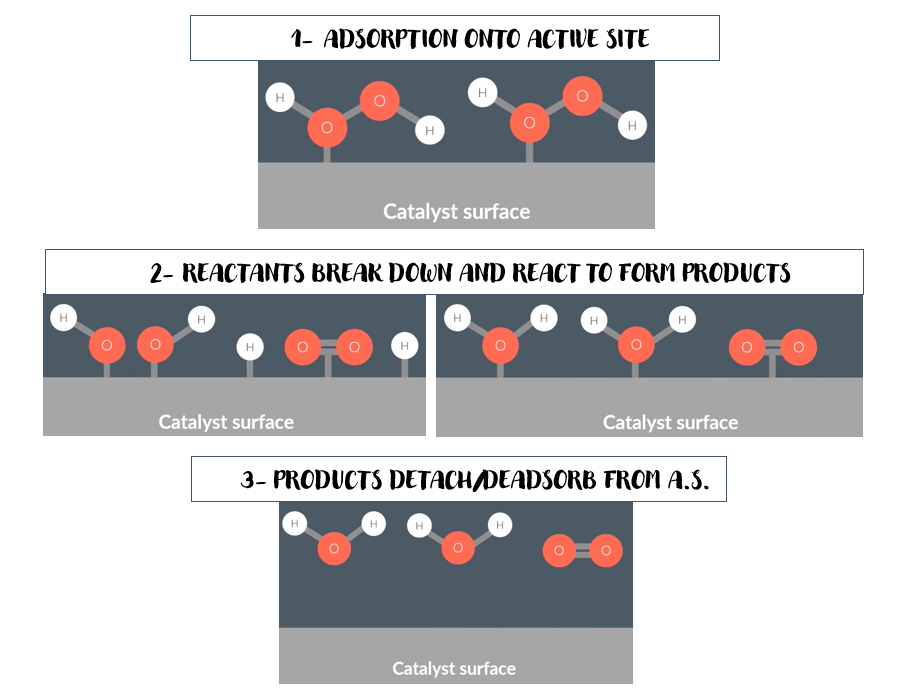
explain how heterogeneous catalysts work
the reactant forms weak bonds with atoms on catalyst surface (ADSORPTION ONTO ACTIVE SITE)
the reactant breaks down/react on the surface of the catalyst
products form on the active site
the products desorp/dettach from the surface
interesting
T/F changing the surface area, pressure or concentration of catalyst can change the rate of reaction
TRUE
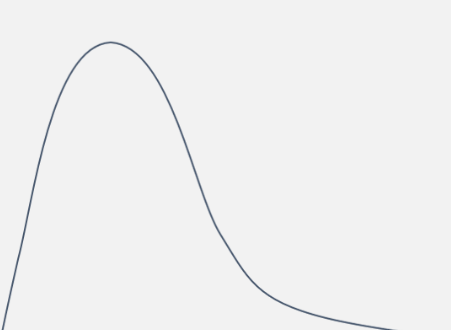
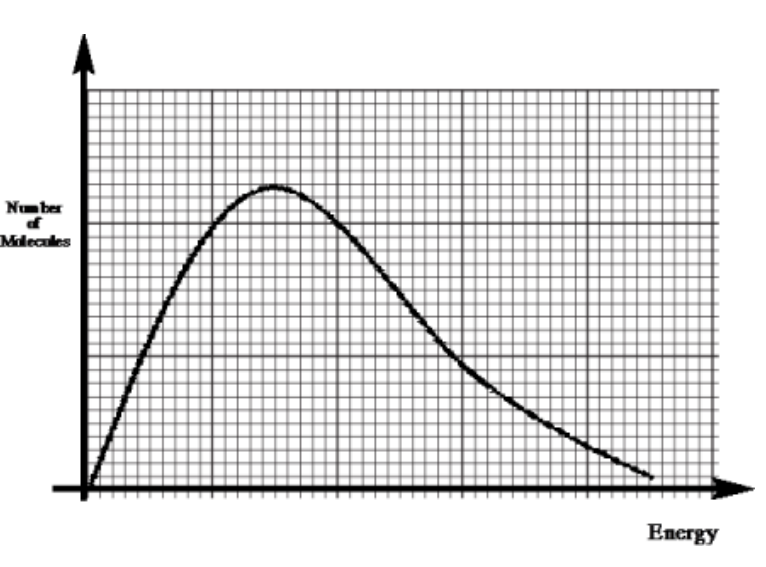
what graph is this shape, used in kinetics?
and what does it show?
a Maxwell-Boltzmann distribution
shows the distribution of energy of all the particles in a sample of gas
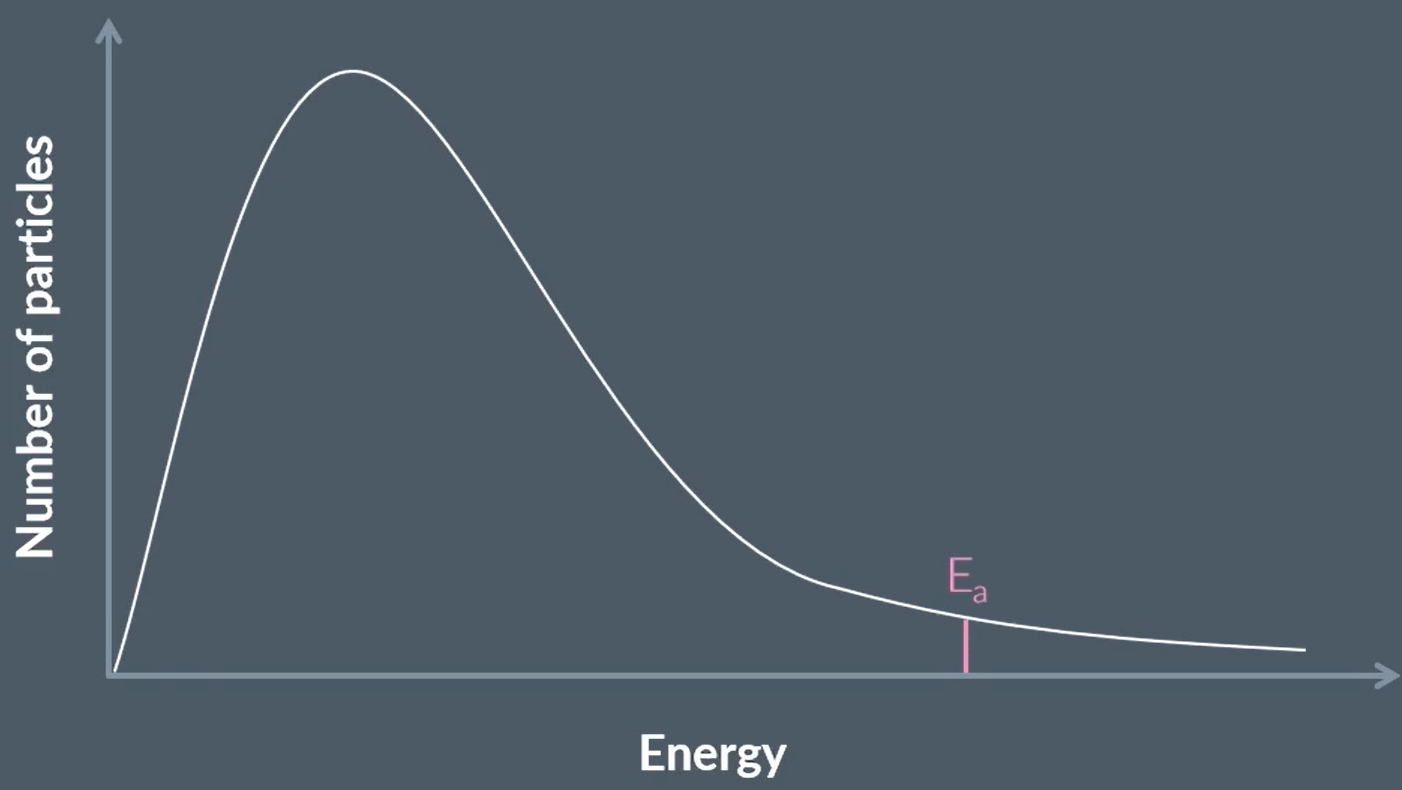
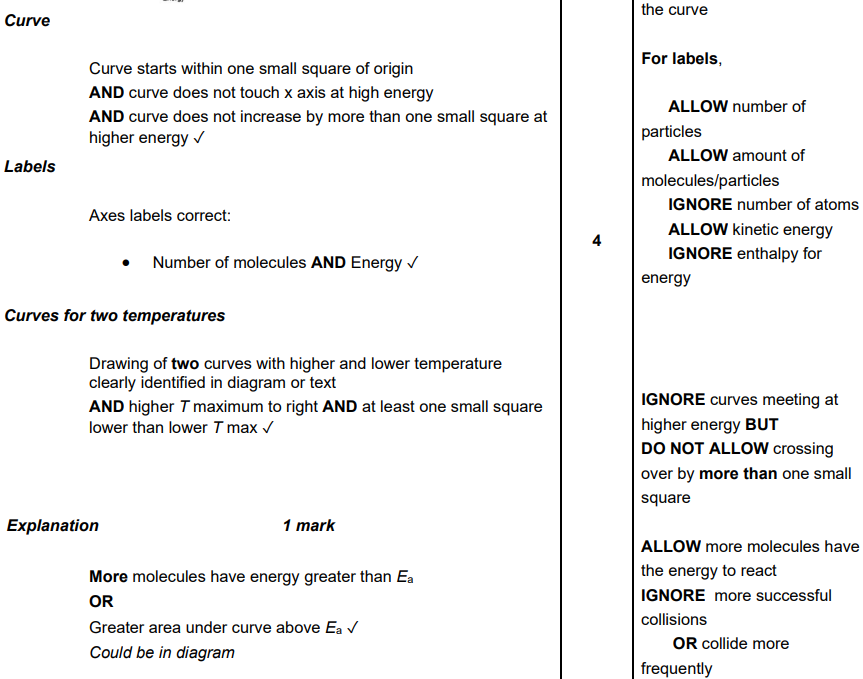
draw a generic maxwell boltmann distribution (4)
(1) for labels of axes - number of particles and energy
(1) for the shape (skewed to the left) and starting at 0,0
(1) for NOT touching the x axis at the end
(1) for labelling Ea

do maxwell boltzmann distribution curves start at the origin? why?
yes, because all particles have some kinetic energy, so 0 particles have 0 kinetic energy
why does the curve not touch the x-axis
a small number of particles have extremely high energy levels
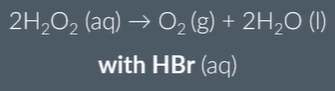
is HBr a homo- or heterogeneous catalyst
homogeneous (reactants in same phase)
draw and label a maxwell distribution curve
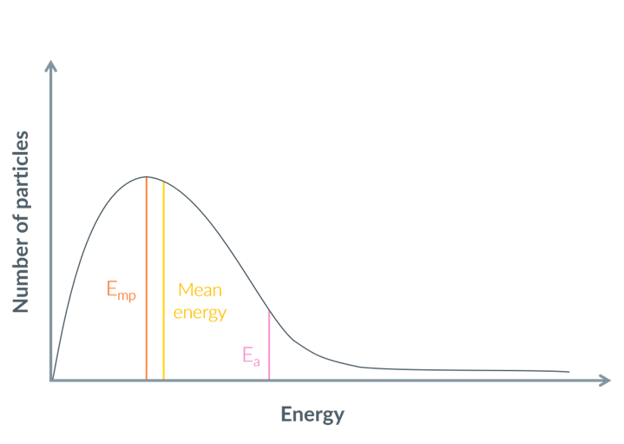
what does the area under the maxwell-boltzmann distribution represent
the total number of particles in the gas
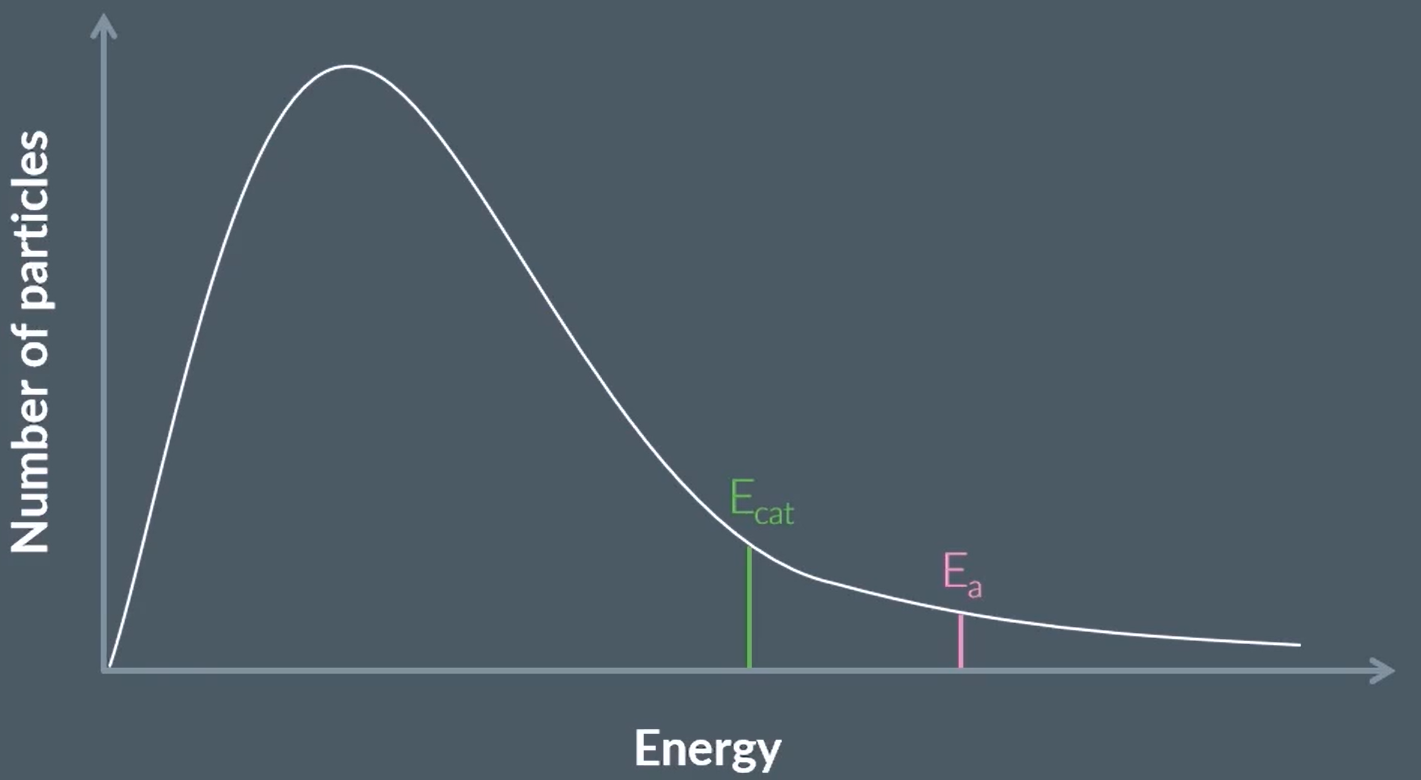
if there are so few particles with the required activation energy, why isn’t the percentage yield like 1%
particles to the left of the Ea can gain kinetic energy through unsuccessful collisions (1).
as a result they have the required activation energy or more and can react (1)
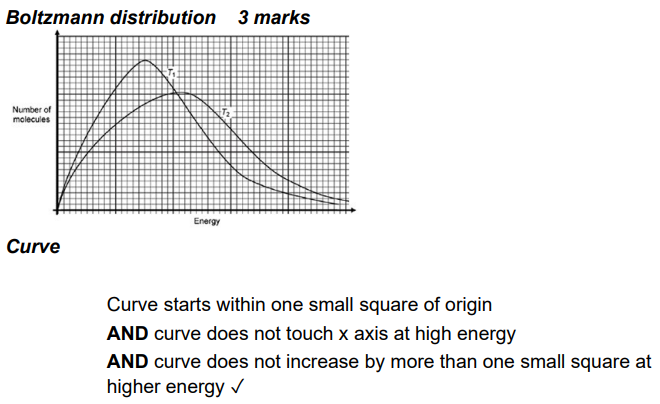
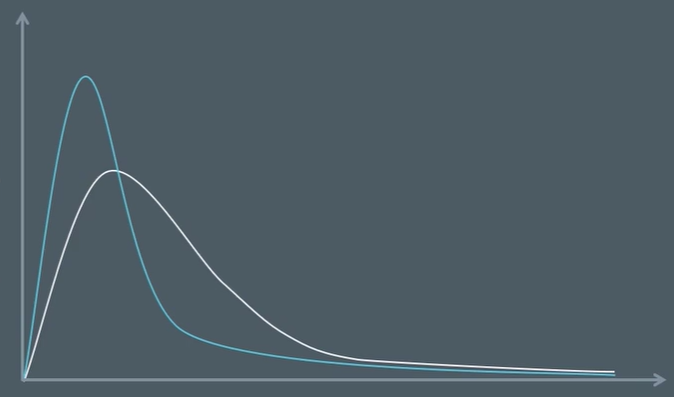
what is the effect of increasing the temp on a max-bolt curve. NOT the rate
you may use a diagram to help you.
the peak moves to the right, get lower and wider.
the Emp (most probable energy) will increase
the number of particles with the Emp will decrease (I guess the energy of particles is more evenly distributed, and because the area under the curve has to stay the same.)
the area under the curve will remain the same
DIAGRAM:
look outside!!
see the lights as they shine on the seeeea it caaaalls meeee…
okaay
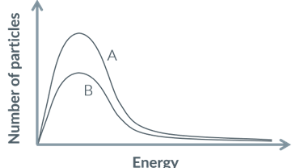
what is the effect of decreasing the number of particles on a max-bolt curve and thus the rate
you may use a diagram to help you (4)
the peak moves downwards but the overall graph stays the same.
the Emp (most probable energy) will stay the same
the number of particles with the Emp will decrease
the area under the curve will decrease
EXPLANATION:
decreasing the number of particles decreases the pressure, so there are fewer collisions and a lower frequency of successful collisions. so the rate decreases
T/F: the area under the curve decreases if gas particles are released from the container
TRUE. volume increases, pressure decreases, and there are less successful collisions
apparently. idak 😭😭
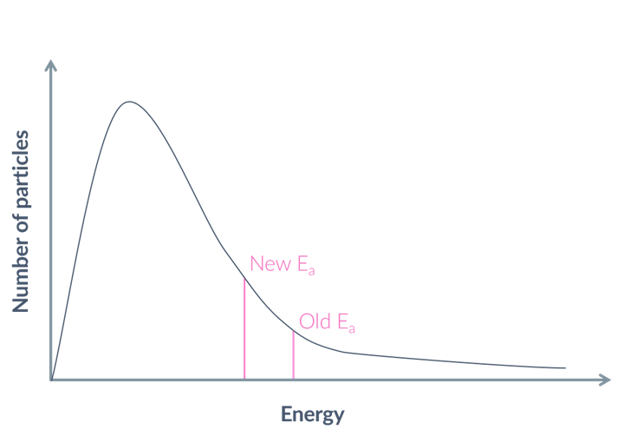
what is the outcome of a lower activation energy?
a faster rate of reaction, because more particles have the required activation energy or more, so there is a higher proportion of successful collisions
explain why the peak of the curve is higher
a large number of particles will have low energies
give an example of a homo and heterogeneous catalyst reaction
homogeneous: alcohol and carboxylic acid to form an ester and water with a H+ (aq) catalyst
heterogeneous: contact process uses solid V2O5 as a catalyst OR haber process uses solid Fe
draw a general max-bolt distribution curve.
then draw the same curve at a lower temperature
(1) for axis leabels
(1) for shape of general
(1) for shape of Tlower but it must be roughly the same area
draw this reaction with a catalyst

draw this with a catalyst
trick question! you’ll see why in a minute
draw this energy profile with a HETEROGENEOUS catalyst
draw an energy profile with a HOMOGENEOUS catalyst
advantages of catalysts
speed the rate of reaction so lower temperatures and pressures can be used
thus saving energy costs as lower energy demand
thus meaning less CO2 emissions from burning fossil fuels
uses different reactions with better atom economy and less waste
don’t require specific conditions
A reaction in the presence of a ____ catalyst has a lower _____ than the original reaction, so the curve on the reaction profile is ____
A reaction in the presence of a _____ catalyst takes place via an _____ so it has two curves and two _____
a reaction with heterogeneous catalyst has a lower activation energy that original so the curve is lower
a reaction with homogeneous catalyst takes place via a intermediate so has two curves and 2 transition states
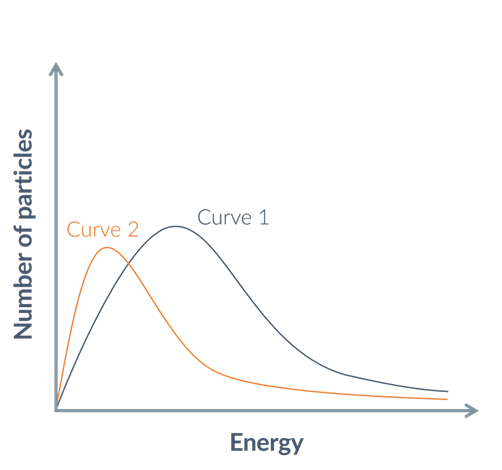
what condition change(s) has happened from curve 1 to curve 2, and how does this affect the rate
temperature decreased
number of particles decreased
rate decreased
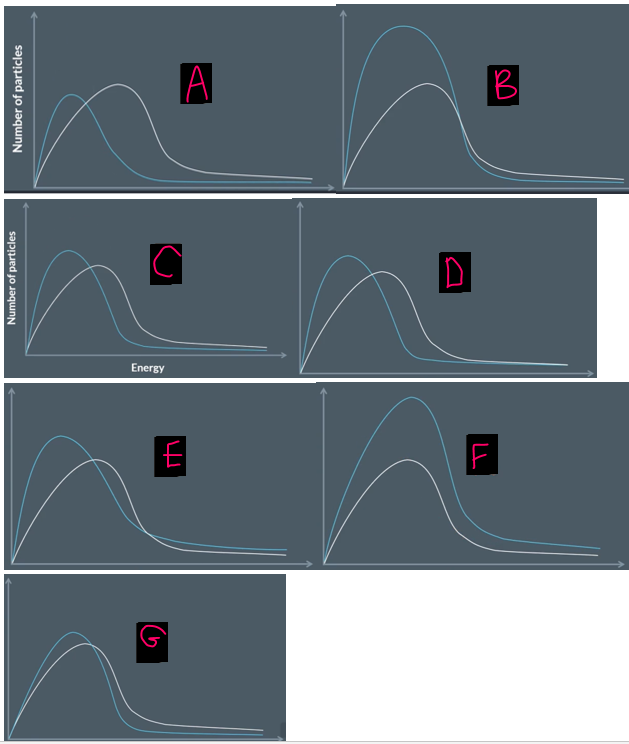
these graphs all show the max-bolt distribution of particles at different temperatures. some of these curves are wrong.
explain which and why
A is wrong- area under curve is not the same (OR peak is meant to be higher at low temperatures)
B is wrong for the same reason
C is correct!
D is wrong because the graphs shouldn’t touch near the end
E is wrong because the graphs should onyl cross each other once
F is wrong for the same reason (they don’t cross at all, they should cross 1nce)
G is wrong because the curves don’t diverge immediately
five rules for drawing max-bolt curves
at low temps, the peak must be higher, narrower and left
area under the curve must be the same at all temps
curve must start at the origin and diverge almost immediately from the original curve
the second cuve should cross the original curve EXACTLY once
the second curve shouldn’t touch the original curve as it nears the horizontal axis
iron is submerged in hydrochloric acid solution. The reaction forms a yellow iron (III) chloride solution as well as another product. How might we measure the rate of this reaction?
Fe + 3HCl → FeCl3 + 1.5H2
use a gas syringe to measure the volume of hydrogen gas produced
use a colorimeter to identify when the colour change occurs
use a pH meter to measure acid strength
use titration to measure concentration of the solution (of acid i’m guessing)
use a mass balance to measure the change in mass
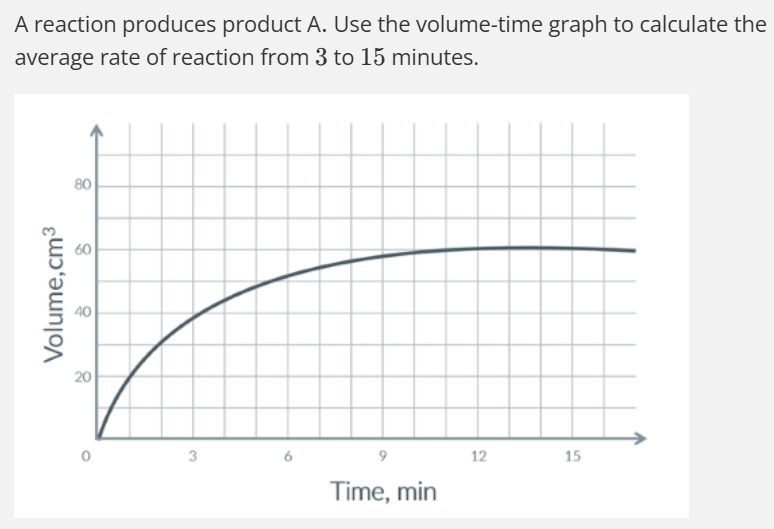
UNITS
1.67 cm3 min-1
find the initial rate of this reaction
I got 0.0125
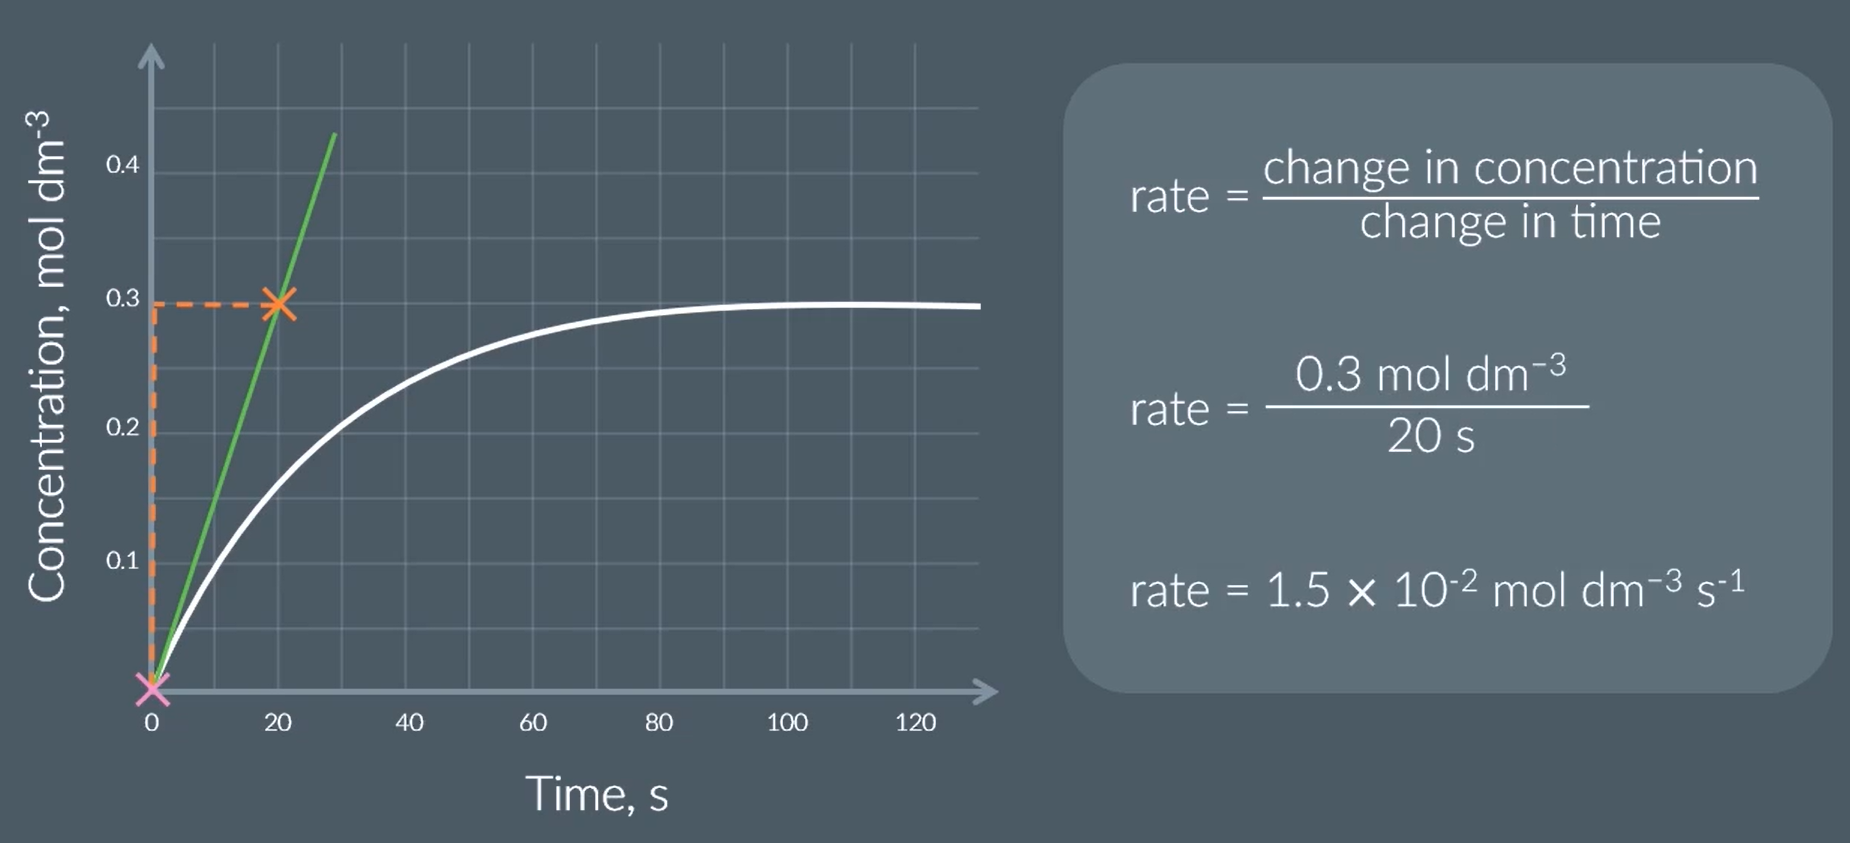
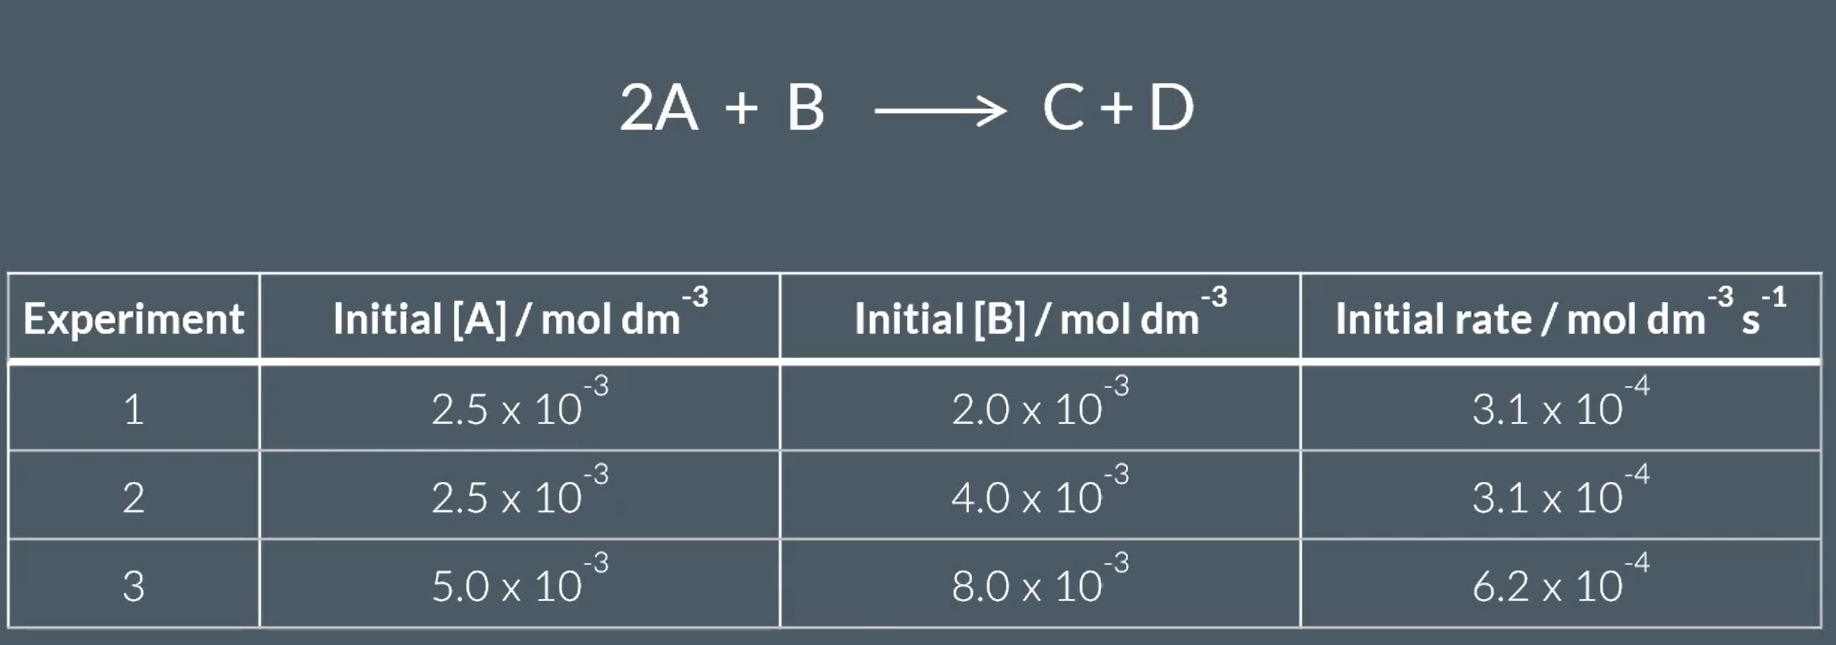
from this, find the orders of reaction
rate = k[A]X[B]Y
when the conc of B doubles, the rate stays the same.
so the reaction is 0th order with respect to B
when the conc of A (and B, but that doesn’t affect as we’ve just worked out) doubles, the rate doubles
this the reaction is 1st order w respect to A
so rate = k [A]1 [B]0
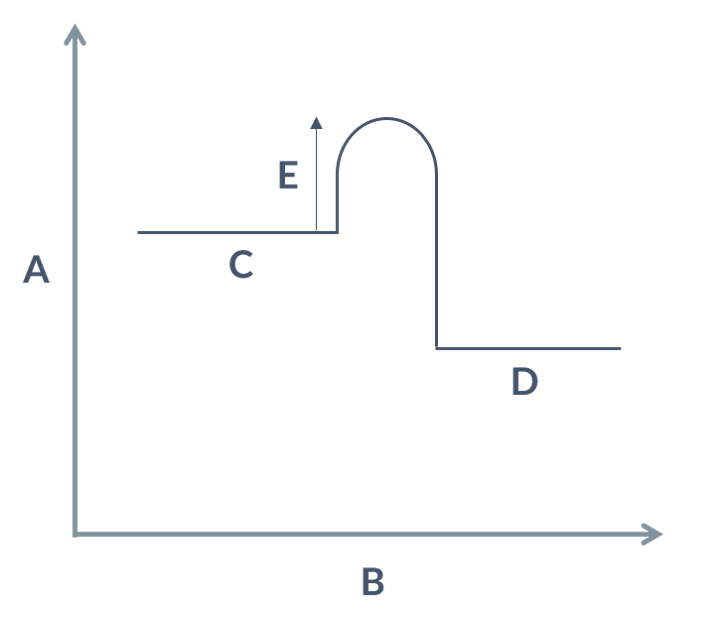
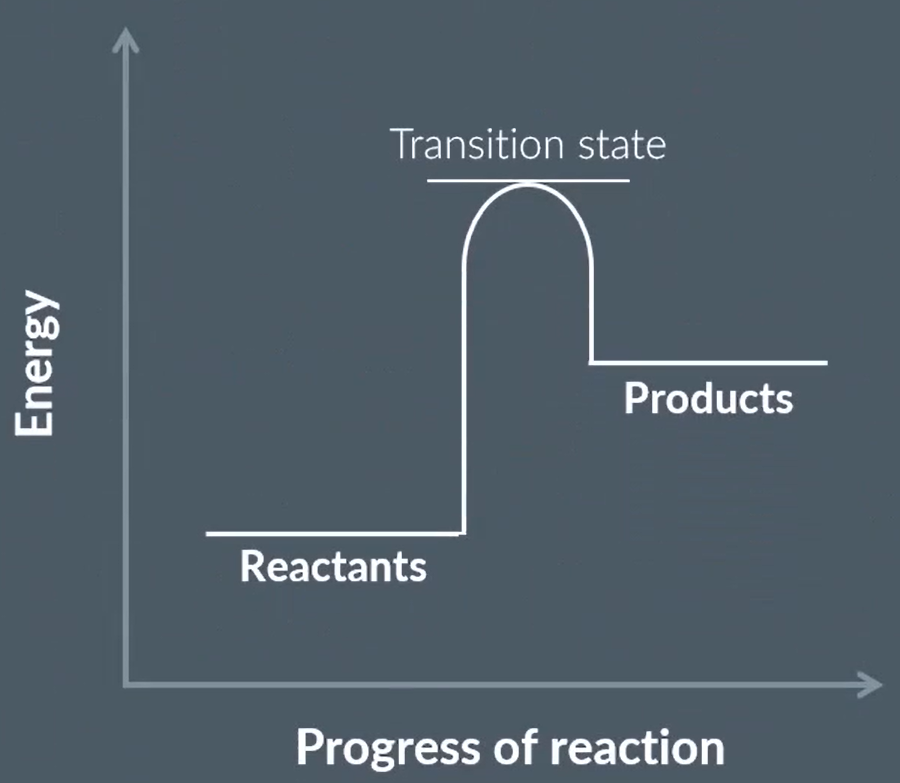
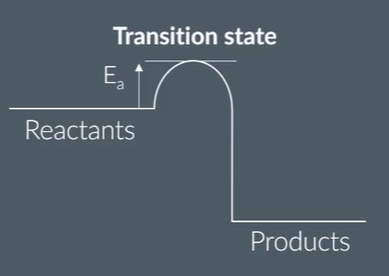
label the letters.
what is this diagram called?
is this for an endo or exothermic reaction?
A- energy
B- progress of reaction
C- reactants
D- products
E- activation energy
energy profile
exothermic
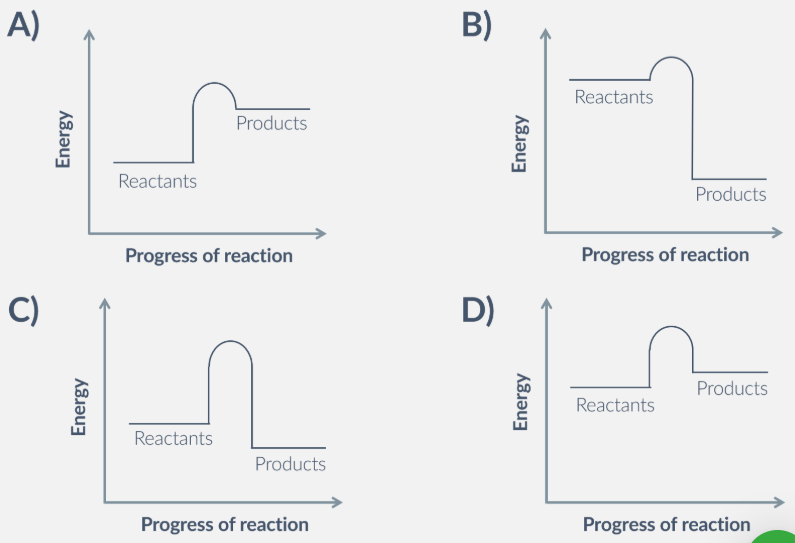
which of these reactions happens at the fastest rate, and why?
B. because the reaction has the lowest activation energy.
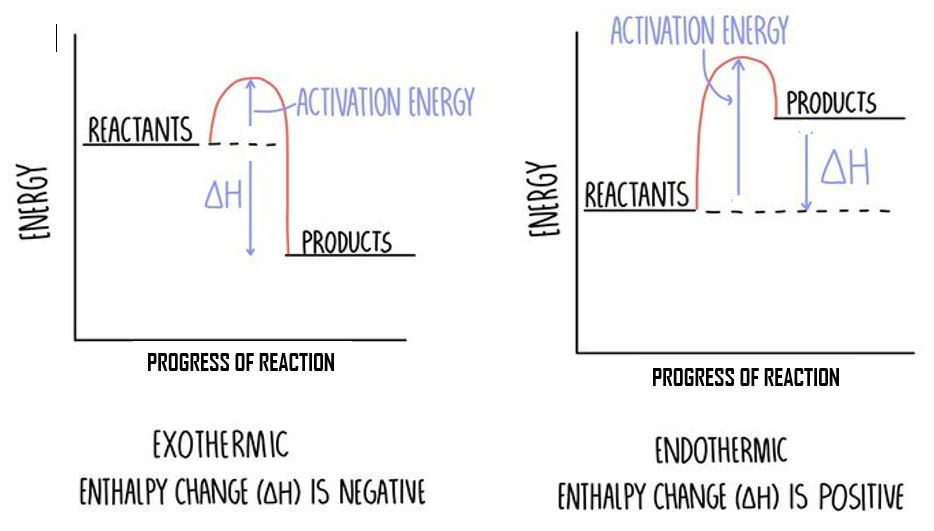
draw AND LABEL the reaction profile for a 1. endothermic and 2. exothermic reaction
(1) for axis labels - energy and progress
(1) for line labels
(1) for deltaH and Ea correct
(1) for endo and exo the correct way around
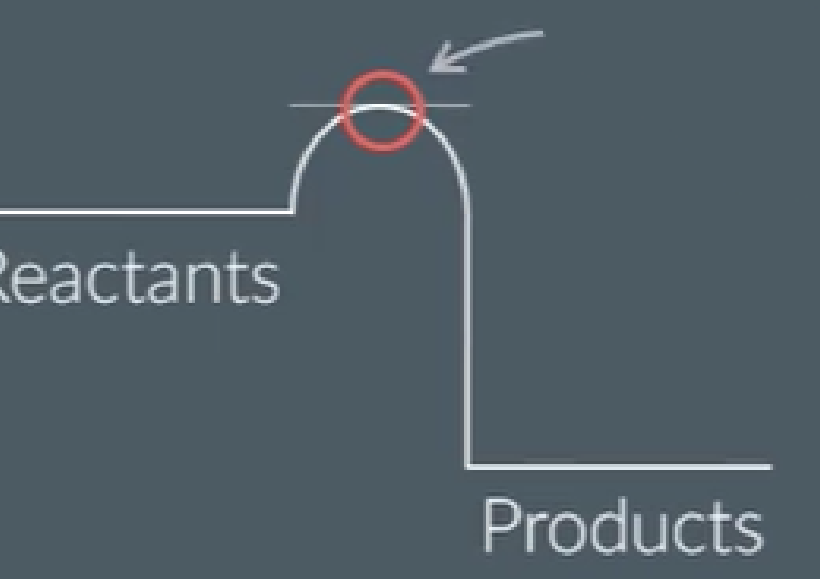
what is this point called?
what happens here?
the transition state is the point of
highest energy
where reaction is halfway between reactants and products
reactant bonds have broken, and products start to form
explain why the transition state is the point of highest energy
it is when the reactants’ bonds have broken
bond breaking is an exothermic process so requires more energy
it is just before bonds are made/product formed
which releases energy
the start of equilibria
okaybro
features of dynamic equilibrum
closed system
concentration of reactants and products are CONSTANT, (not necessarily the same)
rate of forward and backward reaction is equal
N2 + O2 ⇌ 2NO +66.4kJmol-1
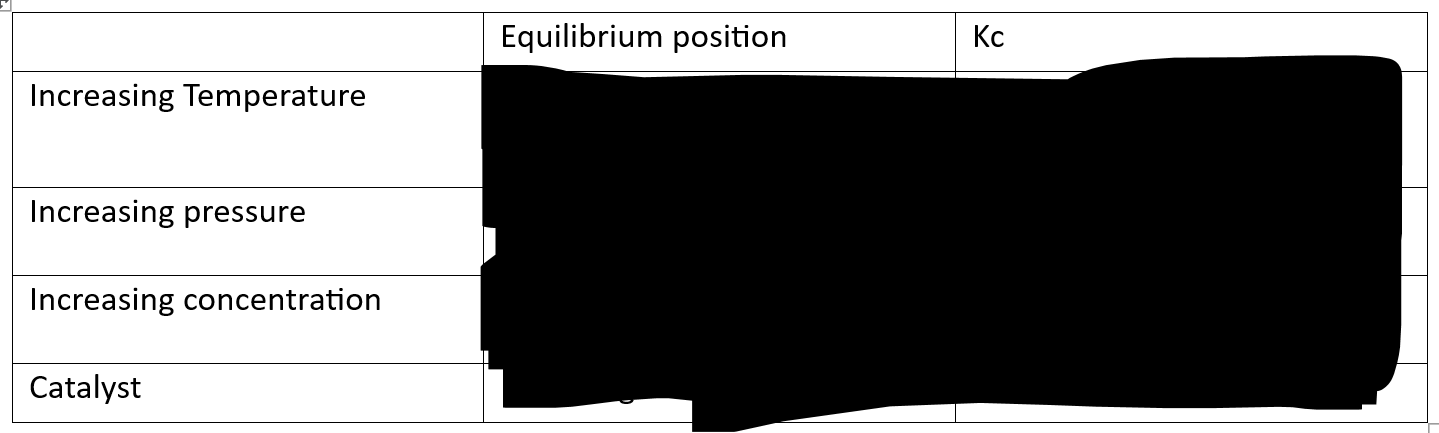
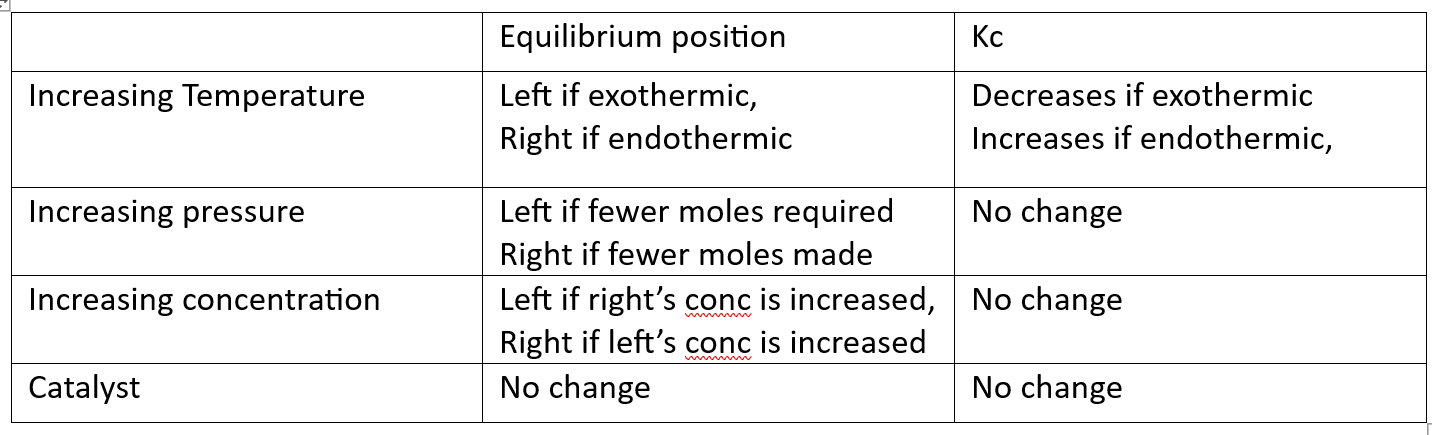
what happens to the equilibrium position if
we add NO
the temperature increases
the pressure increases
add O2
volume of reaction mixture increases
we add a catalyst
shifts left
shifts right
no change
shifts right
no change
no change
define le chat’s principle
when equilibrium is disturbed, the equilibrium shifts to minimise effects of the change
how does a catalyst affect the rate of the forward and backwards reaction?
and thus does it affect equilibrium position
it increases the rates of both forward and backward reactions, equally
so does not change EP
a reaction runs under 600oC and has 85% yield. data shows that when 100oC is used, there is a 90% yield.
explain why manufacturers carry out the reaction at 600C
to increase the rate of reaction
and the yield does not improve that much with lower temperatures
a reaction runs under 2000kPa and has 85% yield. data shows that when 5000kPa is used, there is a 95% yield.
explain why manufacturers carry out the reaction at 2000kPa
the equipment and energy needed to reach and maintain the high pressure is too expensive
too high pressure is dangerous and high risk of explosions and leakage
What you do need to know is that Le Chatelier’s Principle allows us to predict how the equilibrium position will move. It doesn’t give a full explanation as to why. (because it don’t got no brain so it can’t choose to counteract change!)
👍👍👍👍
model answer
1- state relevant features
if temperature: which is exothermic
if pressure: which has more moles?
2- movement of EP
3- why the EP moves
to counteract the increase/decrease in pressure/temperature
4- yield
if left, decreases equilibrium yield
if right, increases equilibrium yield
yield of reactants/products increases
F Me Will You
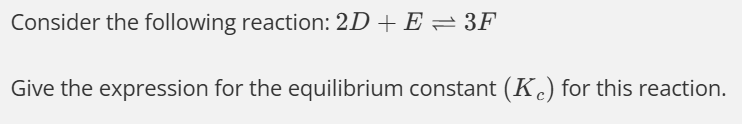
KC = [F]3 / [E] [D]2
SO3 g + H2O g ⇌ H2SO4 l
at equilibrium [SO3] = 0.400 mol dm-3
[H2O] = 0.480 mol dm-3
and [H2SO4] = 0.600 mol dm-3
express the equilibrium constant
find the value of the equilibrium constant
H2SO4 IS A LIQUID AND LIQUIDS DON’T COUNT
1 / [SO3] [H2O]
1 / 0.48 × 0.4
5.21 dm6 mol-2
sigfigs and units mark
I2 + H2 ⇌ 2HI
there are 0.21 moles of HI, 0.03 moles of H2 and 0.03 moles of I2.
calculate KC
you CAN calculate it, despite the lack of concentration!
because the SUM of the MOLES on both sides of the reaction is the SAME
so the CONCENTRATION doesn’t matter!
SO 0.212 / 0.032
49 no units
what is Kc and how does it link to the equilibrium position
Kc is the equilibrium constant.
when Kc < 1 the equilibrium position is on the left
when Kc = 1 the equilibrium position is in the middle
when Kc > 1 the equilibrium position is on the right
explain the two types of equilibria
homogeneous: when the substances in a reaction at equilibrium are at the same phase
heterogeneous: when the substances in a reaction at equilibrium are in different phases
co (g) + h2o (g) ⇌ co2 (g) + h2 (g)
1.60 moles of CO and 4.00 moles of CO2 and 4.00 moles of H2 and 1.60 moles H2O are found in an 8000cm3 container at 690C at equilibrium. calculate the value of the equilibrium constant.
convert moles to concentration (mol/vol)
[CO] = 0.2 mol dm-3
[H2O] = 0.2 mol dm-3
[CO2] = 0.5 mol dm-3
[H2] = 0.5 mol dm-3
then: 0.5 × 0.5 / 0.2 × 0.2
= 6.25 no units
at these KC values, where does the equilibrium lie?
-1
0
2
0.5
3.5
KC CANNOT BE NEGATIVE !
KC CANNOT BE ZERO! EQUILIBRIUM IS AT 1!
2 > 1 so right
0.5 < 1 so left
3.5 > 1 so right
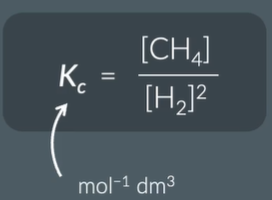
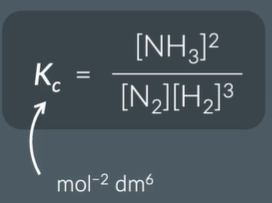
express KC
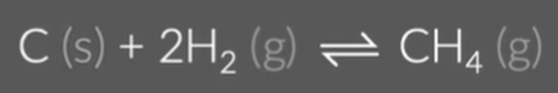
and find the units
why do we not include solids or liquids in the KC expression
their concentrations do not change throughout the reaction
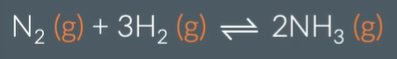
give the units for the KC value
what affects the equilibrium position
what affects the equilibrium constant
changes in temperature, pressure and concentration affect the equilibrium position (as per le chat’s)
ONLY temperature changes affect KC
N2O4 ⇋ 2NO2 +57.9kJmol-1
explain how does increasing temperature affect KC of this reaction (3)
when temperature increases, the equilibrium position moves in the direction of endothermic reaction
so for an endothermic forward reaction, it shifts to the right
products concentration increases as a result of that
Kc = products↑↑↑ / reactants↓↓↓
so Kc increases
b-but i thought that kc determined ep not the other way…
##
##
!! QUESTION IS BASED OFF MANY PMT QUESTIONS, SO TREAT AS AN EXAM Q
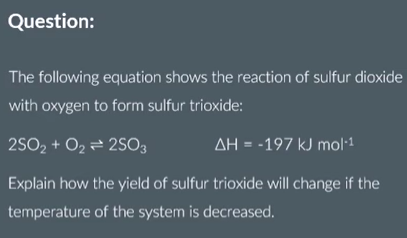
2SO2 + O2 ⇋ 2SO3 ΔH = -197.4kJ
a) explain the conditions of low temperature and high pressure would be used to obtain the maximum equilibrium yield of sulfur trioxide.
b) explain why actual conditions used in the industry may be different from the conditions needed for a maximum equilibrium yield
a) Using the FMWY method
Temperature:
Feature: the forward reaction is exothermic.
Movement: Low temperatures favour the exothermic reaction and shift the equilibrium position right.
Why: to counteract the temperature change
Yield: increasing the equilibrium yield of sulfur trioxide
Pressure:
Feature: the right side has fewer moles.
Movement: high pressures favour the side with fewer moles so the equilibrium positions shifts right.
Why: to counteract the temperature change
Yield: increasing the equilibrium yield of sulfur trioxide
[from the mark scheme]
Statement that: Forward reaction is exothermic OR reverse reaction is endothermic ✔
Right hand side has fewer (gaseous) moles OR left hand side has more gaseous moles ✔
Lower temperature / cooling AND increasing pressure shifts (equilibrium position) to the right ✔
b) [copied exact from mark scheme]
Low temperature gives a slow rate OR high temperatures needed to increase rate ✔
High pressure is expensive (to generate) OR high pressure provides a safety risk ALLOW high pressures are dangerous✔
explain why pressure and concentration do not affect Kc
increasing the concentration of reactants means the reaction is not at equilibrium, so no Kc. you wait til the system regains equilibrium, and it does this by producing more product, so Kc will be the same.
pressure… just trust me.
!! QUESTION IS BASED OFF MANY PMT QUESTIONS, SO TREAT AS AN EXAM Q
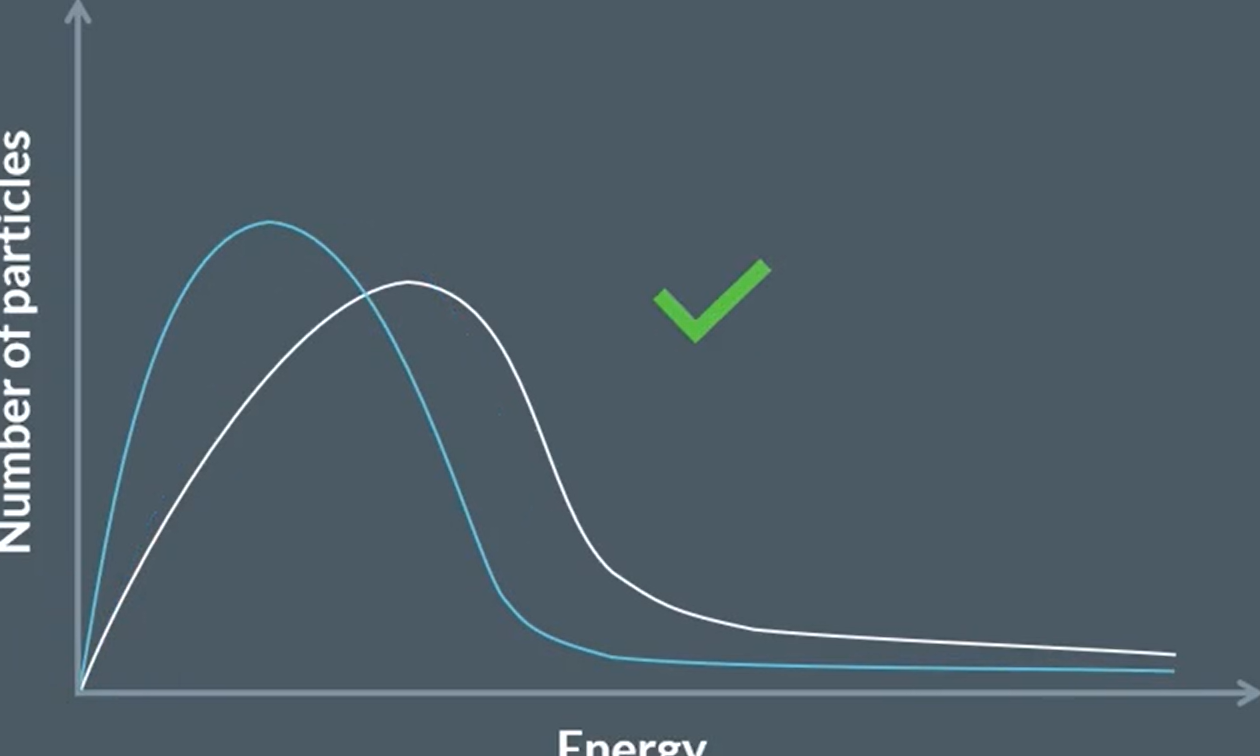
using a boltzmann distribution curve, explain why the rate of reaction increases with a catalyst [4]
Curve starts within two small squares of origin AND not touching the x-axis at high energy ✓
axes labels: y: (number of) molecules/particles AND x: (kinetic) energy ✓
Catalyst provides a lower activation energy OR Ec shown below Ea on Boltzmann distribution ✓
Greater proportion of molecules/particles/collisions have energy above activation energy (with catalyst) OR greater area under curve above activation energy ✓
TIP: when talking about catalyst, talk about proportion of molecules with Ea increases
DO NOT ALLOW two curves
DO NOT ALLOW ‘atoms’ as y-axis label
IGNORE (more) successful collisions
IGNORE response implying ‘more collisions’ (confusion with effect of greater temperature)
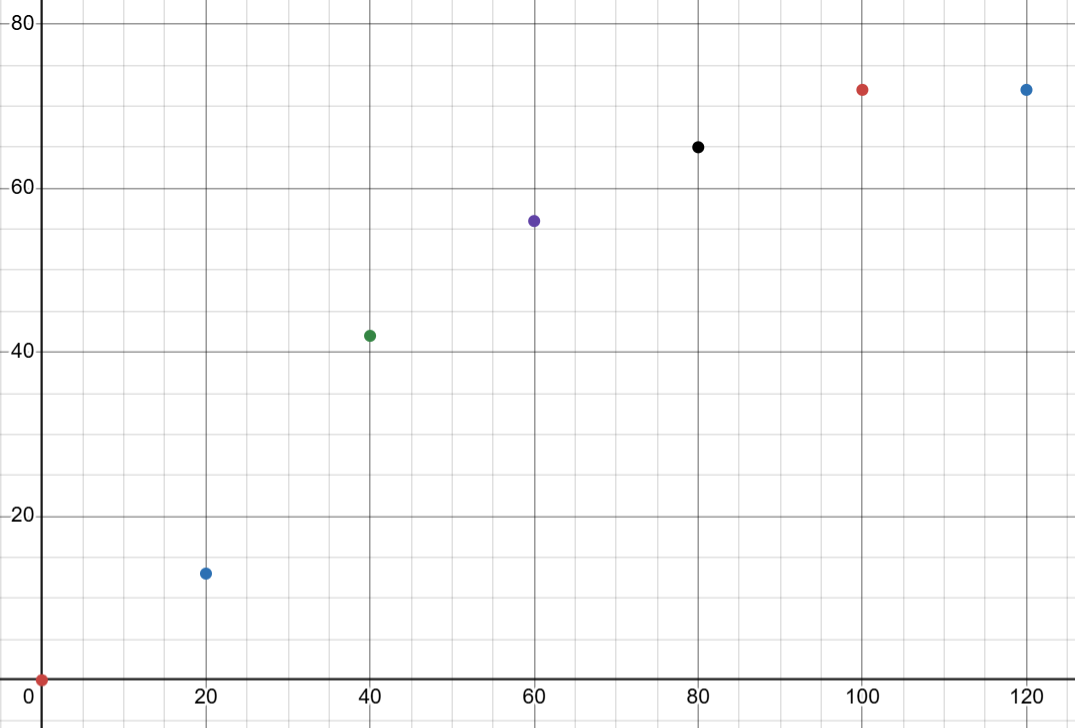
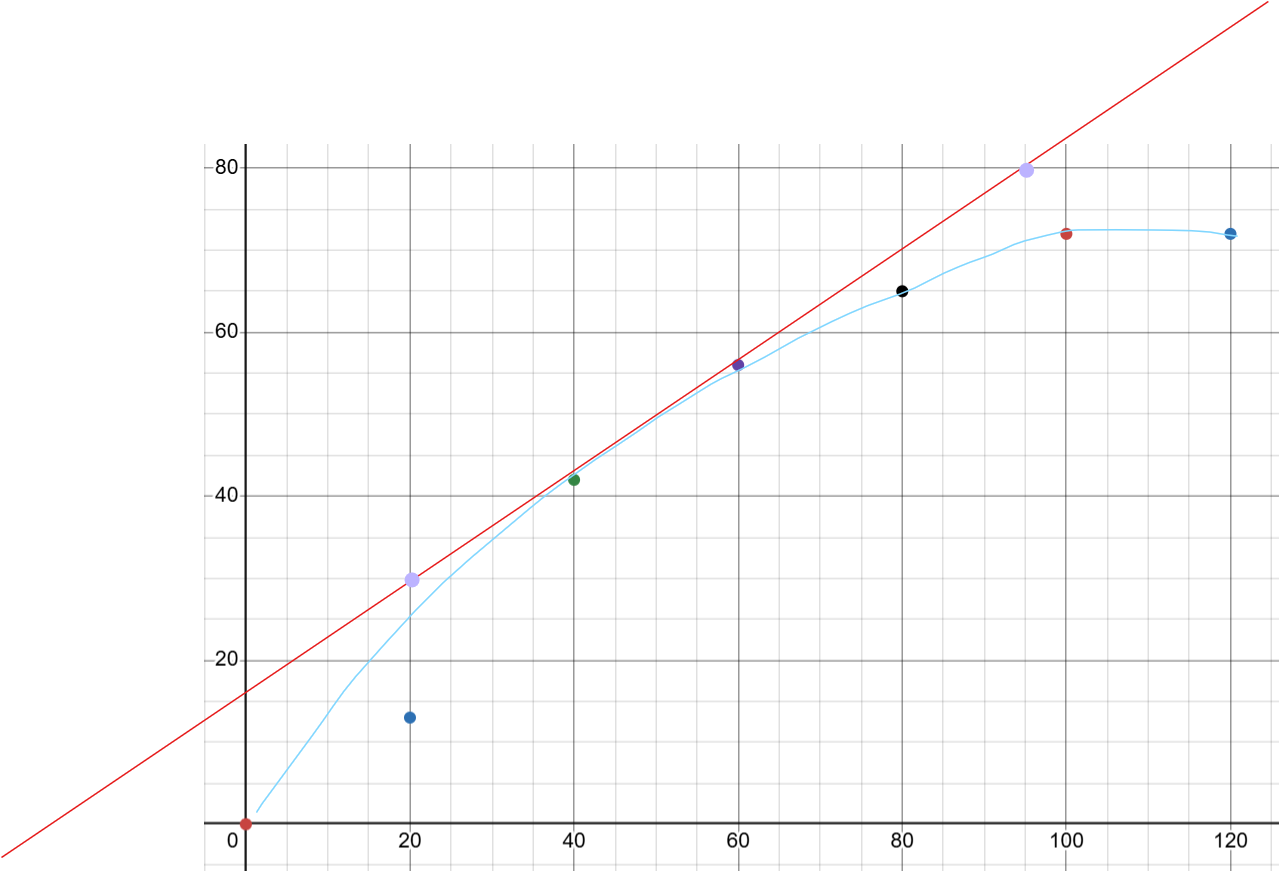
this graph shows the volume of gas produced over time.
draw the same graph at a higher and at a lower concentration
then do the same thing for pressure
pressure would be the exact same
explain how catalysts make reactions less harmful to the environment
lower temperatures (and pressures)
so less fossil fuels need to be burnt / less energy required / less CO2 emissions
less waste or toxic solvent used
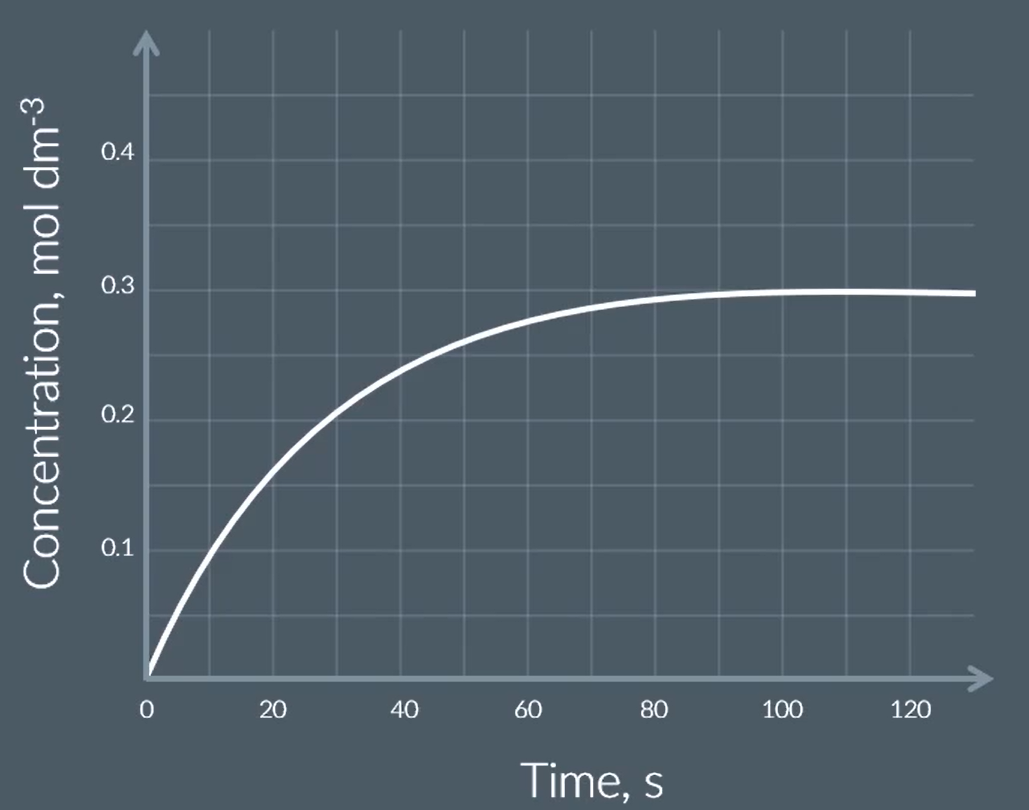
find the rate after 50s
giving units
true answer 0.68 cm3 s-1
if the question is about RATE, do NOT chat about le chat
okkok

this graph shows the volume of gas produced over time.
draw the same graph at a higher and at a lower temperature

this graph shows the volume of gas produced over time, of a reaction using 60cm3 of 0.100moldm-3 HCl solution (the limiting reagent)
sketch the graph if 40cm3 of 0.150mol/dm3 solution was used instead
because the same moles are produced, so the same moles of product are formed. the volume does NOT matter.
concentration increases rate of reaction
pros and cons of homo and heterogeneous catalysts
homo:
very effective since same phase
BUT same phase so hard to separate
hetero:
different phases so easy separation
limited SA; can get poisoned
auto
cheap no catalyst required
only works for some reactions. starts slow and once product made, reaction speeds
Using the boltzmann distribution model, explain how the rate of reaction is affected by temperature [4]
done
😨👍😨👍