Genomics and Proteomics (1-2)
1/61
There's no tags or description
Looks like no tags are added yet.
Name | Mastery | Learn | Test | Matching | Spaced | Call with Kai |
|---|
No analytics yet
Send a link to your students to track their progress
62 Terms
What is SDS-PAGE?
Sodium Dodecyl Sulfate – Polyacrylamide Gel Electrophoresis.
A laboratory technique used to separate proteins based on their molecular weight.
Chemical properties of SDS
Structure:
Long hydrophobic alkyl chain (dodecyl, 12 carbons).
Negatively charged sulfate head group (–OSO₃⁻) with sodium counterion (Na⁺).
Type: Anionic surfactant/detergent.
Amphipathic nature
Hydrophobic tail + hydrophilic sulfate head.
Allows SDS to dissolve hydrophobic molecules in water (detergent property).
Ionic character
Sulfate group makes SDS strongly negatively charged in aqueous solution.
This is what gives proteins a uniform negative charge during SDS-PAGE.
Denaturing ability
SDS disrupts non-covalent bonds (hydrogen bonds, hydrophobic interactions).
This unfolds (denatures) proteins, giving them a rod-like shape.
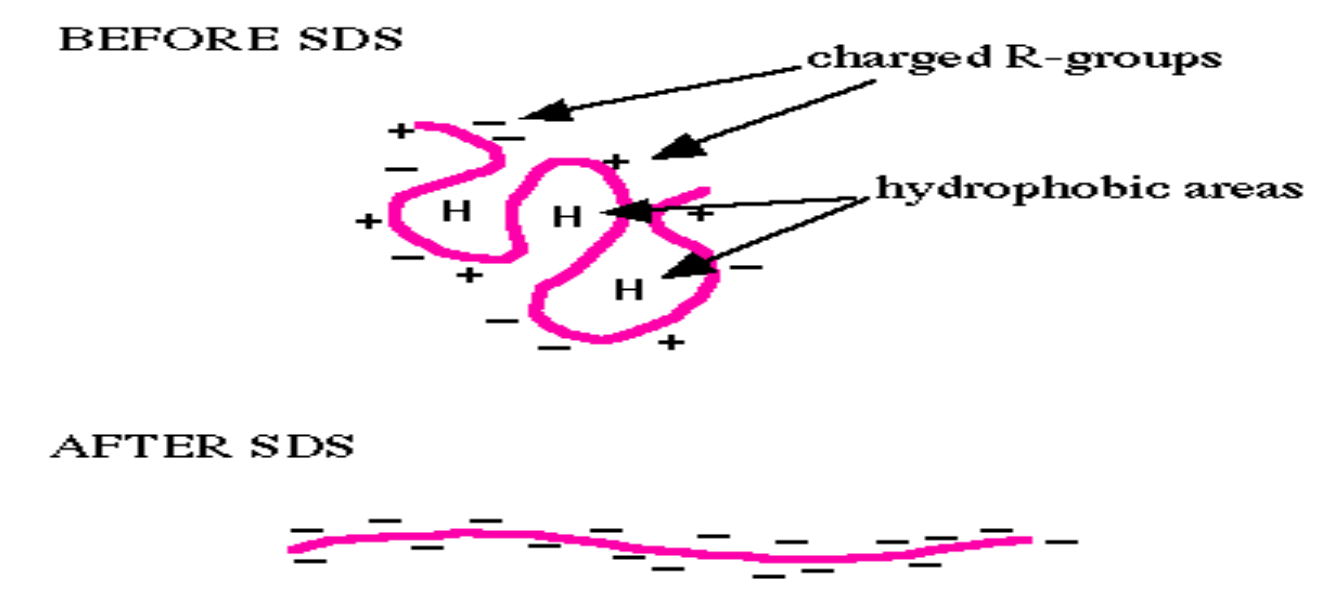
What does SDS do to proteins?
Before SDS
The protein is in its native folded state.
Structure stabilized by:
Hydrophobic interactions (H in the diagram = hydrophobic patches tucked inside).
Charged R-groups (+ and –) interacting on the surface.
Result: A complex 3D shape, and each protein has its own unique net charge (depending on amino acids).
After SDS
SDS (a strong anionic detergent) binds along the length of the protein.
It:
Denatures the protein → unfolds it into a linear chain.
Masks natural charges → coats the protein with negative charges (–).
Now, all proteins have:
Similar rod-like shapes.
A uniform negative charge proportional to their length.
How much SDS binds to protein?
About 1.4 g SDS per 1 g of protein, binding uniformly along hydrophobic regions.
What happens if a cell is incubated with SDS?
Membranes dissolve, all proteins are solubilized, and all proteins are coated with many negative charges.
If proteins are denatured with SDS and placed in just an electric field, what happens?
They all move toward the positive pole at the same rate → no size-based separation.
What medium is used to separate proteins of different sizes?
Polyacrylamide gel, which slows large proteins more than small ones.
What is the name of the process combining SDS and polyacrylamide gel?
SDS-PAGE (Sodium Dodecyl Sulfate – Polyacrylamide Gel Electrophoresis).
Why do small proteins move faster in SDS-PAGE?
Because polyacrylamide gel acts like a molecular sieve → small molecules move more easily through pores.
Where do large proteins stay in SDS-PAGE?
Closer to the well (top of the gel), since they move more slowly.
What are the two important outcomes of SDS-PAGE?
Proteins lose all structure beyond primary structure.
All proteins have a large negative charge and migrate toward the positive pole.
PTM crosstalk: Biology
Shows how PTMs occur in biological systems.
PTMs can:
Be added at specific amino acids (red/blue dots).
Occur in patterns or multiple sites along a protein.
Cause folding/unfolding changes or regulate protein-protein interactions.
PTM crosstalk: proteomic methods
Methods to detect PTMs using mass spectrometry (MS).
Workflow: proteins are digested, PTMs are mapped, then peptides are analyzed by MS.
Specialized MS strategies allow detection of different modifications.
PTM crosstalk:
PTMs affect protein function, stability, localization, and interactions.
Experimental strategies:
Knockdown/knockout of modified proteins.
Enrichment of modified peptides.
MS-based functional analysis.
Is MALDI-TOF a soft ionization technique or hard?
Soft ionization methods use lower energy so that molecules stay largely intact, producing fewer fragments. This is especially important for analyzing large, delicate, or thermally unstable biomolecules (like proteins, peptides, nucleotides).
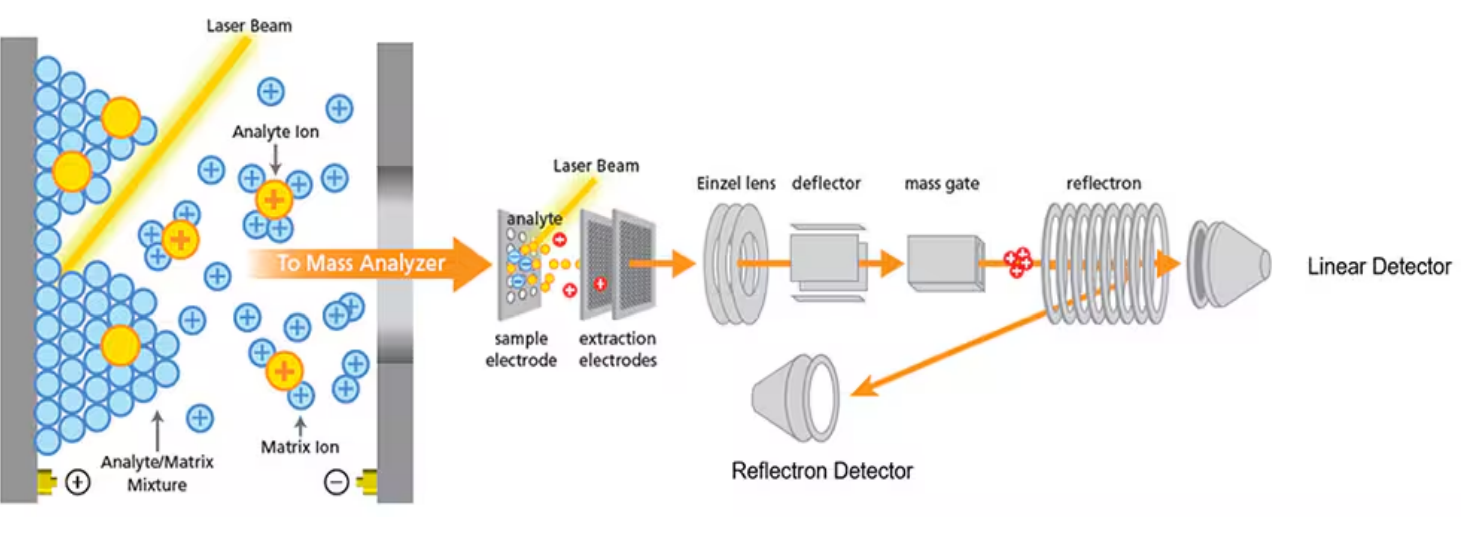
Two step process of MALDI-TOF
sample prep
desoprtion
Ionization
MALDI-TOF desoprtion process
2. Laser Irradiation
A pulsed UV laser (e.g., 337 nm nitrogen laser) strikes the matrix crystals.
The matrix molecules absorb the laser photons because they have strong chromophores.
The absorbed energy excites the matrix molecules to a high energy state.
3. Desorption (Explosion of Matrix & Analyte)
Excited matrix molecules rapidly convert absorbed energy into heat and vibrational energy.
This causes rapid sublimation (solid → gas) of the matrix, carrying analyte molecules with it into the gas phase.
Importantly, this process is gentle → the analyte is desorbed without fragmenting.
MALDI-TOF sample prep
The analyte (protein, peptide, etc.) is mixed with a matrix (usually a small organic acid like sinapinic acid or α-cyano-4-hydroxycinnamic acid).
The mixture is dried on a metal plate, forming matrix crystals with embedded analyte molecules.
Role of matrix:
Absorbs laser energy instead of the fragile biomolecule.
Protects analyte from direct laser damage.
Helps transfer energy efficiently to analyte during desorption.
MALDI-TOF ionization process
4. Ionization of the Analyte
During desorption, ionization occurs by proton transfer:
Matrix molecules (M) get excited and form [M+H]⁺ ions.
These ions then transfer protons to the analyte (A), producing [A+H]⁺.
Thus, analyte ions are generated in the gas phase, mostly as singly charged ions.
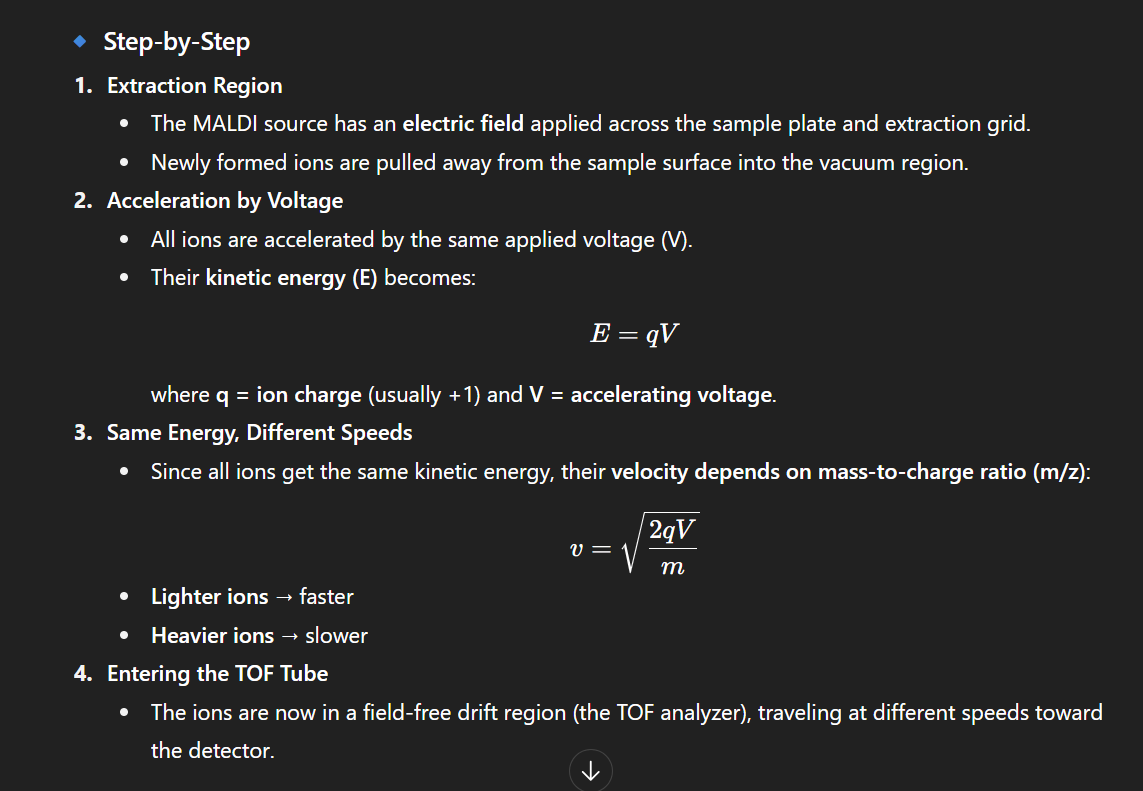
5. Acceleration into the TOF Analyzer
The generated analyte ions are accelerated in an electric field.
All ions receive the same kinetic energy (E = qV).
Since velocity depends on mass-to-charge ratio (m/z), lighter ions travel faster, heavir ions slower.
6. Detection (Time-of-Flight Measurement)
The TOF tube measures how long ions take to reach the detector.
Time ∝ √(m/z).
By recording ion arrival times, the m/z spectrum of the analyte is obtained.
MALDI-TOF: properties of a good matrix
Strong absorption at the laser wavelength (usually UV, e.g., 337 nm).
Ability to form crystals with the analyte (co-crystallization).
Efficient proton donor/acceptor properties (to assist ionization).
Volatility so it can vaporize quickly during desorption.
Chemical compatibility (should not react with the analyte).
MALDI-TOF: good matrices
α-Cyano-4-hydroxycinnamic acid (CHCA)
Best for small peptides and proteins < 10 kDa.
Produces sharp peaks with high resolution.
Sinapinic Acid (SA)
Used for larger proteins (> 20 kDa).
Gives good ionization of intact biomolecules.
2,5-Dihydroxybenzoic Acid (DHB)
Good for carbohydrates and glycoproteins.
Produces smoother spectra for complex molecules.
MALDI-TOF:
laser characteristics
🔹 Characteristics of the Laser
Pulsed laser → delivers short bursts of energy (nanosecond pulses).
UV wavelength (commonly used):
Nitrogen laser: 337 nm
Nd:YAG laser: 355 nm (3rd harmonic of Nd:YAG)
These wavelengths are strongly absorbed by common matrices.
Energy range: Carefully tuned so it excites the matrix but doesn’t directly destroy the analyte.
MALDI-TOF desoprtion process
Laser hits matrix crystals
The pulsed UV laser excites the matrix molecules (not the analyte directly).
Matrix absorbs the energy
Because the matrix has strong UV absorption, it takes in most of the photon energy.
Rapid heating & sublimation
Excited matrix molecules convert photon energy into heat.
The solid matrix sublimates (explodes into gas) almost instantly.
Analyte carried along
As the matrix vaporizes, the analyte molecules (proteins, peptides, etc.) embedded in the crystals are dragged into the gas phase intact.
This is the actual desorption part.
MALDI-TOF: why is desoprtion important?
Desorption ensures large, fragile biomolecules (proteins, nucleic acids) can enter the gas phase without fragmenting.
The matrix acts like a shock absorber, preventing analyte destruction.
MALDI-TOF: ionization process
Proton Transfer from Matrix
The matrix molecules, when excited by the laser, can become proton donors ([M+H]⁺).
These protons are transferred to the analyte (A).
Result: [A+H]⁺ (a protonated analyte ion).
Other Ion Forms
Sometimes analytes can pick up other cations from the matrix or sample environment:
[A+Na]⁺ or [A+K]⁺ (sodium/potassium adducts).
But the dominant ion in MALDI is usually [M+H]⁺.
Singly Charged Ions
Unlike Electrospray Ionization (ESI), which often makes multiply charged ions, MALDI typically produces singly charged ions.
This simplifies the spectrum, making it easier to interpret.
MALDI-TOF: ion acceleration
MALDI-TOF: why ion acceleration matters
Ensures all ions start with the same kinetic energy.
Creates a direct relationship between m/z and flight time, making TOF analysis possible.
MALDI-TOF: time of flight analyzer
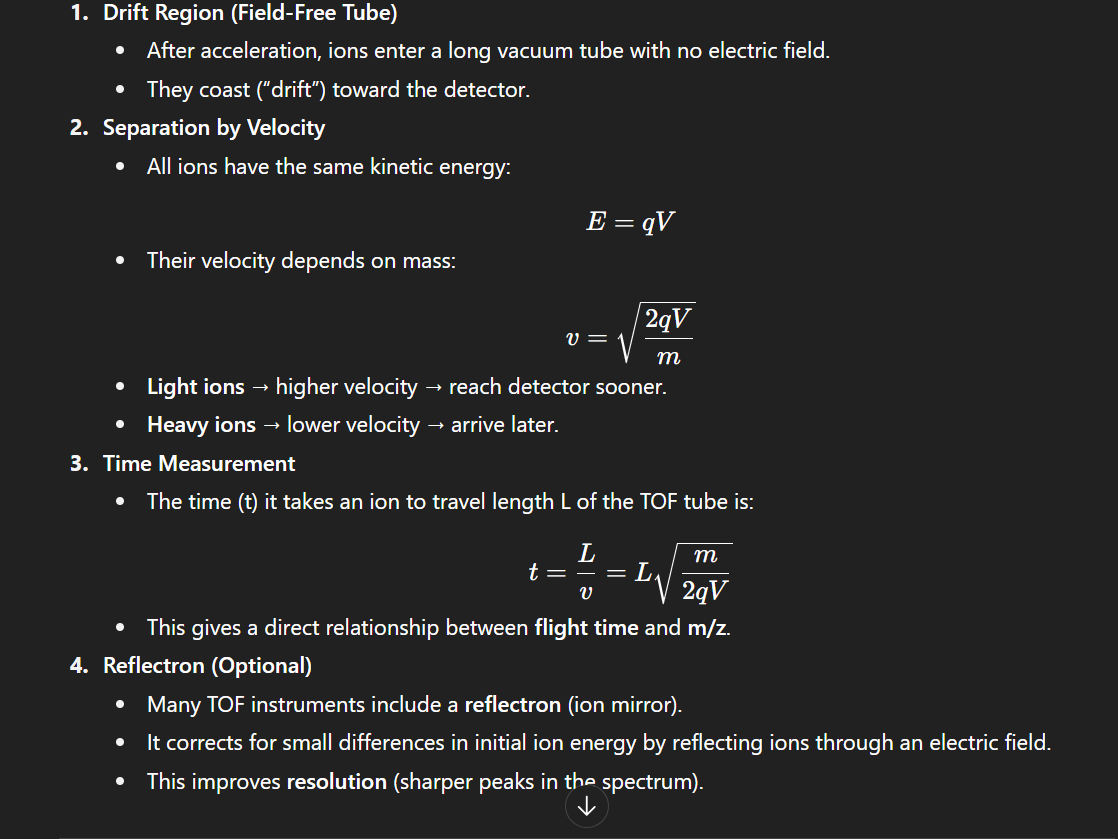
Why is TOF analyzer important?
Allows analysis of very large molecules (up to hundreds of kDa).
Unlimited mass range compared to quadrupoles or ion traps.
High speed and sensitivity.
MALDI-TOF: detector process
Arrival of Ions
Ions strike the detector surface at the end of the TOF tube.
Lighter ions arrive first, heavier ions arrive later.
Detector Type
Most MALDI-TOF systems use an electron multiplier or a microchannel plate (MCP) detector.
When an ion hits, it triggers the release of secondary electrons.
Signal Amplification
The secondary electrons are multiplied through a cascade process, creating a measurable current pulse.
The strength of the signal is proportional to the number of ions arriving.
Time Recording
The detector records the exact arrival time of each ion.
Since the distance and voltage are fixed, arrival time can be directly converted to mass-to-charge ratio (m/z).
What does the MALDI-TOF output show?
X-axis: m/z (mass-to-charge ratio)
Horizontal axis represents the mass-to-charge ratio of detected ions.
Since MALDI produces mostly singly charged ions ([M+H]⁺), m/z ≈ molecular mass of the analyte.
Y-axis: Intensity (Relative Abundance)
Vertical axis shows signal strength (number of ions hitting the detector).
Taller peaks = more abundant ions.
Main Peak(s)
Represents the intact analyte (e.g., a peptide, protein, polymer).
Example: A peptide of 1500 Da will show a main peak near m/z = 1501 ([M+H]⁺).
Adduct Peaks
Additional peaks can appear due to sodium or potassium adducts: [M+Na]⁺, [M+K]⁺.
Matrix Peaks
Sometimes, small peaks from the matrix appear at low m/z.
Fragmentation (usually minimal)
Unlike hard ionization, MALDI produces little fragmentation, so the spectrum is clean and dominated by molecular ions.
How is an IPG gradient created?
A pH gradient is formed by mixing several specially designed buffering compounds called immobilines.
Typically, 6–8 different immobilines are used.
These immobilines are weak acids and bases with well-defined pKa values.
During gel preparation, these immobilines are co-polymerized with acrylamide, meaning they become chemically bound (immobilized) within the gel matrix.
This immobilization prevents the gradient from drifting during electrophoresis — making the pH gradient permanent and highly stable.
What is the working principle of IPG gradients?
When an electric field is applied, proteins migrate through the pH gradient.
Each protein moves until it reaches the region where the pH equals its isoelectric point (pI) — the point where it has no net charge.
At that position, the protein stops migrating, effectively becoming “focused” into a sharp band.
Since the pH gradient is chemically fixed in the gel, it remains stable and consistent between runs.
4 advantages of IPG
Customizable pH Ranges
IPG strips can be formulated for any desired range, commonly between pH 3 to 12.
Narrow-range gradients (e.g., pH 4–7) provide higher resolution, ideal for focusing similar proteins.
High Reproducibility
Because the gradient is covalently linked to the gel, it doesn’t shift or vary between runs — ensuring consistent results.
Increased Sample Capacity
IPG gels can hold more protein sample compared to traditional carrier ampholyte gels, which makes them ideal for proteomic studies.
Improved Focusing and Spot Sharpness
Proteins form sharper, more distinct spots due to stable gradients, improving downstream quantification and mass spectrometry.
Step 1 of 2-DE: protein extraction
Process: Proteins are first extracted (solubilized) from cells or tissues under two different experimental conditions — shown as Condition A and Condition B.
Purpose: These conditions may represent, for example, a healthy vs diseased state, or treated vs untreated cells.
Goal: Obtain all proteins in soluble form by using lysis buffers containing detergents, reducing agents, and chaotropic agents.
Step 2 of 2-DE:first dimension
2. First Dimension – Isoelectric Focusing (IEF)
Principle: Separation of proteins based on their isoelectric point (pI).
How:
Proteins are applied to an immobilized pH gradient (IPG) strip (e.g., pH 3–10).
Under an electric field, each protein migrates until it reaches the pH that equals its pI (where its net charge is zero).
Purpose: Resolve proteins according to their charge differences.
Step 3 of 2-DE: alkylation
After IEF, proteins are treated with reducing agents (e.g., Dithiothreitol) to break disulfide bonds, and alkylating agents (e.g., iodoacetamide) to prevent their reformation.
Reason: This ensures proteins remain fully denatured and separated during the second dimension.
Step 4 of 2-DE: SDS-PAGE
4. Second Dimension – SDS-PAGE
Principle: Separation by molecular weight (MW).
How:
The IPG strip is placed on top of an SDS-PAGE gel.
SDS coats all proteins with a uniform negative charge, so they migrate through the gel solely according to size.
Smaller proteins move faster than larger ones.
Result: A 2D pattern of protein spots, where each spot represents a unique protein species.
Step 5 of 2-DE: staining
5. Staining and Visualization
Common stains:
Silver stain (high sensitivity)
Coomassie Brilliant Blue (general use)
Fluorescent dyes (for quantitative analysis)
Autoradiography (for radiolabeled proteins)
Purpose: To visualize the protein spots clearly on the gel.
Step 6 of 2-DE: image analysis
6. Image Analysis
Step: Compare gels from different conditions (A vs B).
Goal: Identify protein spots that differ in intensity, presence, or position.
Interpretation:
Upregulated or downregulated proteins indicate differential expression between the two conditions.
Step 7 of 2-DE: spot excisison
7. Spot Excision and Mass Spectrometry (MS)
Process:
Spots of interest are cut (excised) from the gel.
Proteins are digested (usually with trypsin) into peptides.
Peptides are analyzed using Mass Spectrometry (MS).
Outcome:
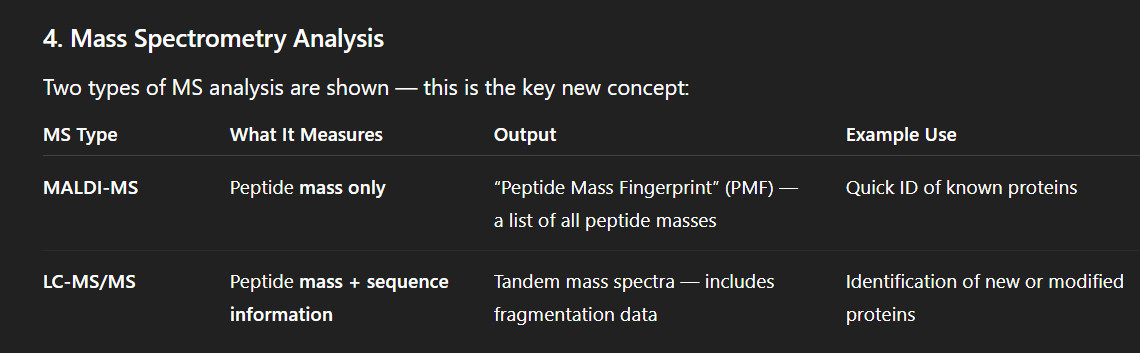
Each spot is identified based on peptide mass fingerprinting or MS/MS sequencing.
Provides the protein’s identity, sequence, and possible post-translational modifications.
Key steps of sample prep in protein purification 2-DE
Key Steps
Lysis buffer — contains urea, thiourea, CHAPS, DTT (denaturants + detergents).
Remove salts & nucleic acids — interfere with IEF.
Use protease inhibitors — prevent degradation.
Protein quantification — Bradford or Lowry assay before loading.
Gel interpretation in 2-DE
Axes of 2-DE Map
X-axis: pH gradient (acidic → basic)
Y-axis: Molecular weight (large → small)
Reading the Gel
Each spot = one protein species.
Proteins that are upregulated/downregulated between samples → biologically significant.
Post-translational modifications (PTMs) shift the protein’s pI or MW, creating spot trains.
Advantages of 2-DE
✅ High resolution — separates thousands of proteins.
✅ Detects isoforms and PTMs.
✅ Quantitative (when combined with fluorescent dyes).
✅ Compatible with downstream MS.
Limitations of 2-DE
🚫 Poor for hydrophobic or membrane proteins (don’t solubilize well).
🚫 Extremely large/small proteins may not focus properly.
🚫 Labor-intensive, time-consuming, and requires high-quality sample prep.
🚫 Quantitative analysis is less precise than LC-MS-based proteomics.
MALDI-TOF vs ESI for 2-DE
Why digest proteins into peptides in 2DE?
Why digest?
Mass spectrometers cannot directly analyze large intact proteins.
Peptides are smaller, ionize better, and produce characteristic mass spectra that can be matched to databases.
Each protein yields a unique set of peptide masses → its “peptide mass fingerprint (PMF)”.
Why is trypsin used for protein digestion in 2-DE?
Trypsin
The gold standard enzyme for proteomics digestion.
Cleaves specifically at the C-terminal side of Lysine (K) and Arginine (R) residues (unless followed by Proline).
Produces peptides of ideal length (8–20 amino acids).
The cleavage pattern is predictable, aiding database matching.
(Optional) Automated In-Gel digestion in 2-DE
⚙ 3. Step-by-Step: Automated In-Gel Digestion Workflow Step 1 – Gel Spot Preparation
Excise the protein spot with a clean scalpel or automated spot cutter.
Transfer to a microtube or 96-well plate.
Wash to remove stains (silver, Coomassie) and residual SDS.
Dehydrate with acetonitrile (ACN) to shrink the gel piece.
Step 2 – Reduction and Alkylation (Optional but Standard)
Reduction: Add DTT (Dithiothreitol) to break disulfide bonds (–S–S– → –SH).
Alkylation: Add iodoacetamide to cap the thiol groups, preventing re-oxidation.
This ensures complete unfolding and accessibility of the protein to the enzyme.
Step 3 – Rehydration with Trypsin
Rehydrate the dried gel piece with a small volume of trypsin solution in ammonium bicarbonate buffer.
The enzyme diffuses into the gel and binds to the protein.
Step 4 – Digestion
Incubate at 37°C overnight (8–16 hours).
Trypsin cleaves proteins into peptides within the gel matrix.
The gel acts as a microreactor.
Step 5 – Peptide Extraction
After digestion, peptides are extracted using alternating washes of:
Aqueous ammonium bicarbonate (to recover hydrophilic peptides),
Acetonitrile + formic acid (to recover hydrophobic peptides).
Combine extracts, then dry (e.g., by vacuum centrifuge).
Step 6 – Sample Cleanup (Optional)
Desalt using C18 ZipTips or reverse-phase columns to remove salts and contaminants before MS.
ESI: sample introduction
A liquid sample (often from an LC column) flows through a metal capillary.
The solution contains the analyte (e.g., peptide, drug) dissolved in a volatile solvent such as water–methanol or water–acetonitrile, often with a little acid or base to promote ionization.
ESI: High-Voltage Application
A high voltage (usually +3 to +6 kV for positive mode) is applied between the capillary and a counter-electrode.
This electric field causes charges in the liquid to migrate to the surface of the emerging droplet.
Electrostatic forces pull the liquid into a Taylor cone, a cone-shaped meniscus formed when the electric field overcomes surface tension.
ESI: Formation of Charged Droplets
From the tip of the Taylor cone, a fine spray of highly charged droplets is emitted.
The droplets carry either positive or negative charges, depending on the applied polarity.
Nebulizing gas (e.g., nitrogen) assists in dispersing these droplets into the atmosphere.
ESI: desolvation
As the droplets travel through a heated and gas-filled region, solvent molecules evaporate.
Evaporation reduces droplet size and increases surface charge density.
The droplets shrink until electrostatic repulsion becomes stronger than surface tension.
ESI: couloumb explosion
When the droplet’s charge exceeds the Rayleigh limit, repulsive forces cause it to break apart—this is the Coulomb explosion.
Each explosion creates smaller, more highly charged droplets, continuing the evaporation process.
ESI: ion formation
Two models describe how ions finally leave the droplet:
Charged Residue Model (CRM): the droplet keeps shrinking until it contains only one analyte molecule with the residual charge.
Ion Evaporation Model (IEM): small solvated ions escape directly from the droplet surface once the electric field is strong enough.
In either case, the result is gas-phase ions representing the analyte.
ESI: transfer to mass analyzer
The ions pass through a sampling orifice into a region of lower pressure.
Neutral solvent molecules are pumped away while ions are focused and guided into the mass analyzer for detection.
Key outcome of ESI
Large biomolecules emerge as multiply charged ions (e.g., [M + nH]ⁿ⁺).
This reduces their mass-to-charge ratio (m/z) so even huge molecules can be measured.
Because little fragmentation occurs, ESI is classified as a soft ionization technique.
What is the rayleigh limit?
Every droplet has two opposing forces:
Surface tension, which tries to keep it spherical and stable.
Electrostatic repulsion, from like charges crowding on the surface.
The Rayleigh limit is reached when electrostatic repulsion equals the surface tension holding the droplet together.
When charge exceeds this limit → Coulomb explosion, splitting the droplet into smaller ones.
This is how large charged droplets continuously divide and get closer to forming individual ions.
ESI: Electric Field Strength and Taylor Cone Stability
The electric field between the emitter tip and the counter-electrode pulls charges in the liquid toward the tip.
When the electrostatic stress exceeds surface tension, the meniscus elongates into a Taylor cone.
At the cone’s apex, a microjet of charged liquid is emitted as fine droplets.
If the voltage is too low, the cone doesn’t form → no spray.
If too high, the spray becomes unstable → noisy ion current.
Therefore, a stable cone-jet mode gives consistent, reproducible ionization.
Why is ESI preferred over MALDI?
1. Continuous Ion Generation
ESI produces ions continuously from a flowing liquid stream.
Perfect for coupling with liquid chromatography (LC-MS) and tandem MS (MS/MS).
MALDI, by contrast, is a pulsed method — it fires a laser shot for each data point, not suitable for continuous flow.
2. Compatibility with Solution Chemistry
ESI ionizes molecules directly from solution, preserving noncovalent interactions.
Enables analysis of native protein complexes, ligand–protein binding, and enzyme cofactors.
MALDI requires drying with a solid matrix, which destroys such interactions.
3. Multiply Charged Ion Formation
ESI produces multiply charged ions (e.g., [M + nH]ⁿ⁺).
This reduces the mass-to-charge ratio (m/z), letting even large proteins fit into the analyzer’s detection range.
MALDI mostly gives singly charged ions, which may exceed the m/z range of many analyzers.
4. Quantitative and Reproducible Signals
Because ESI generates ions under controlled flow, its signal intensity can be directly related to analyte concentration.
MALDI is less reproducible since the laser ablates the matrix unevenly.
Why is MALDI chosen over ESI?
1. Simplicity and Speed
MALDI sample prep is fast: mix analyte with matrix, dry, and shoot with a laser.
Ideal for high-throughput screening and rapid profiling (e.g., microbial ID, peptide mass fingerprinting).
2. Tolerance to Salts and Buffers
MALDI tolerates non-volatile salts and complex mixtures far better than ESI, which suffers ion suppression.
Great for biological samples with impurities or buffer residues.
3. Excellent for Large Biomolecules
Produces singly charged ions with clear, simple spectra (one major peak per molecule).
Easier to interpret for very large species (proteins, polymers).
ESI spectra, with many charge states, require deconvolution.
4. Suited for Imaging and Solid Samples
MALDI can directly ionize solid tissues or surfaces, allowing mass spectrometry imaging (MSI).
ESI works only for liquid samples.