AP Human Geography
1/208
Earn XP
Description and Tags
Contains EVERYTHING up until the present
Name | Mastery | Learn | Test | Matching | Spaced | Call with Kai |
|---|
No study sessions yet.
209 Terms
Map
A 2D representation of a geographical area
Eratosthenes
Ancient Greek geographer (3rd century BCE). First to calculate Earth’s circumference with remarkable accuracy, coined the term “geography,” and created an early world map.
International Date Line (IDL)
Located near 180° longitude. Crossing it changes the calendar date (eastward → go back one day; westward → go forward one day).
Prime Meridian
The 0° longitude line that runs through Greenwich, England; serves as the baseline for measuring east and west longitude.
Cartography
The science or practice of drawing maps. Cartographers create maps that represent geographic features and spatial relationships. They use various tools, techniques, and data sources to gather and interpret information about the Earth's surface.
Map Scale
The distance on a map in relation to distance in actual space.
ABSOLUTE DISTANCE
The location of a place is defined by its latitude and longitude or its exact address.
RELATIVE DISTANCE
The location of a place in relation to another place.
SCALE BAR
a little line or bar on a map that shows real distances. It works like a ruler — for example, the bar might show that 1 cm on the map = 10 km in real life.
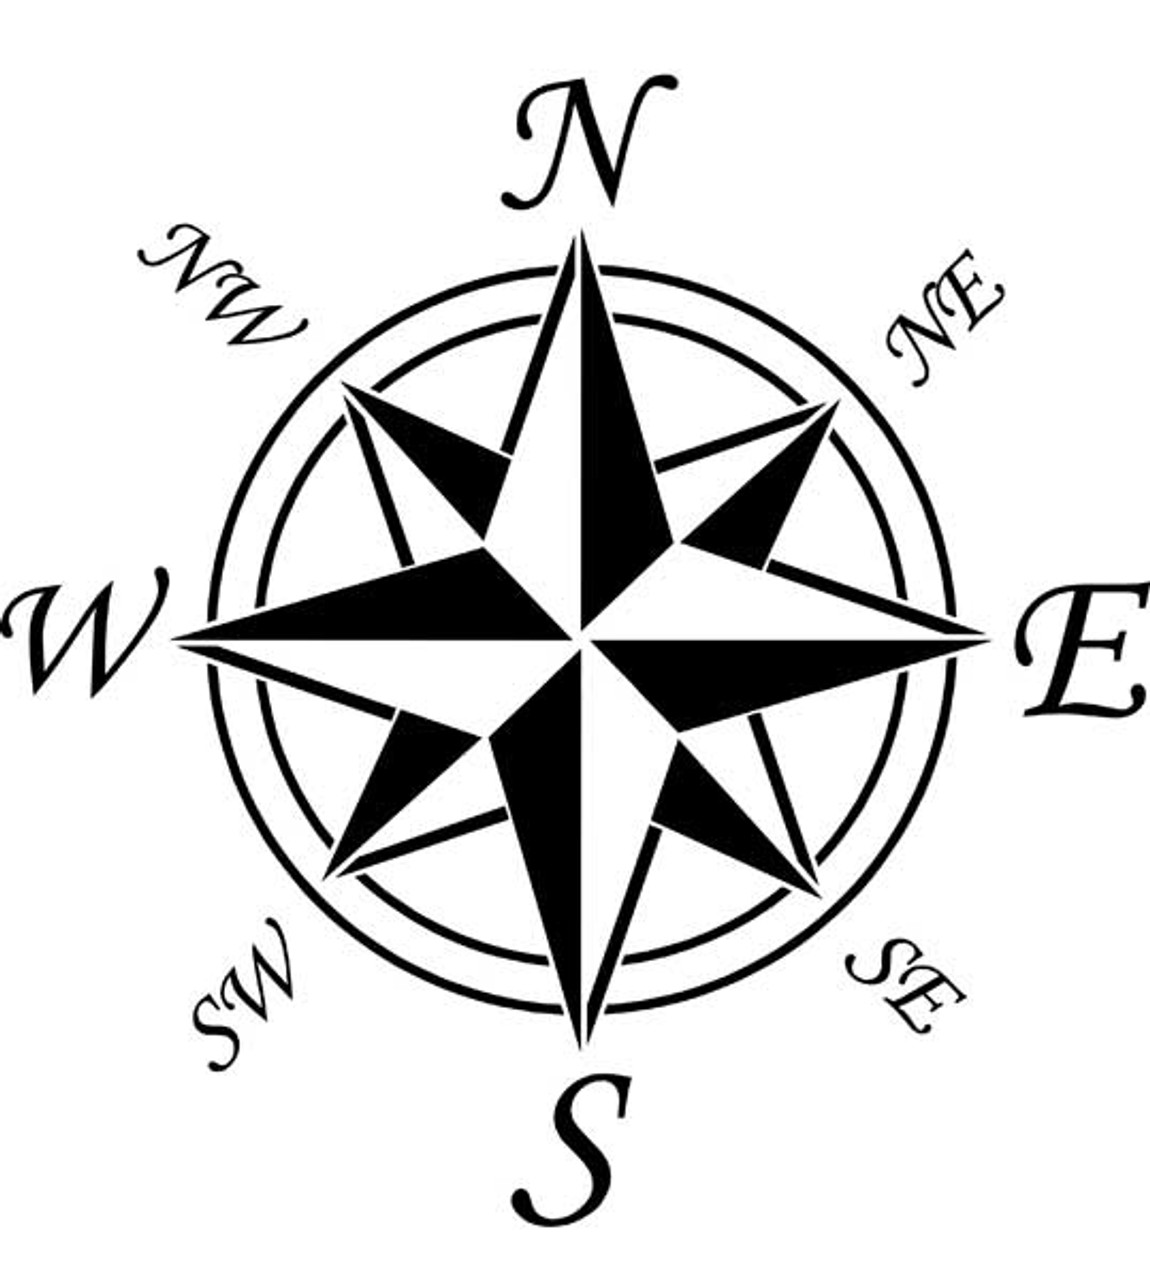
What is this called?
Compass rose
Toponym
The name of a place
Site
the description of the features of the place
Situation
the environmental conditions of the place
Spatial Interaction
the flow of information, products, and human beings from one location to another
Data aggregation
the process of collecting and organizing large amounts of information.
Clustered spatial pattern
When objects on a map are clumped together
Dispersed spatial pattern
When objects on a map are spaced out in some organized fashion
Random spatial pattern
When objects on a map are not organized in any way, located randomly
Agglomeration
when clustering occurs purposefully around a central point or a economic growth pole
Two types of maps
Reference and thematic
Reference Maps
An informational map that shows boundaries, names of places and geographic features of an area.
Topographic Map
A type of reference map showing a detailed and accurate illustration of man-made and natural features on the ground. (Elevation)
Contour lines
the lines on the map that represent the same elevation above sea level.
Political Reference Map
A type of reference map that represents political divisions and boundaries.
Thematic Maps
A map that shows spatial patterns of places and uses quantitative data to display specific topics.
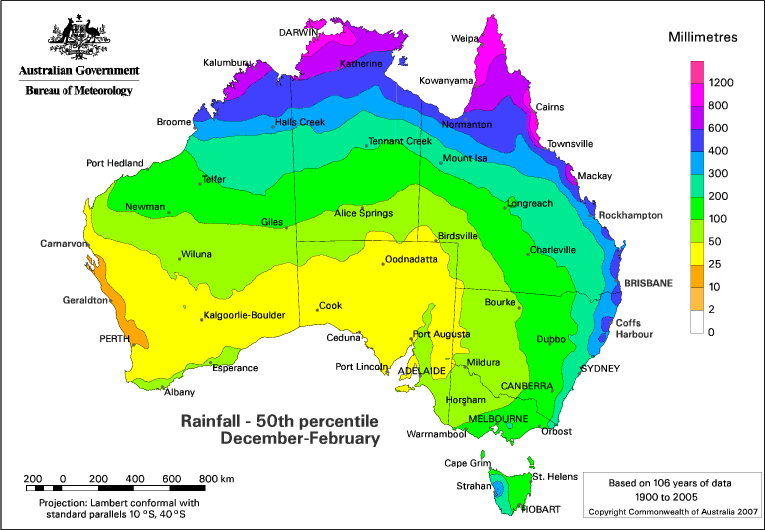
Isoline Map
A type of thematic map that displays lines that connect points of equal value.
Example: Rainfall & Temperature
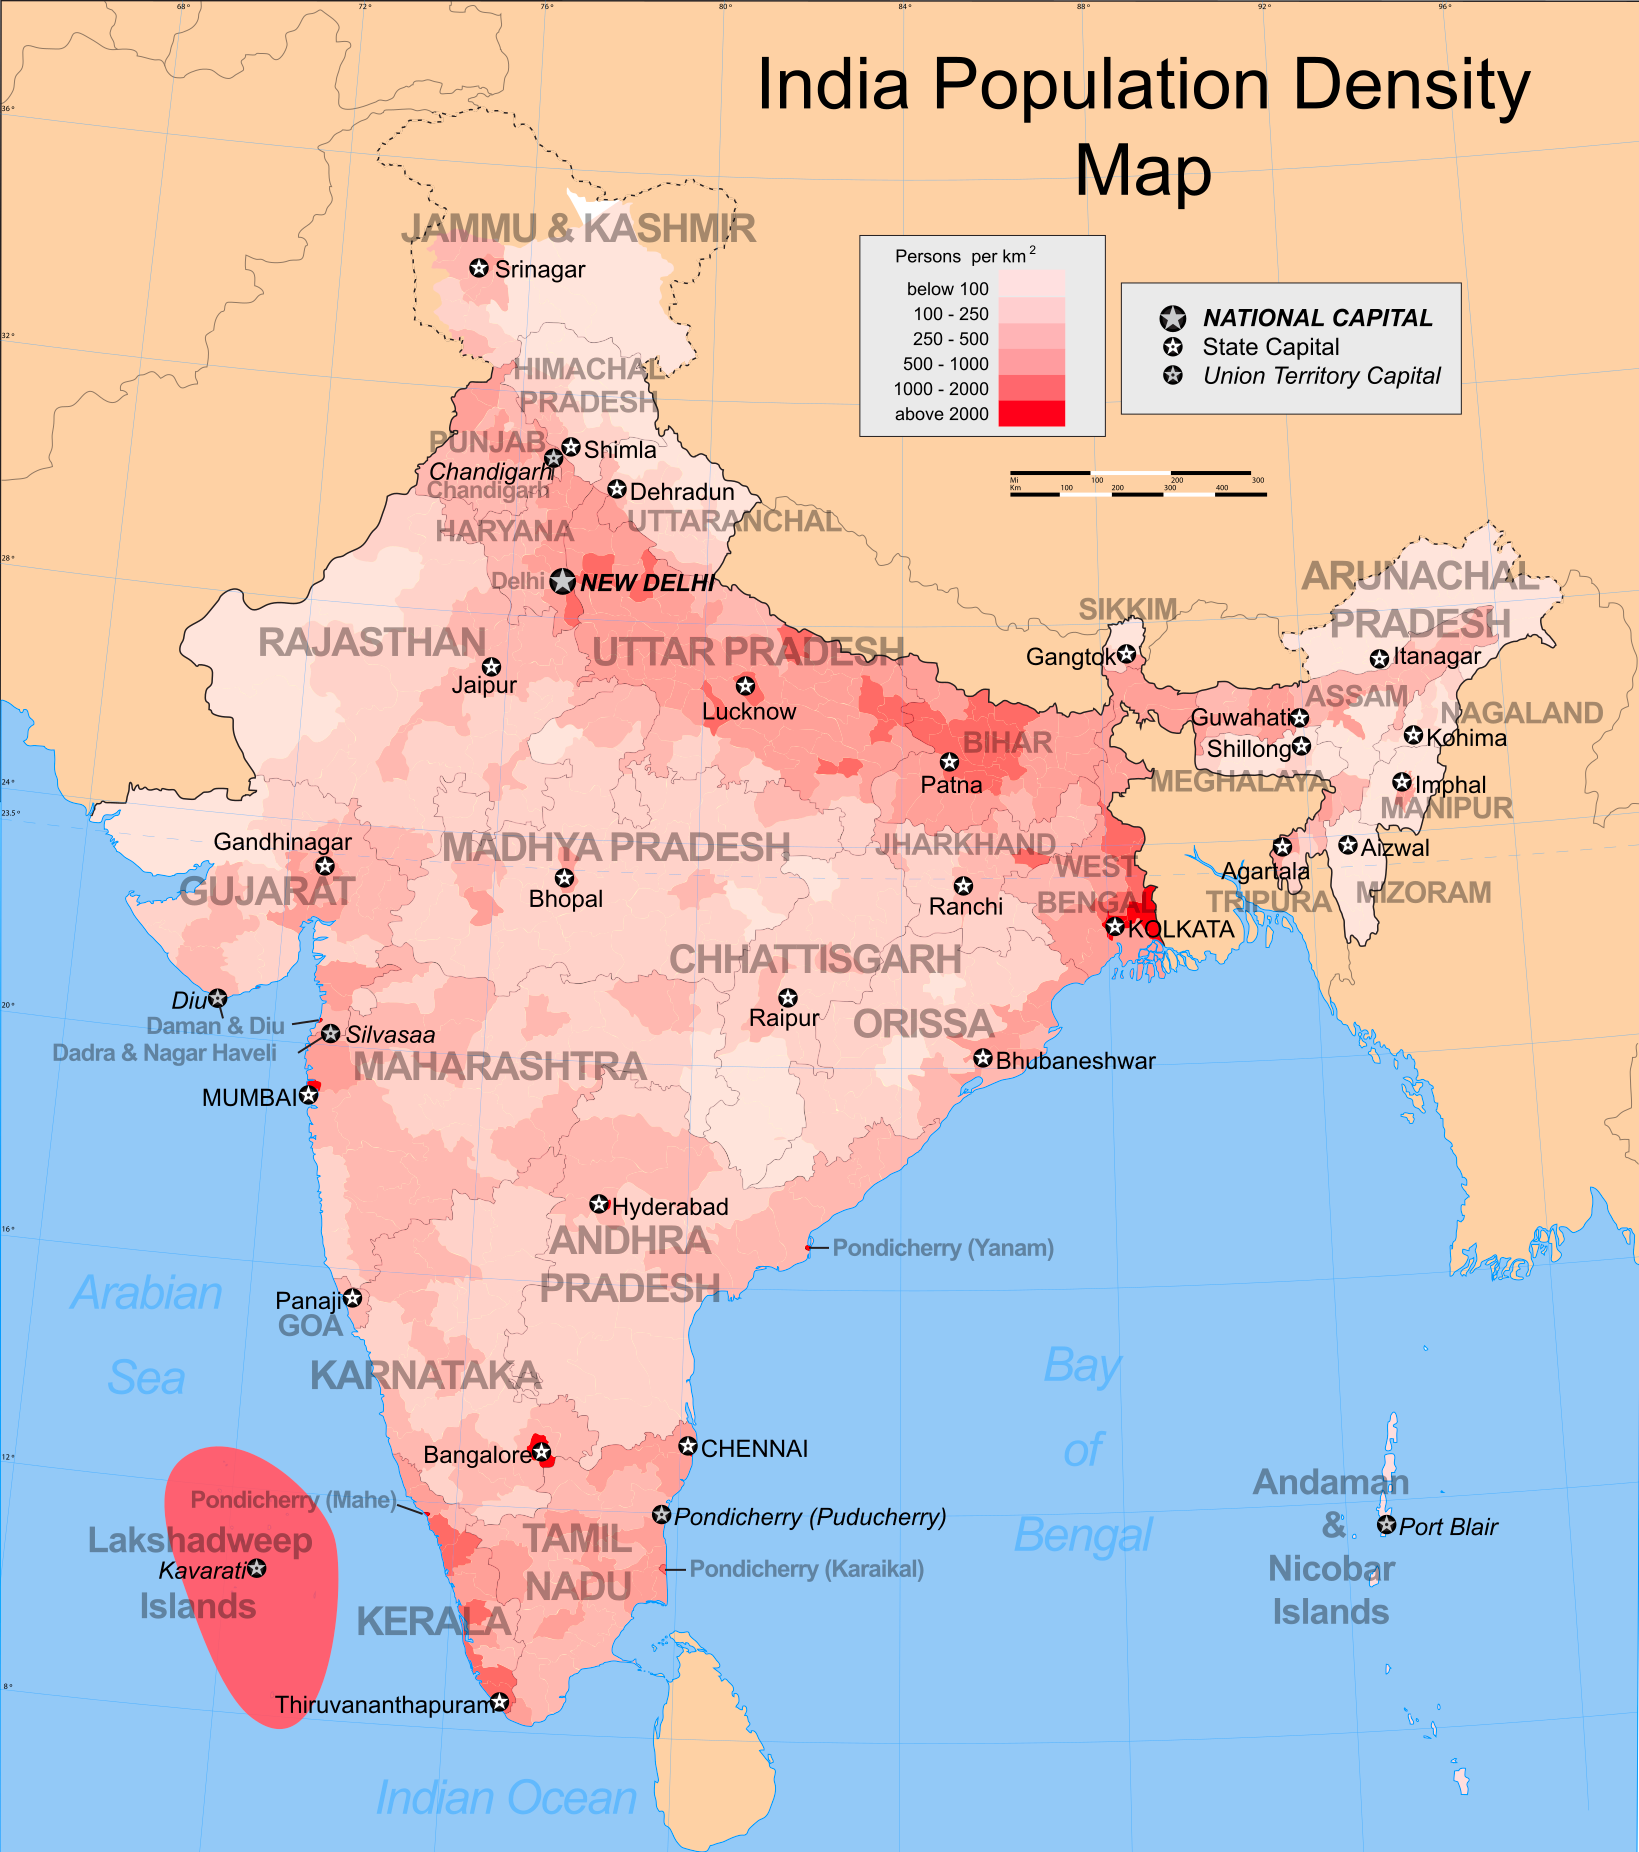
Choropleth Map
A thematic map that shows data aggregated for a specific geographic area, using different colors to represent different values.
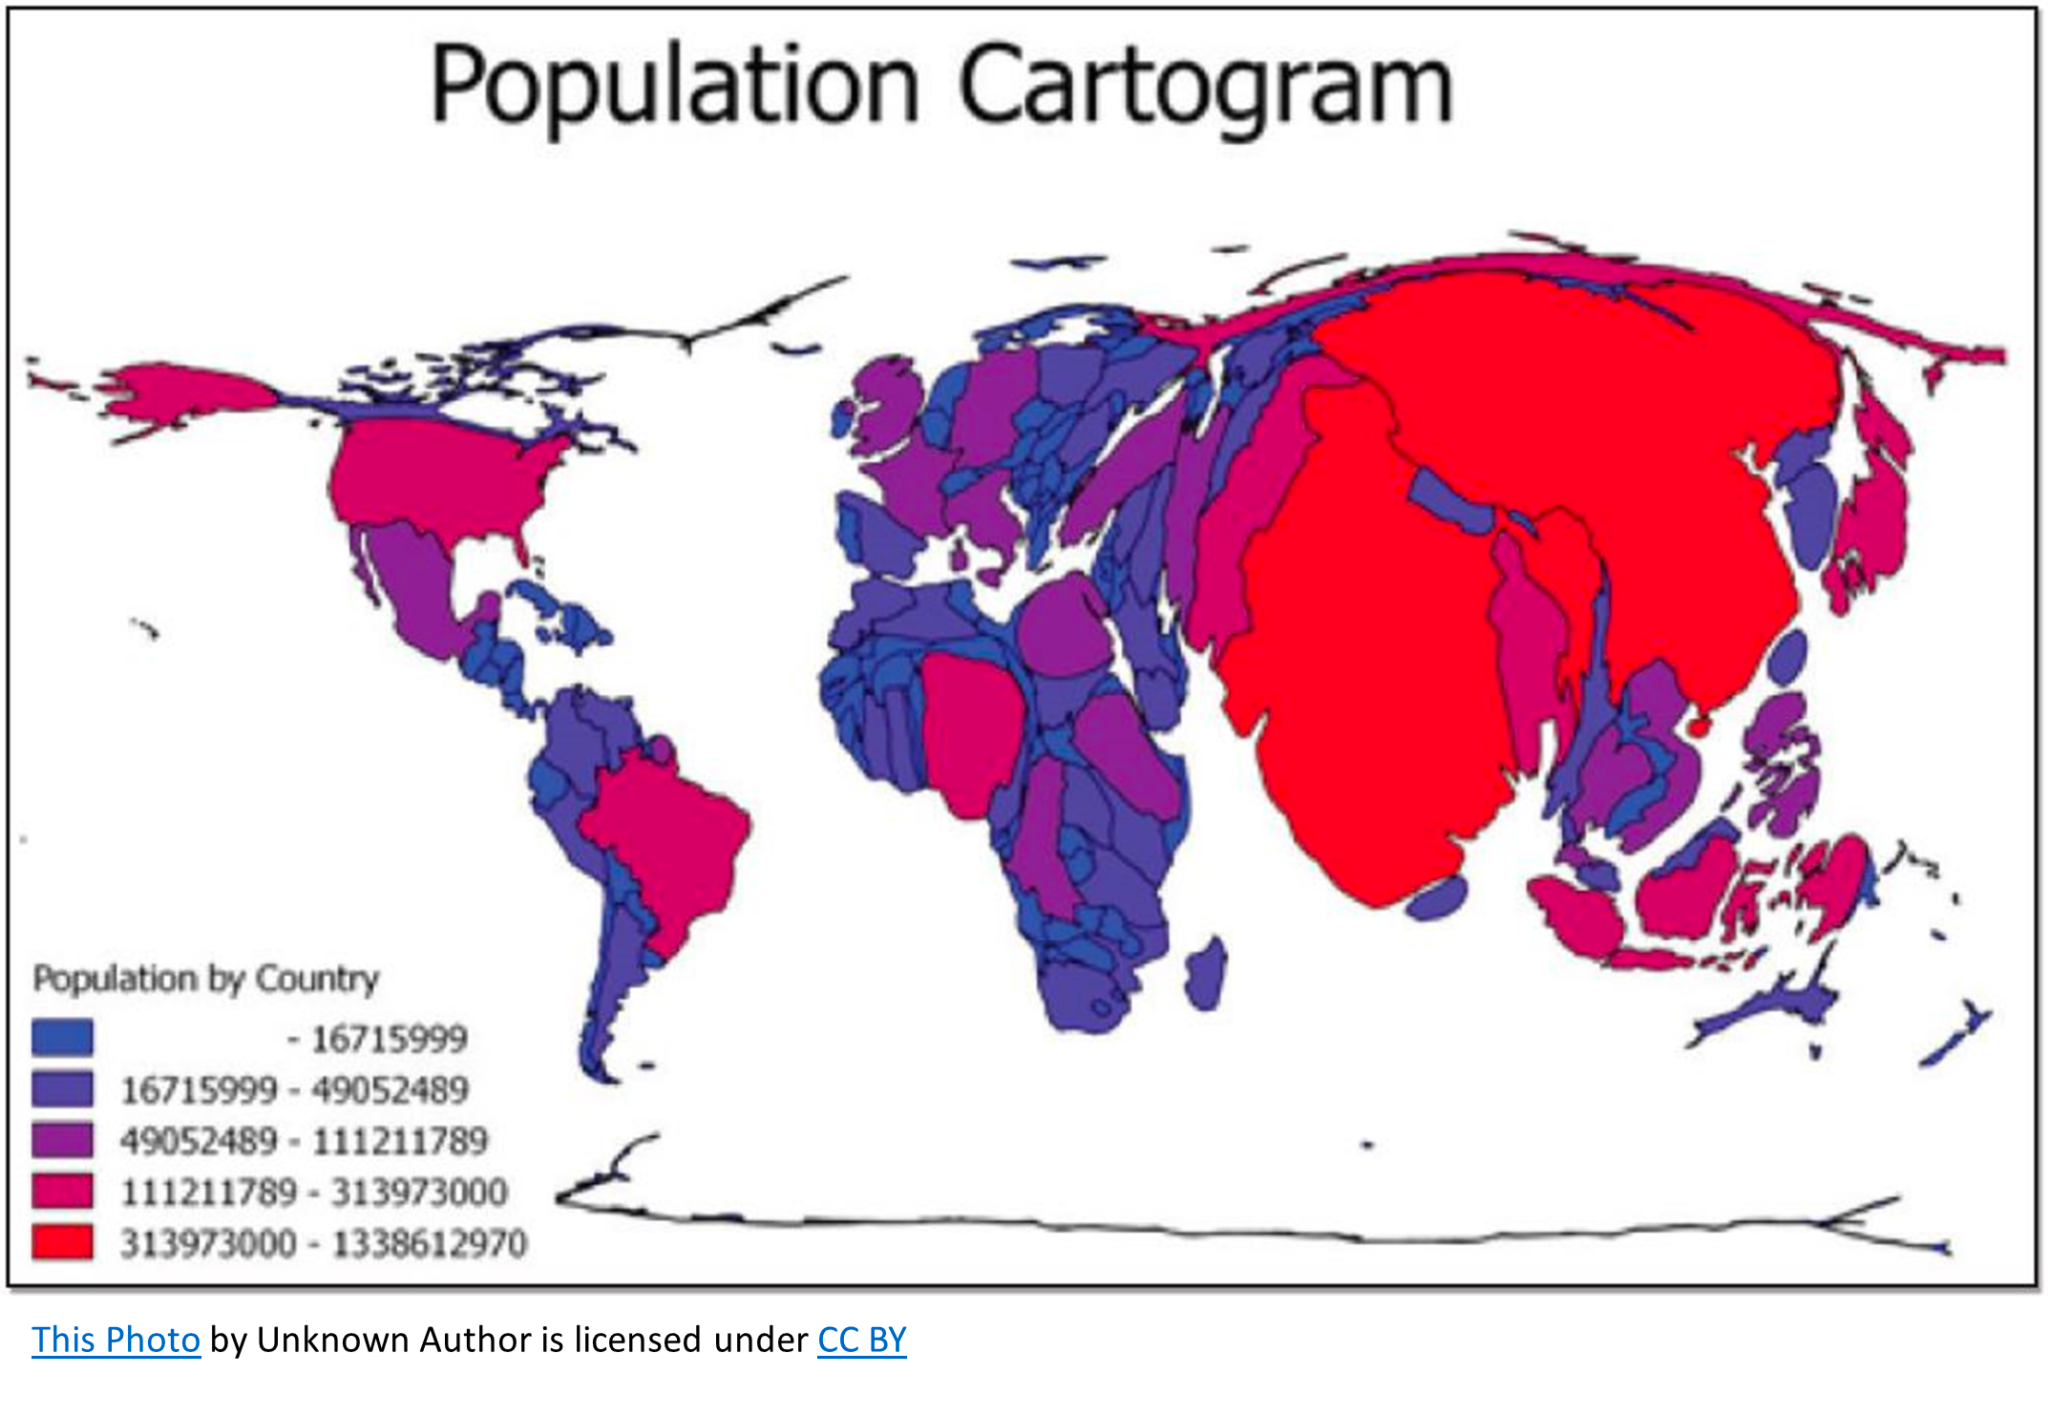
Cartogram
A thematic map that distorts the geographic shape of an area in order to show the size of a specific variable; the larger the area on a cartogram, the larger the value of the variable.
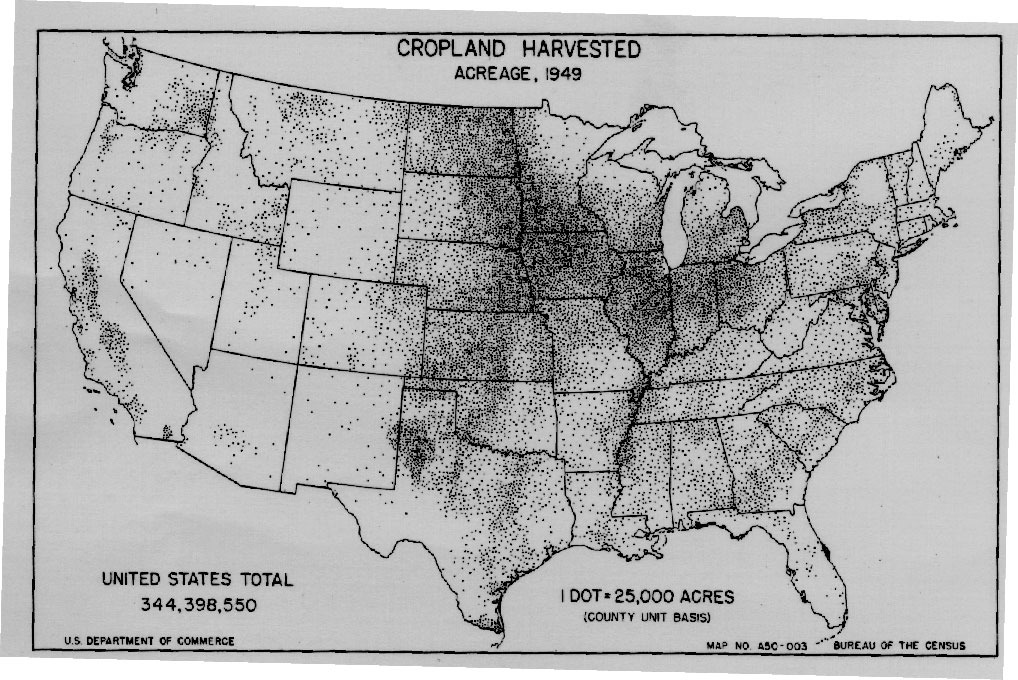
Dot Density Map
A thematic map that uses equally-sized dots to represent the frequency of a variable in a given area.
The more dots → the more dense the area is.
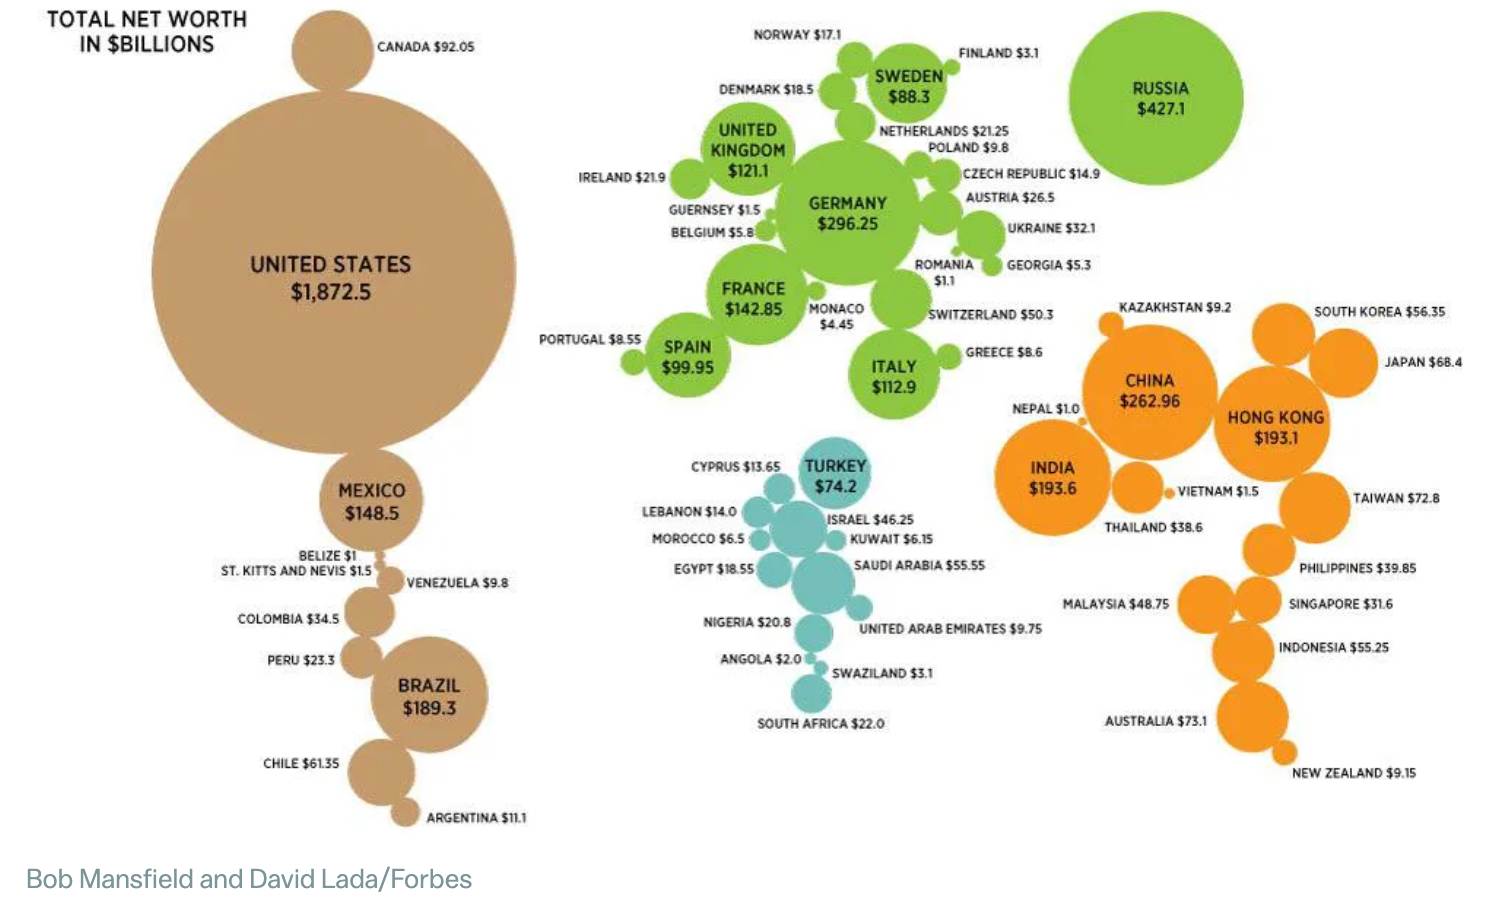
Proportional/Graduated Circle Map
A map that uses symbols such as circles of different sizes to represent numerical value.
The size of the circle is proportional to the value it represents.
A Projection
Method of showing the Earth’s 3D surface on a 2D map.
Map projections have distortions in shape, size (area), distance and direction.
Map projections differ in shape, size (area), distance and direction.
Maps are specific and limited in what they portray - different projections are used for different purposes.
Uninterrupted Map
A map that displays the entirety of the Earths surface
Interrupted Map
A map that attempts to remove distortion by removing parts of the globe
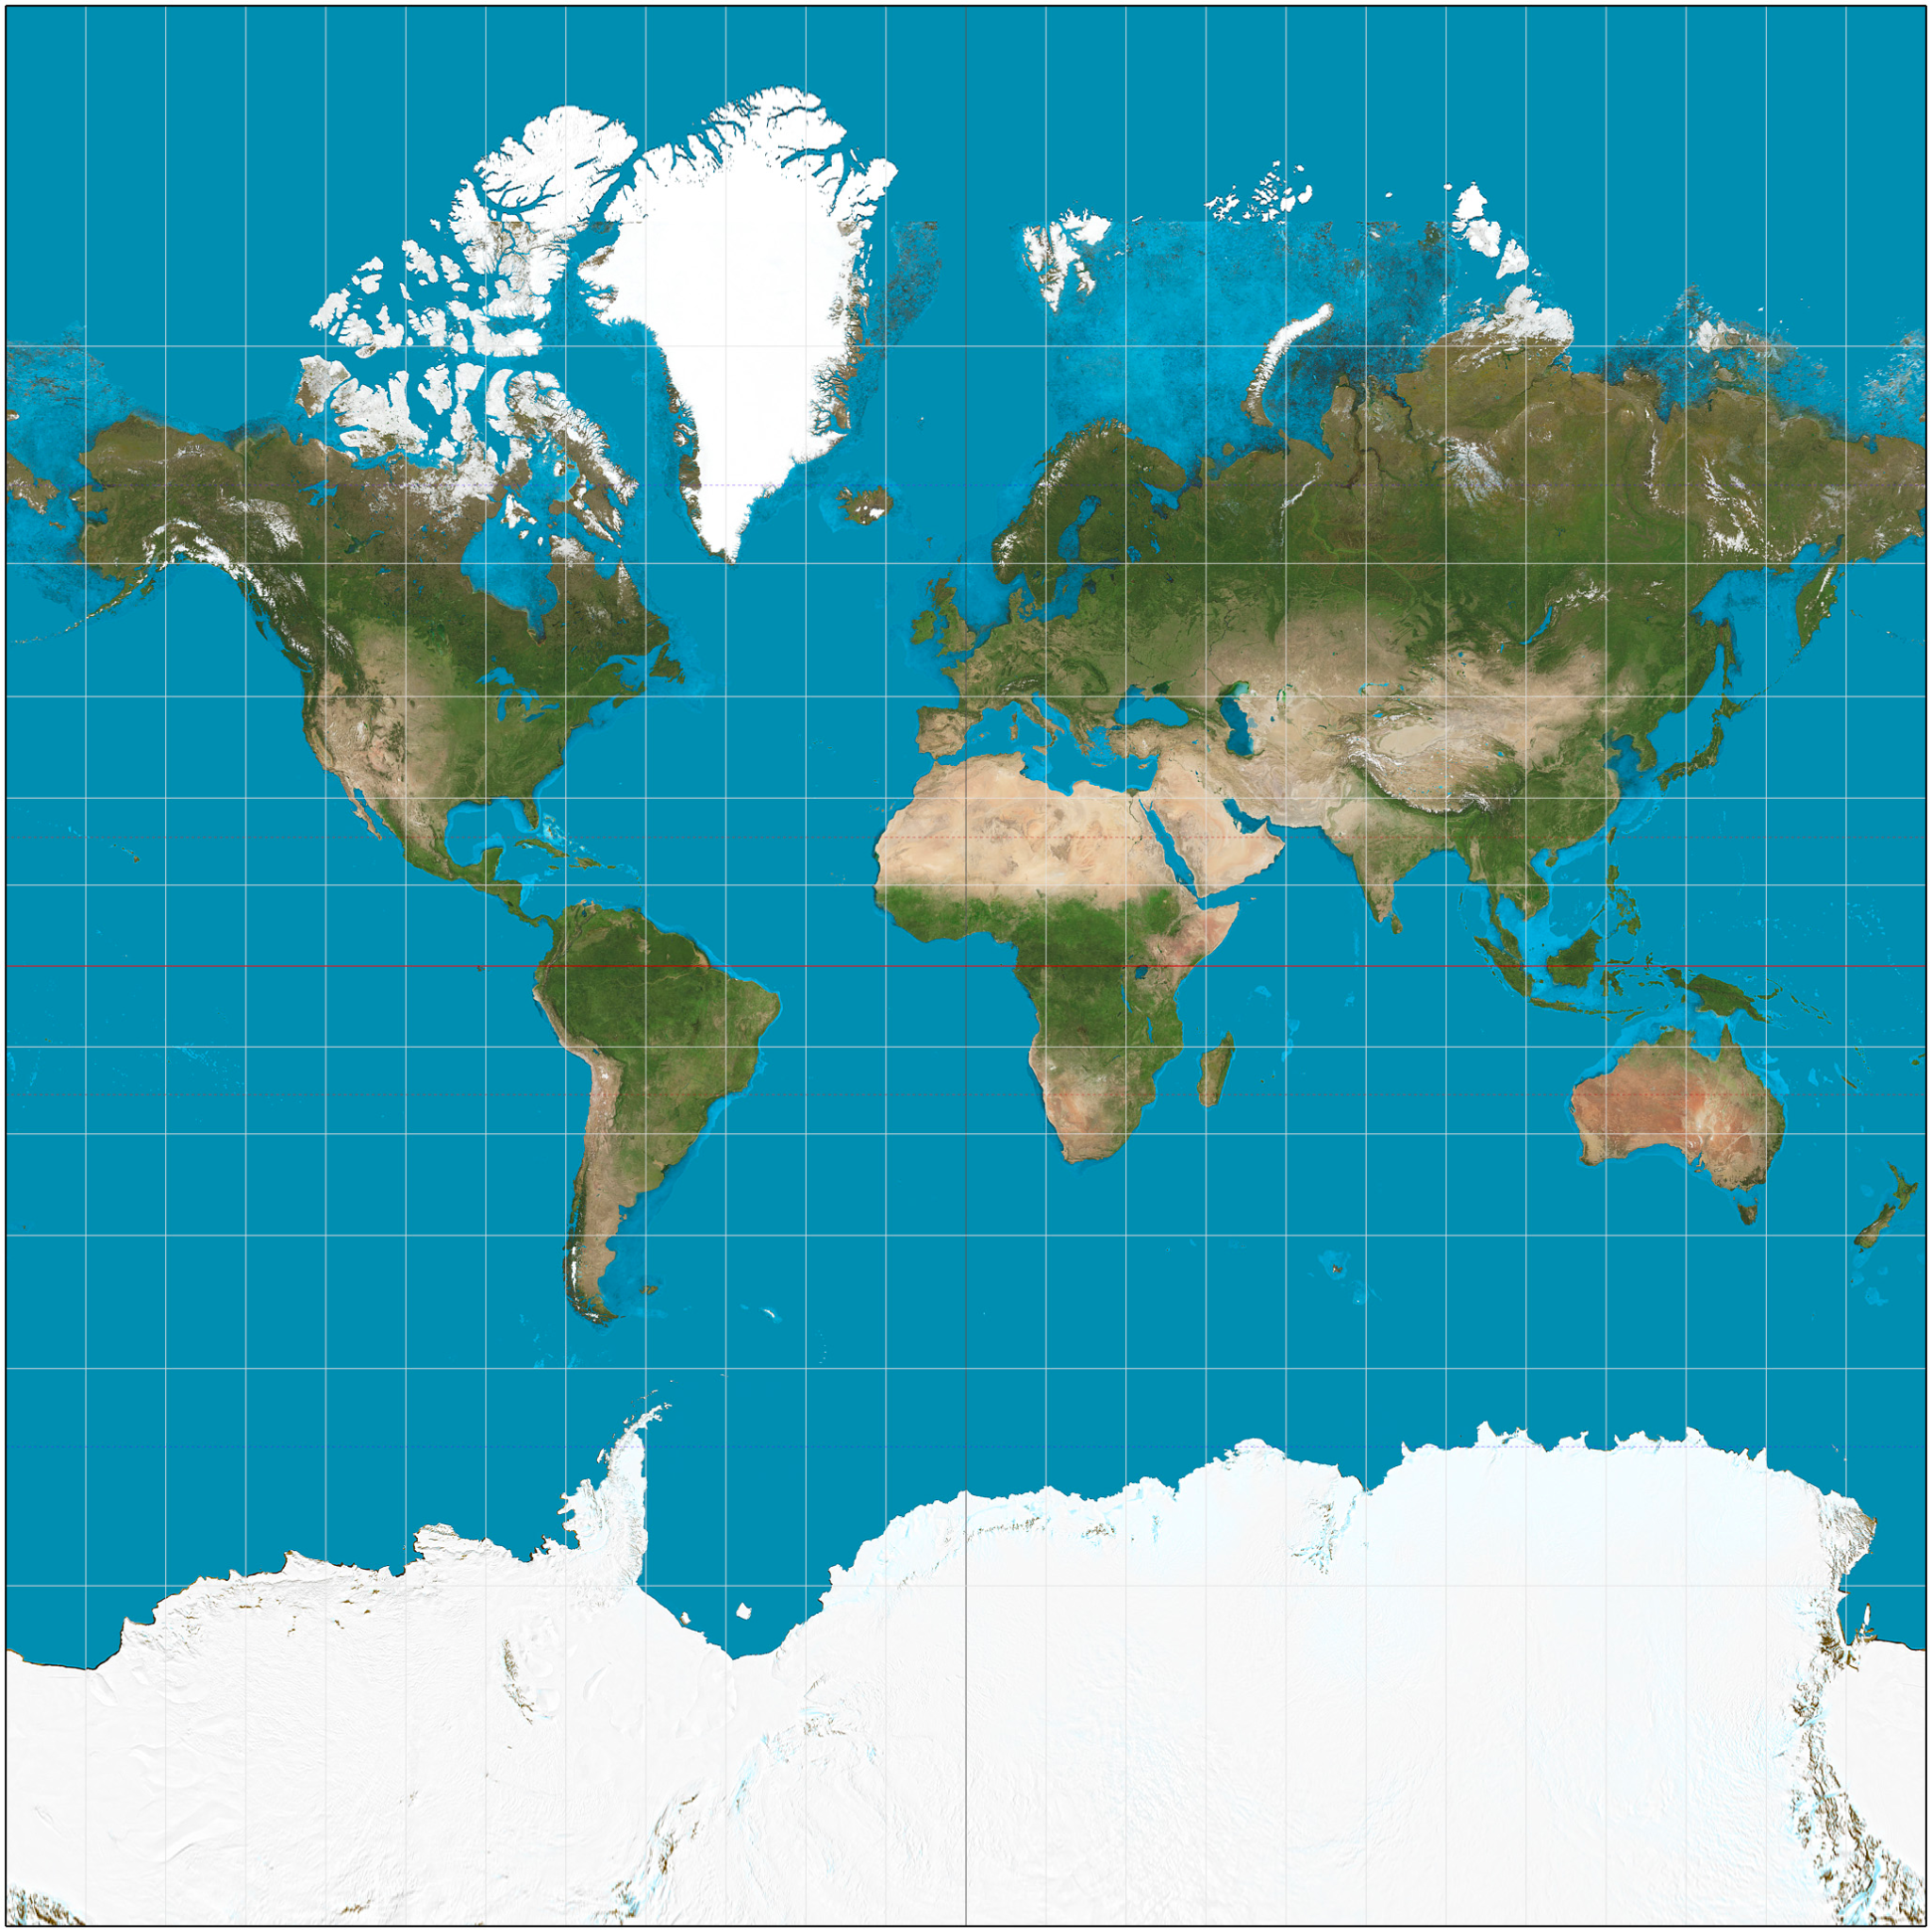
Mercator Projection
A map projection that Shows accurate direction & shape, but Size & location is distorted. Created for navigation. Most common.
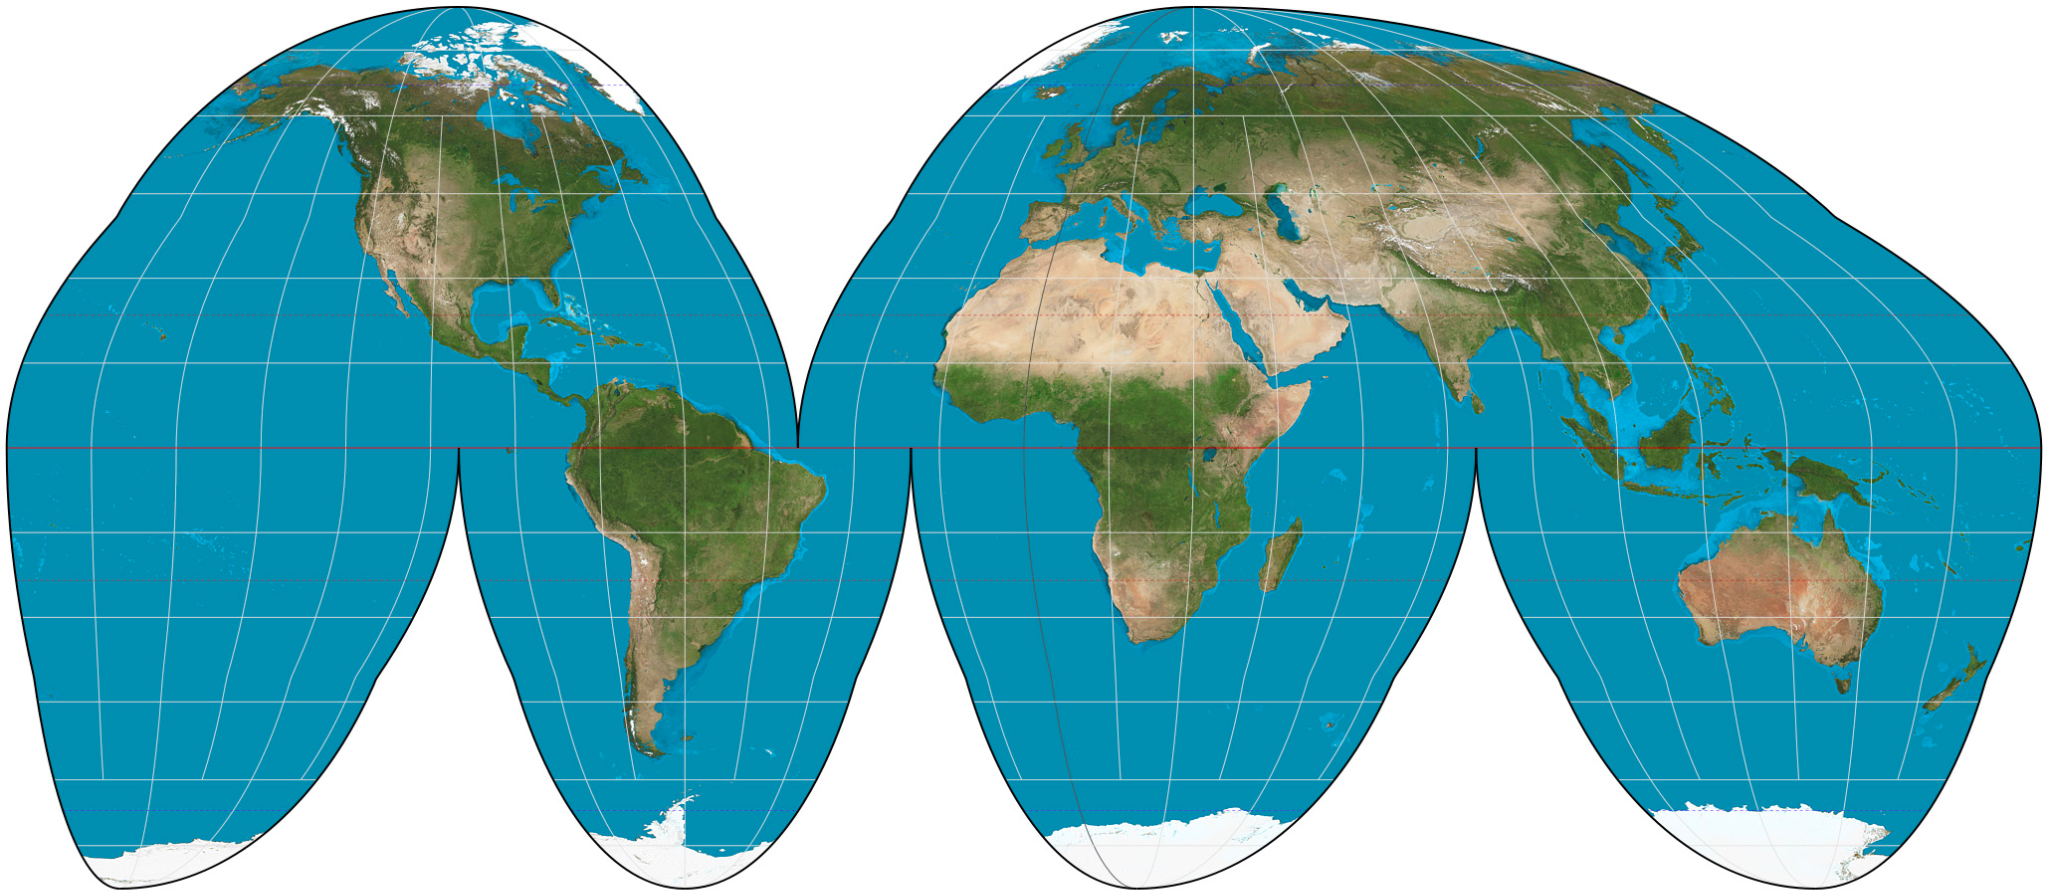
Goode Homolosine Projection
A pseudo cylindrical map projection that shows the true size and shape of land masses, but is interrupted
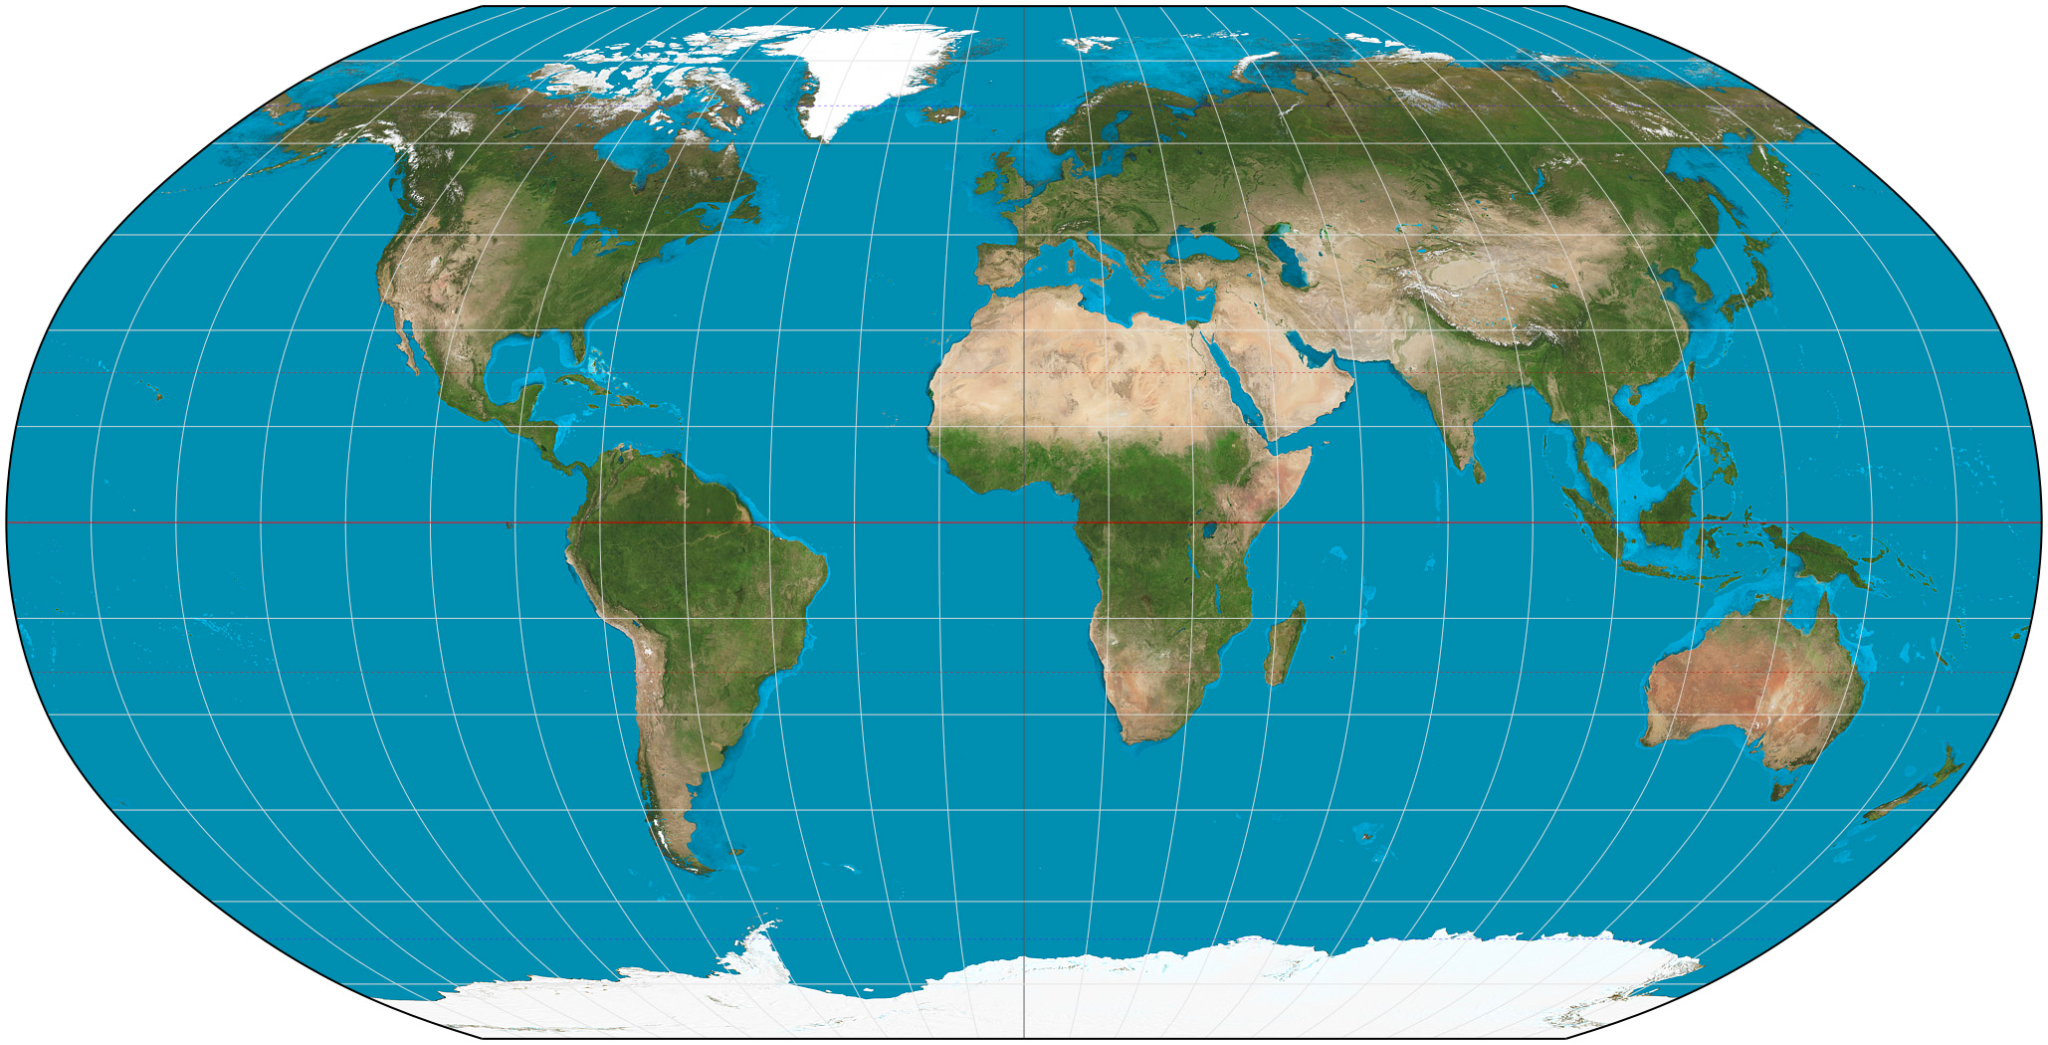
Robinson Projection
A map projection that is not does not show a perfect land area or proportion, but abandons both for a compromise. Shape/direction accurate. More distortion at the poles.
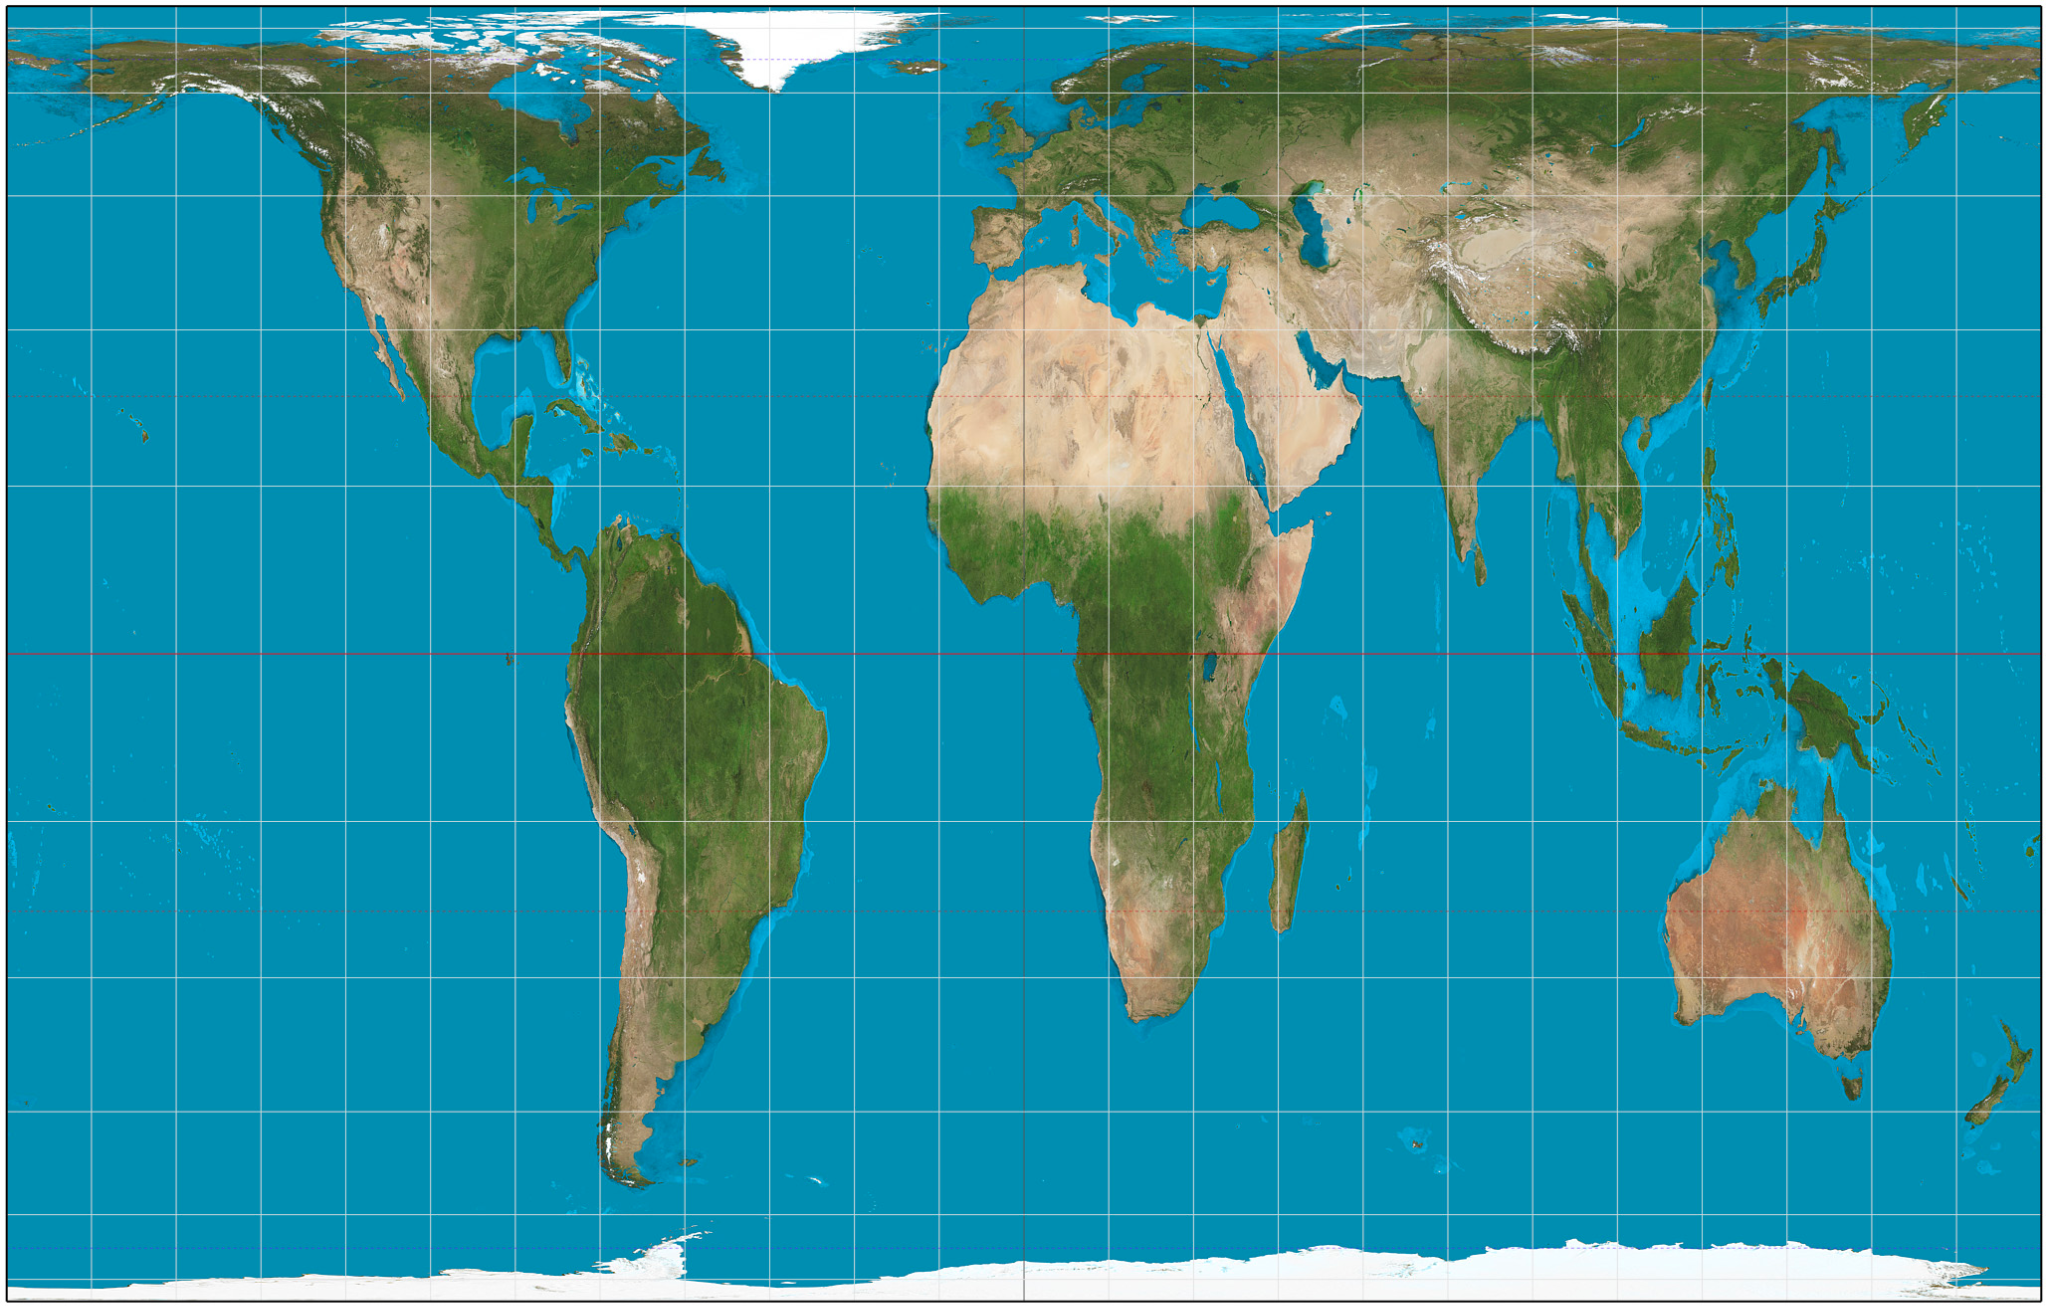
Gall-Peters Projection
A map projection that shows the actual size of landforms, but to get this accuracy, the shape is distorted.
Geographic Data
Any information connected to a location that includes data about physical and human characteristics.
It is gathered to look at the interaction between human activity and the physical environment.
It can include:
coordinates (latitude and longitude), names of places, addresses, terrain features, land use patterns, population statistics, and many other types of data.
2 Categories of data gatherers
Individual Data Gatherers - Geographers, researchers, regular citizens.
Geographers who work for an organization - Organizations have more resources for gathering information and access to more sophisticated data collection techniques.
Fieldwork
Learning and doing research involving first-hand experience (outside).
Census
An official count or survey of a population, which records various details about individuals, such as age, sex, and ethnicity.
Data Collection Methods
Interviews
-Field observations
- Surveys
Photo analysis
- Mechanical devices
Geospatial technologies
- Media reports
- Government documents
- Travel narratives
Geospatial technology
Hardware and software that can examine and measure geographical features of the Earth
3 Types of geospatial technology
Global Positioning System (GPS)
Geographic Information System (GIS)
Remote Sensing
Geographic Information System
A computer system that is for capturing, storing, checking, and displaying data related to positions on Earth’s surface. Shows data in layers.
Remote Sensing
A process of collecting information about the Earth’s surface from satellites.
Aerial Photography
Remote-sensing photography that produces detailed, high-resolution images.
Global Positioning System (GPS)
A network of satellites that are used to determine the location of something on the Earth’s surface
How is Spatial Information Used? Give examples
Spatial information is used in a wide range of applications where it is important to understand the layout and configuration of an area or environment. Some examples of how spatial information is used include: Mapping, surveying, location based services, environmental analysis
Time Distance Decay
The idea that near things are more related than distant things, and that interaction between two places decrease the farther they are apart.
Time-Space Compression:
The reduction of the time it takes for something or someone to go or interact from one place to another.
Environmental Determinism
Environmental determinism is considered a racist theory because it states that human behavior, intelligence, and social development are primarily shaped by the environment or geographical conditions people inhabit. This theory considered non-Europeans to be on a lower scale of cultural and physical development because they had not made the scientific and technological progress that Europeans had. Supporters of this theory believed that Europeans had the right and the duty to conquer non-European lands in order to bring the results of European progress to other countries. This theory was used as a tool to legitimize colonialism, racism, and imperialism in Africa, the Americas, and Asia. Environmental determinism made European geographers try to scientifically justify the supremacy of Europeans and the naturalness of imperialism.
Possibilism
The concept that the natural environment places constraints on human activity, but humans can adapt to some environmental limits while modifying others using technology.
Ecology
A biological science concerned with studying the relationships between living organisms and their physical environment.
Cultural Ecology
The study of the interactions between societies and their local environments.
Ecosystem
An ecosystem is made up of all of the living and nonliving things in an area. This includes all of the plants, animals, and other living things as well as non-living materials like water, rocks, soil, and sand.
Natural Resources
Anything that is found in nature that can be used by living things is a natural resource. This includes water, forests, fossil fuels, minerals, plants, animals and even air.
Nonrenewable Resources
Natural resources that cannot be replaced after they are used. This means that they exist in a fixed amount on Earth (ex. fossil fuels such as petroleum, coal, and natural gas).
Renewable Resources
A natural resource that cannot be used up or it is one that can be replaced within a human life span. Air, water, soil, plants, and animals are examples of renewable resources.
Greenhouse Gases
Gases in Earth's atmosphere that trap heat. They let sunlight pass through the atmosphere, but they prevent the heat that the sunlight brings from leaving the atmosphere. The main greenhouse gases are: Water vapor. carbon dioxide, nitrous oxide, methane, and chlorofluorocarbons.
Greenhouse Effect
A process that occurs when gases in Earth's atmosphere trap the Sun's heat. This process makes Earth much warmer than it would be without an atmosphere. The greenhouse effect is one of the things that makes Earth a comfortable place to live.
Sustainability
Sustainability is the idea that humans must interact with the environment in a way that ensures there will be enough resources left for future generations.
Large-scale map vs small-scale map
A large-scale map "zooms in" and shows more detail in a smaller area.
A small-scale map "zooms out" and shows less detail in a larger area.
4 common map scales
1. Local Scale
2. National Scale
3. Regional Scale
4. Global Scale
Geographic Scale of Analysis
The geographic extent (size) of the area under investigation.
Common Geographic Scales of Analysis
Global Scale of Analysis
2. Regional Scale of Analysis
3. National Scale of Analysis
4. Local Scale of Analysis
Region
An area on the planet that is composed of places with similar physical or human characteristics.
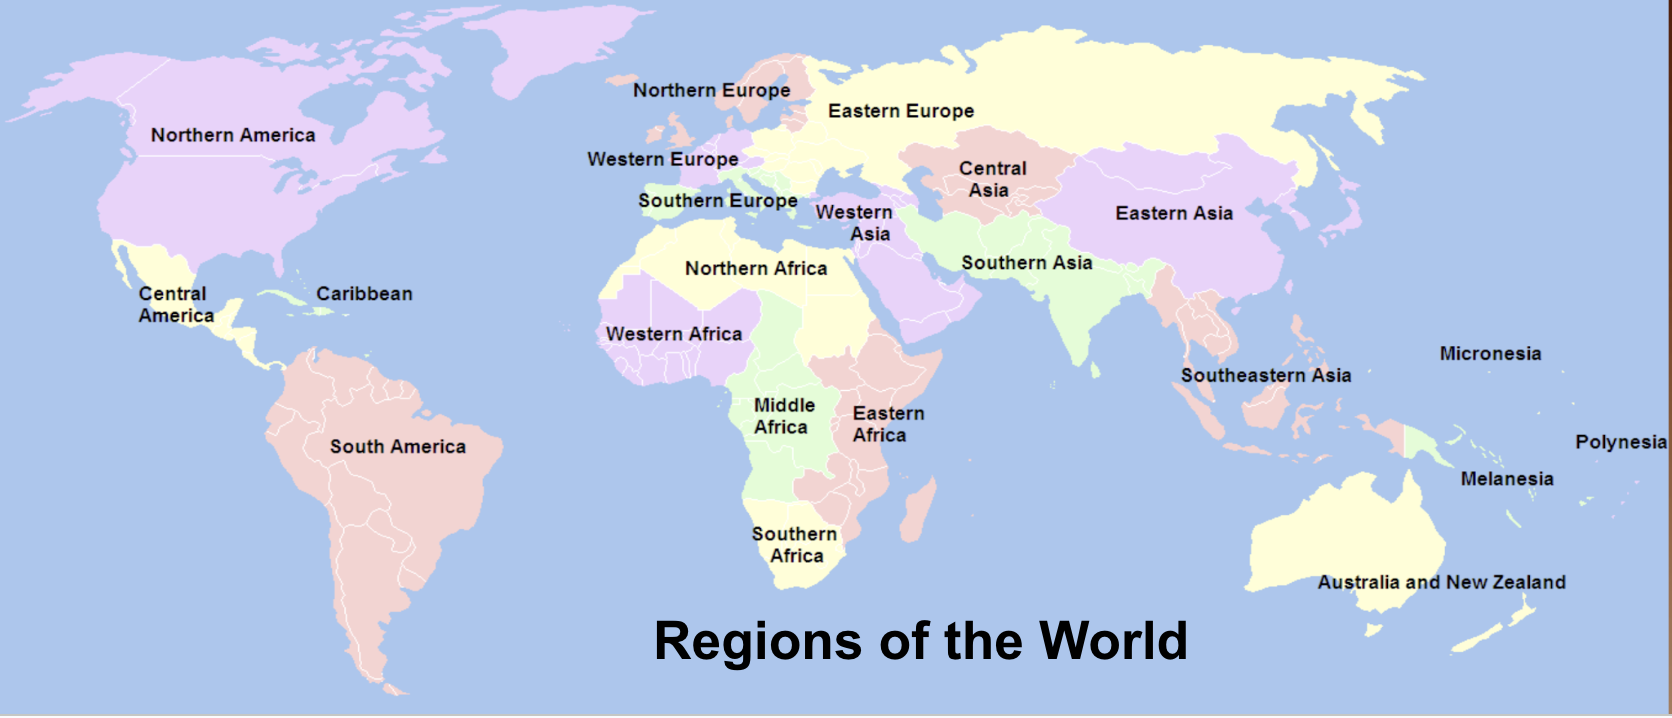
4 Types of Regions:
Formal Region
Functional Region
Vernacular Region
Perceptual Region
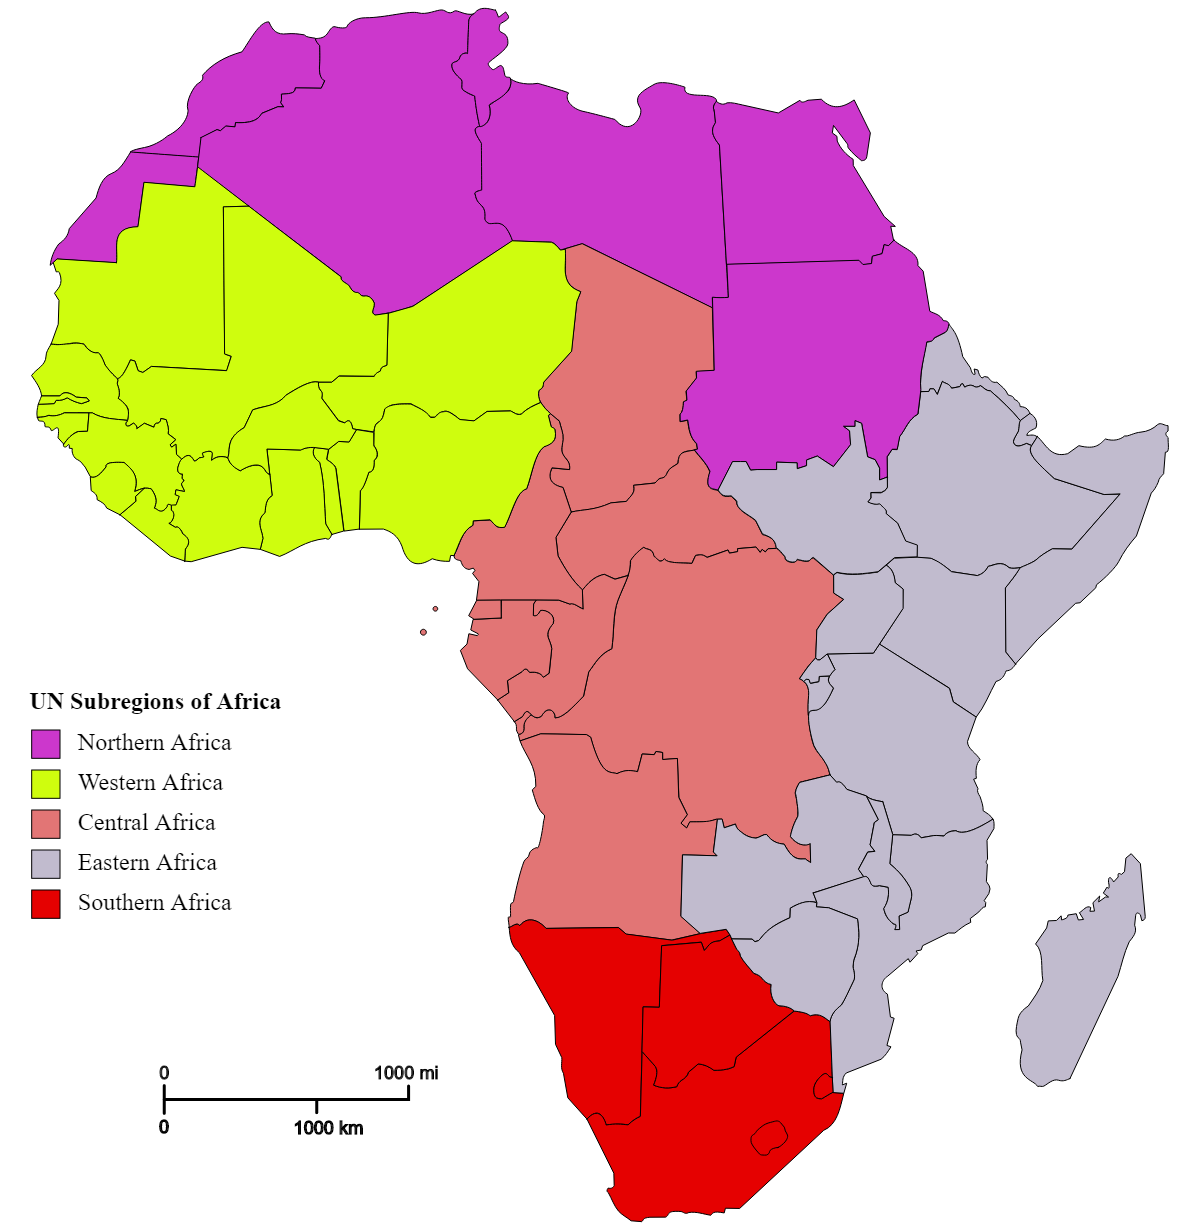
Formal Region
A region whose boundaries are formally defined.
Functional/nodal Region
A central place and surrounding areas affected by it.
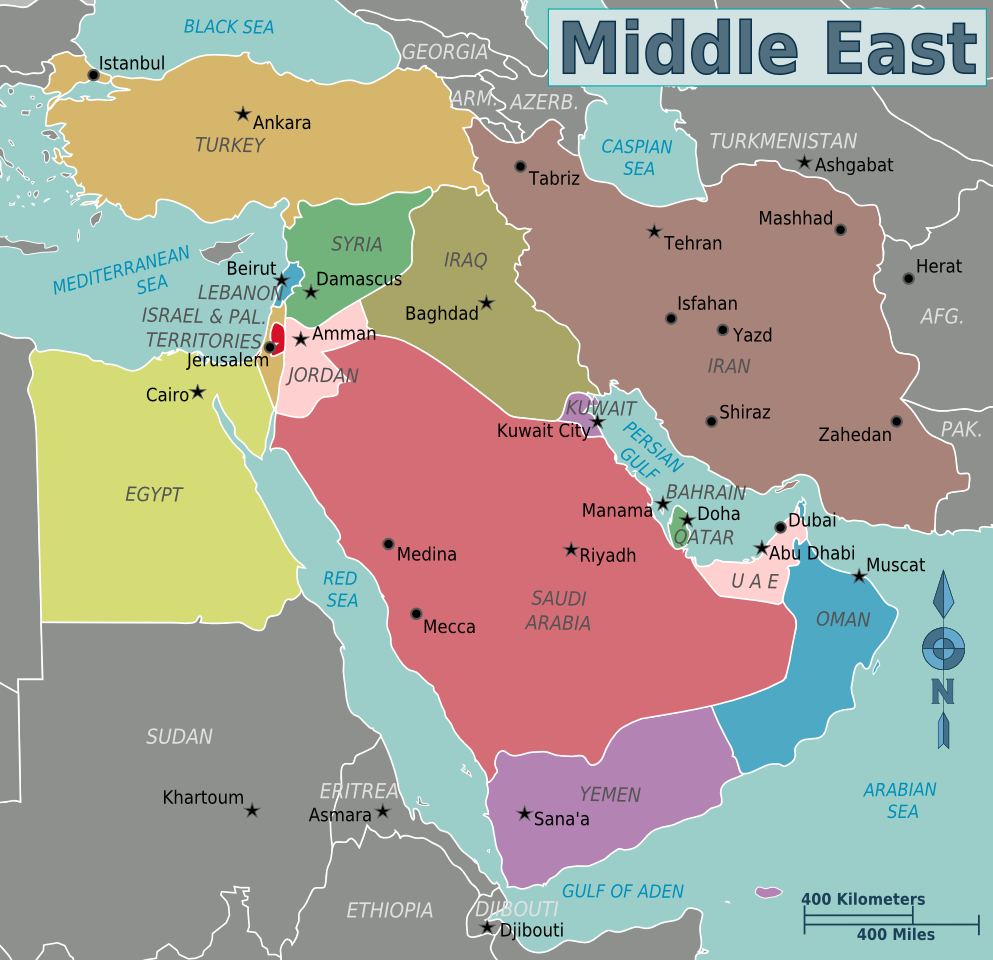
Vernacular Region
A distinctive area where the inhabitants collectively consider themselves interconnected by a shared history, mutual interests, and a common identity. The Middle East & Latin America are considered vernacular regions
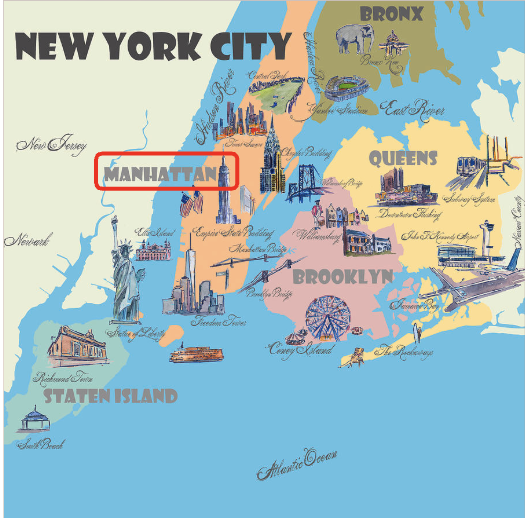
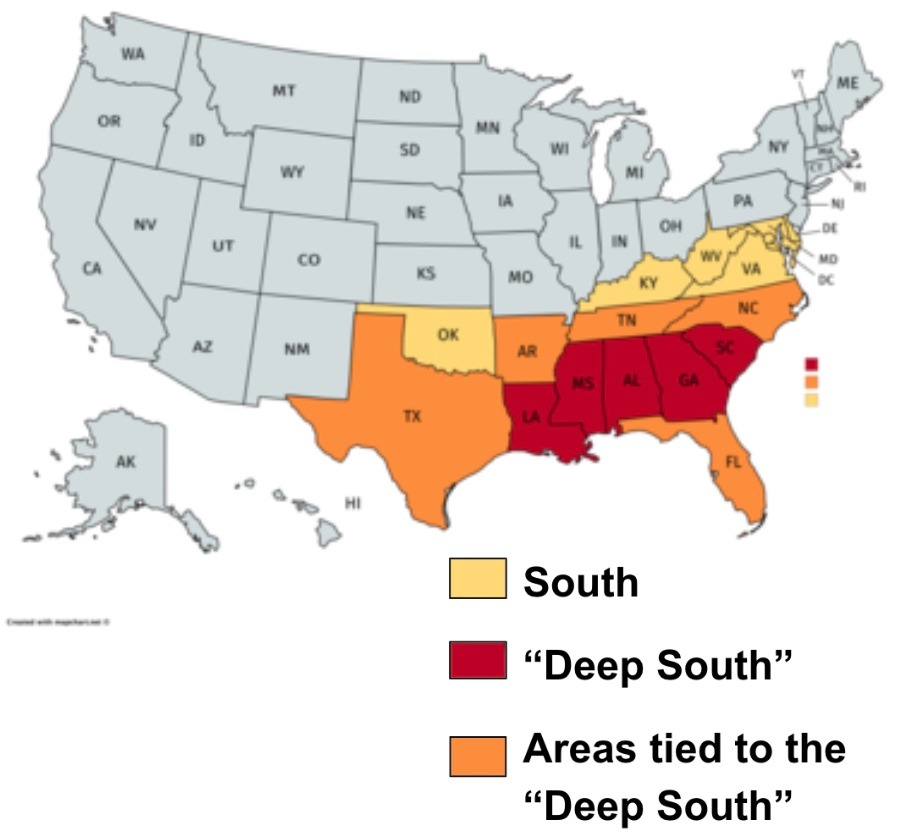
Perceptual Region
A region defined by people’s opinions, stereotypes, or perceptions, which may vary widely. The South (or Deep South) of the USA is a perceptual region because it is defined by cultural identity and shared perceptions of history and tradition, but its exact boundaries are not universally agreed upon.
Population Distribution
The Pattern in which humans are spread out on Earth’s Surface.
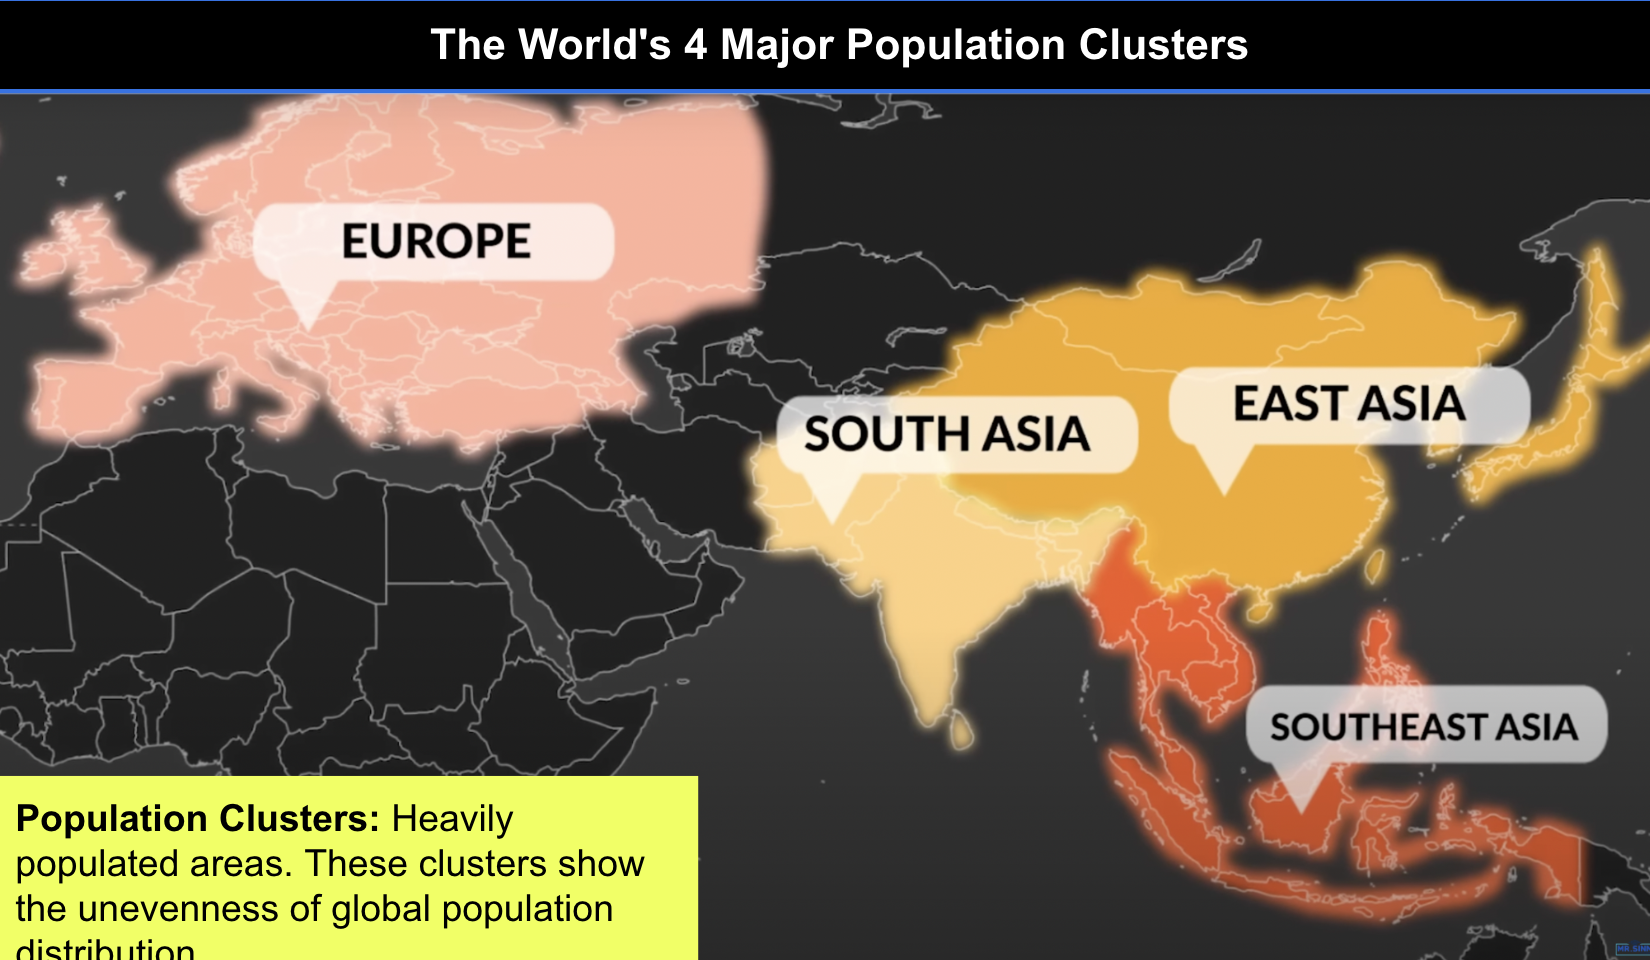
Population Clusters
Heavily populated areas. These clusters show the unevenness of global population distribution.
Population density
a measure that tells us how many people live in an area of a specified size.
Population Distribution is influenced by:
Physical Factors
&
Human Factors
Physical factors
Climate, landforms,and water bodies influence the distribution of population.
Climate (Physical factors)
People tend to live in moderate climates with mild temperatures and regular rainfall
Landforms (Physical Factors)
Most humans prefer to live on the flat, fertile coastal plains where it is easier to build cities, grow crops, and transport goods.
Water bodies (Physical Factors)
Large populations are concentrated near the coastal waters and rivers, since they provide access to fresh water, transportation, and trade.
Human Factors
Economics, history, politics and culture influence the distribution of population.
Economics (Human Factors)
Population is concentrated in cities with strong job opportunities and economic growth. Major ports in coastal cities also support trade, shipping, and industry, which attract workers and businesses.
History (Human Factors)
Where early settlment took place, Ex. East coast of the United States is where European colonizers first landed, so it has a large population.
Politics and Culture (Human Factors)
Places that have have grown into cultural and political hubs that attract large populations. These cities receive significant attention in national and state budgets, investing in growth, which fund infrastructure, public services, major events. They are also recognized as centers for sports, concerts, and festivals.
The three methods for calculating population density:
Arithmetic
Physiological
Agricultural
Arithmetic Density
This simply the total number of people divided by the total land area.
Physiological Density
the number of people per square unit of farmland
Agricultural Density
The number of farmers per unit of farmable land.
Developing countries have higher agricultural density because they are mostly agrarian (or at least not highly industrialized) and have lower standards of agricultural technology. Also, most subsistence agriculture is practiced in developing countries.
Developed countries have lower agricultural density because they use more technology for farming.
Effects of low and high population density on politics
LPD:
Less voters, but more local influence.
Less representation in government.
HPD:
More voters, but more diverse political opinions
More political representation in government
Effects of low and high population density on Economics
LPD:
Harder for government to provide services over large geographic area.
Higher cost per person for services.
Less goods and services available.
Less job opportunities.
Lower cost of living.
HPD:
Easier for government to provide services, but more services needed.
Lower cost per person for services.
Businesses are more attracted to areas with more potential customers.
More job opportunities, but more competition.
Higher cost of living.
Effects of low and high population density on social
LPD:
Greater sense of community.
Lower crime rate.
Slower pace of living.
Less access to public services
HPD:
Lower sense of community.
Faster pace of living.
Higher crime rate.
More access to public services
Effects of low and high population density on Environment
LPD:
More green spaces.
Less environmental pollution.
HPD:
Less green spaces.
More environmental pollution.
Challenges of a high population density
Urban areas with a high arithmetic density have an increased need for services and infrastructure. The demands caused by high population density are costly, and negative political, economic, social and environmental consequences can result if countries don’t adequately provide basic services for citizens.
Population Composition
Population composition refers to the characteristics of a population including age and sex.
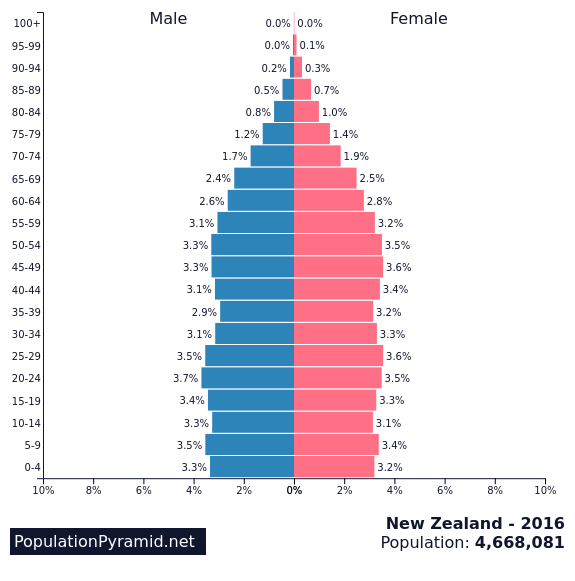
Population Pyramid
A bar graph that represents the distribution of the population by sex and age.
Age Distribution
The way people are divided into different age groups in a population. The number or percentage of people in each age group.
Sex Ratio
Ratio of males to females in a population.
Causes of Fewer Women in a population
Sex-selective practices: In some countries, cultural preferences for sons lead to selective abortions or neglect of daughters.
Maternal mortality: High rates of death during childbirth can lower the share of women.
Labor migration: Gulf states (like Qatar or UAE) show fewer women because many working-age men migrate in for construction and labor jobs.
Causes of Fewer Men in a population
Labor migration: In some societies, women are less likely to migrate for work, leaving behind a male-heavy labor force abroad but a lower share at home.
Wars and conflicts: Countries that experience high male combat deaths (historically or recently) often have more women.
Life expectancy: Globally, women live longer than men, so older age groups are often female-dominated.
Life Expectancy
The number of years a person can expect to live.