2 : MEASURES OF CENTRAL TENDENCY, HISTOGRAMS, VARIABLES AND RESEARCH DESIGN
1/14
There's no tags or description
Looks like no tags are added yet.
Name | Mastery | Learn | Test | Matching | Spaced | Call with Kai |
|---|
No study sessions yet.
15 Terms
CENTRAL THEORUM
People tend to cluster in the same amount of scores
Larger the sample - the more data points more normally distributed
MEASURES OF CENTRAL TENDENCY
Allows data to become more efficient
Allows for statistical analysis
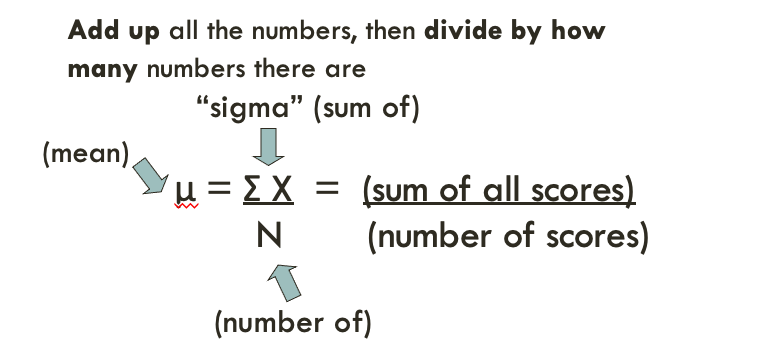
CENTRAL TENDENCY: MEAN
THE AVERAGE SCORE
HOW TO: add all numbers together divide by data point
PROPERTIES: mean can be influenced by extreme values ‘outliers’
CENTRAL TENDENCY: MEDIAN
THE MIDDLE NUMBER OF RANKED DATA
HOW TO: order the number in ascending order and see the middle number, if there is 2 middle numbers — add & divide by 2
PROPERTIES: not influenced by extreme scores
CENTRAL TENDENCY: MODE
THE MOST COMMON VALUE
HOW TO: find the most common value within the data set
PROPERTIES: represents the highest bar in bar chart, more than 1 mode = not normally distrubuted
Bimodality = hint that data isnt normally distrubuted
MEASURES OF DISPERSION
Statistical tools used to quantify the spread or variability of data points in a dataset. They include range, variance, and standard deviation.
DISPERSION: STANDARD DEVIATION
S = √(Σ(x - μ)² / N-1)
To calculate the standard deviation in psychology, follow these steps:
Calculate the mean (average) of the data set.
Subtract the mean from each data point and square the result.
Calculate the mean of the squared differences.
Take the square root of the mean from step 3.
This will give you the standard deviation, which is a measure of how spread out the data is from the mean in psychology.
A statistical measure that quantifies the amount of variability or spread in a dataset. It calculates the average distance between each data point and the mean. A higher standard deviation indicates greater dispersion, while a lower standard deviation suggests less variability.
HISTOGRAMS
A histogram is a graphical representation of the distribution of a dataset. It consists of a series of bars, where each bar represents a range of values and the height of the bar represents the frequency or count of values within that range.
how many times someone got that specific score
Right/Positive skew: test is too hard
Left/Negative skew: test is too easy
INDEPENDANT VARIABLE
Manipulated by researcher - controlled
e.g practice time, no of syllables
DEPENDANT VARIABLES
change accord to how the p response to IV
categorical data: e.g eye colour
numerical data: e.g no of words recalled
must be repped by number before analysis e.g convert to percentage
SUBJECT VARIABLES
changes according to p’s characteristics - uncontrolled
changes because is differs between people
e.g gender, age
EXPERIMENTAL
IV is manipulated DV is effected - controlled conditions
QUASI
uses at least one naturally occurring IV (subject variable)
CORRELATIONAL
looking at relationships between DVs
OBSERVATIONAL
ALL INVOLVE DV’S - We are always measuring something about our p’s