Week 1: Chapter 2 Data Representation
 Call Kai
 Learn
Learn Practice Test
 Spaced Repetition
 Match
Match Flashcards
 Knowt Play
1/60

There's no tags or description
Looks like no tags are added yet.
Name | Mastery | Learn | Test | Matching | Spaced | Call with Kai | Chat |
|---|
No analytics yet
Send a link to your students to track their progress
61 Terms
Tabular display of distribution
Frequency distribution
Cumulative frequency distributions
Relative frequency distributions
Cumulative relative frequency distributions
What questions does Frequency Distribution answer
-Which score occurred the most frequently?
-Which scores were the highest and lowest?
-Where do most of the scores tend to fall?
Symbol X meaning
The score/value
Symbol f meaning
Frequency, or number of times the score occurs
Symbol n meaning
sample size, or total number of observations.
Largest f. What score occurred most frequently? (aka Mode)
X=16 f=1
X=17 f=5
X=18 f=3
X=17 f=5
Cumulative Frequency
How many observations have that score OR a lower score
Cumulative frequency at 9
X=9 f=1
X=10 f=1
X=11 f=2
cf=1; 1 person scored 9 or lower
Cumulative frequency at 10
X=9 f=1
X=10 f=1
X=11 f=2
cf=2; 2 people scored 10 or lower
Cumulative frequency at 11
X=9 f=1
X=10 f=1
X=11 f=2
cf=4; 4 people scored 11 or lower
Cumulative frequency at 12
X=9 f=1 cf=1
X=10 f=1 cf=2
X=11 f=2 cf=4
X=12 f=1
(cf)+(f)=next cf
4+1=5
cf=5; 5 people scored 12 or lower
Relative Frequency
Percentage contained in an interval; aka a proportion or percentage
Relative Frequency Formula
f/n
Relative Frequency of 17
X=16 f=1 cf=12
X=17 f=5 cf=17
n=25
rf = f/n
5/25 = .20
=20%
Cumulative Relative Frequency
Percentage of scores in that interval and smaller
rf+crf
Cumulative Frequency at 9
X=9 f=1 cf=1 rf=.04
X=10 f=1 cf=2 rf=.04
X=11 f=2 cf=4 rf=.08
.04 → 4%
Cumulative Frequency at 10
X=9 f=1 cf=1 rf=.04
X=10 f=1 cf=2 rf=.04
X=11 f=2 cf=4 rf=.08
.04+.04=.08 (crf)
.08→8%
Cumulative Frequency at 11
X=9 f=1 cf=1 rf=.04
X=10 f=1 cf=2 rf=.04
X=11 f=2 cf=4 rf=.08
.08+.08=.16 (crf)
.16→16%
Real limits
Midpoint of each value, considering decimals
Lower Real Limit (LRL)
Upper Real Limit (URL)
Upper Real Limit (URL)
Decimal values above whole number
Upper Real Limit (URL) of 18
18.5
Lower Real Limit (LRL) of 18
17.5
Find the midpoint of Real Limits
add values and divide them by 2
Midpoint between 17 and 18
(17+18)/2 = 17.5 (LRL)
(18+19)/2 = 18.5 (URL)
Interval Width (w)
Difference between the Upper and Lower Real Limits of an interval
How to find Interval Width (w)
w = URL-LRL
Interval Width of 18
URL = 18.5, LRL = 17.5
w = 18.5 - 17.5
w = 1
Ungrouped Frequency Distribution
Each score gets its own row
Score=9, Frequency=1
Score=10, Frequency=1
Score=11, Frequency=2
Ungrouped Frequency Distribution Interval Width
w=1
Grouped Frequency Distribution
Combine scores
Interval= 9-10, f=2
Interval = 11-12, f=3
Interval = 13-14, f=3
Grouped Frequency Distribution Interval Width
Interval= 9-10, f=2
Interval = 11-12, f=3
Interval = 13-14, f=3
w=2
Why group data
Listing every single score is not helpful.
over a hundred rows of data could be grouped into intervals
Bar Graphs are appropriate for which data
Nominal data
Bar Graphs
Separate and don’t touch
Histograms
Separated but touch. Because the values have an underlying order/continuity (continuous)
Histograms are appropriate for which data
Ordinal, interval, and ratio data
Frequency Polygons
find the midpoint of each interval, plotting frequency, and connecting them
Frequency Polygons are appropriate for which data
ordinal, interval, and ratio
What does X represent in Frequency Polygon (X, Y)
Interval midpoint
What does Y represent in Frequency Polygon (X, Y)
Frequency
Cumulative Frequency Polygon
Continuously increases or stays the same, connected throughout and cannot decrease
Uses cumulative frequencies rather than regular frequencies.
Points are plotted at the upper real limits
What does X represent in Cumulative Frequency Polygon
scores/interval
What does Y represent in Cumulative Frequency Polygon
Cumulative Frequency
Shapes of Frequency Distribution: Normal
Symmetrical, bell-shaped
Most observations are around the center.
Fewer observations at both extremes.
The left and right sides are approximately mirror images.

Shapes of Frequency Distribution: Positive
Long tail points right
Most scores are low. A few scores stretch toward the high side.
Most scores are low, but 20 stretches the distribution toward the high end
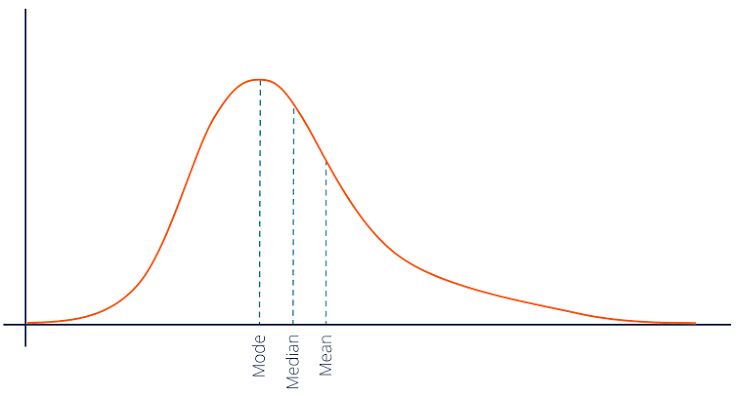
Shapes of Frequency Distribution: Negative
A few low scores stretch toward the lower side.
Tail toward the negative/low side.
Mostly high scores and a few lower ones
Stem-and-Leaf
Lets you see the distribution while retaining the original scores.
Reconstruct original scores
In Stem-and-Leaf what does the Stem represent
Left vertical values
First part of the number/value
Stem Example in Stem-and-Leaf
4, 20, 83, 201
0
2
8
20
In Stem-and-Leaf what does the Leaf represent
Remaining digit/unit of each score
Ones, behind decimal, etc.
Leaf Example in Stem-and-Leaf
4, 20, 83, 201
4
0
3
1
Correct Stem-and-Leaf Display
4, 20, 83, 201
0|4, 2|0, 8|3, 20|1
Percentile
A score below which a certain percentage of the distribution falls.
Actual scores that are continuous values
Percentile example
50th percentile equals 150
50% of the distribution falls below a score of 150.
P50 = 150
Percentile Rank
Percentage of distribution of scores that fall below or less than a certain score
Percentile Rank example
Rank 150 has a percentile rank of 50
PR(150) = 50
Quartile ranks
Q1, Q2, Q3
Each rank has 25%
Quartile 1
Q1 = P25
25th Percentile
Quartile 2
Q2 = P50
50th Percentile = median
Quartile 3
Q3 = P75
75th Percentile
Percentile Calculation