3.2 Finding the Center of a Data Set. Mean, Median, Mode Theory
1/21
There's no tags or description
Looks like no tags are added yet.
Name | Mastery | Learn | Test | Matching | Spaced | Call with Kai |
|---|
No analytics yet
Send a link to your students to track their progress
22 Terms
3 Ways to Describe the Center of Your Data Set
(1) Mean (Arithmetic Average)
(2) Median (Middle)
(3) Mode (Most)
What is the mean?
(1) arithmetic average
(2) what you know as taking the average
How to Find the Mean
(1) Arithmetic Average
(2) add all the values, divide by the number of values added
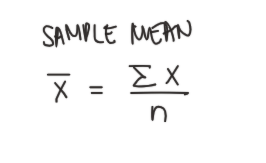
Sample Mean Formula
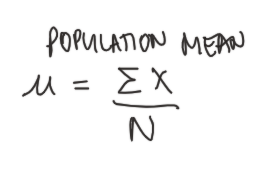
Population Mean Formula
What is the median?
(1) the middle
How to Find the Median
Step 1: Order values
Step 2: Find middle value
Odd Number of Data Values
choose the middle value
Even Number of Data Values
choose the middle 2 values, take the mean
What is the mode?
(1) what happens most in a data set
4 Outcomes of the Mode
(1) Single mode
(2) Bimodal
(3) Multimodal
(4) No mode
Rounding Rule of Thumb
(1) round the number to one decimal place more than what they gave you
Rounding Rule of Multiple-Step Formulas
(1) cannot round until the very last step when using multiple formulas
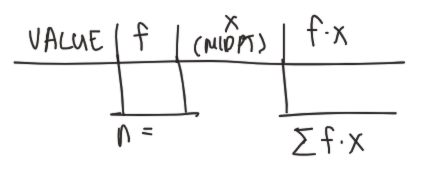
Steps to Finding the Mean of Frequency Distribution
Step 1: Class Midpoint
Create a new column, x, which will represent the class midpoint
Step 2: Frequency * Midpoint
Create a new column, f * x, which will represent the “mid-point” frequencies
Step 3: Take the average
(1) Add up mid-point frequencies
(2) Add up frequencies
(3) Take the average by dividing; mid-point frequencies divided by the frequencies
Formula for Mean of Frequency Distribution
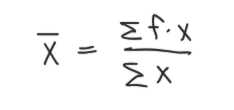
Table for Mean of Frequency Distribution
What is weighted distribution?
(1) essentially your GWA
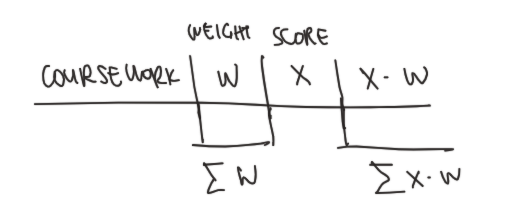
Steps to Finding the Mean of a Weighted Distribution
Step 1: Convert scores to points
Create new column, x, which will represent the points
Essentially convert to percentage or something out of 100
Step 2: Weight * Points
multiply the weighted grade by the points you got, just multiply across
Create a new column, x * w, which will represent weighted-points
Step 3: Take the mean
(1) Add up weighted points
(2) Add up weights (which would obviously eventually add up to 100%)
(3) Take the average
Formula for Mean of Weighted Distribution

Table for Mean of Weighted Distribution
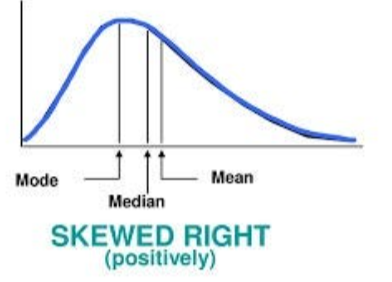
Shape for Skewed Right
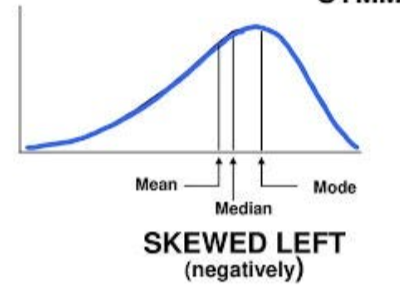
Shape for Skewed Left
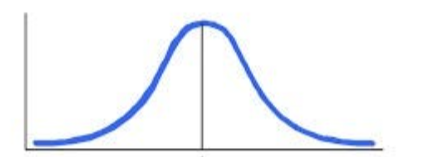
Normal Shape
The difference between mean and median.
(1) the median is not affected by outliers, while the mean is affected by outliers