Research Design and Data Analysis
1/31
Earn XP
Description and Tags
MCAT Prep: Physics and Math Part 7
Name | Mastery | Learn | Test | Matching | Spaced |
|---|
No study sessions yet.
32 Terms
Scientific method
determine whether sufficient background exists and whether the question is testable
FINER method
determine whether a study is feasible, interesting, novel, ethical, and relevant
Controls
experimental subjects that are maintained with similar but noninterventional treatments to establish causality
Hill’s criteria
help determine the strength of casual relationships. Only temporality is necessary
Small sample size
amplifies the effects of statistical anomalies
Defects in precision and accuracy
create random or systematic variations in the data
Bias
systematic data error. Common types include selection, detection, and the Hawthorne effect. Minimized by proper participant selection, blinding, and randomization
Confounding
an analysis error wherein a variable that has a relationship with the other two variables is overlooked
Beneficence
the requirement to do good
Nonmaleficence
“do no harm”
Autonomy
the right of individuals to make decisions for themselves
Justice
the need to consider only morally relevant differences between patients and to distribute healthcare resources fairly
Clinical significance; target population
Statistical significance and causality do not make something generalizable or a good intervention. _________ and _________ must also be considered
Mean
the average of the data points; impacted heavily by outliers
Median
the central value of a data set; not affected by outliers
Mode
the most common data point(s); not affected by outliers
Range
the difference between the largest and smallest value in a set; impacted heavily by outliers
Standard deviation
a measure of how spread out values are from the mean; affected by outliers
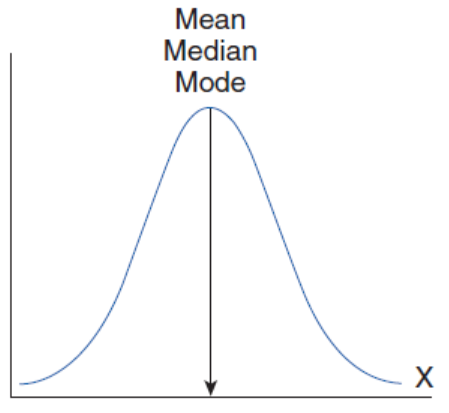
Normal

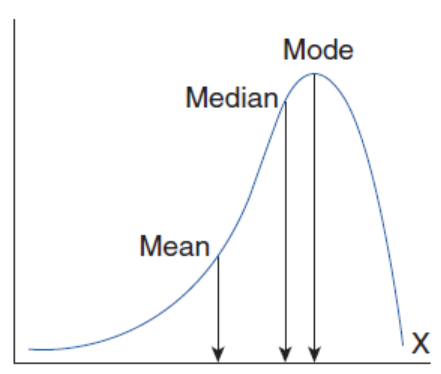
Negatively skewed

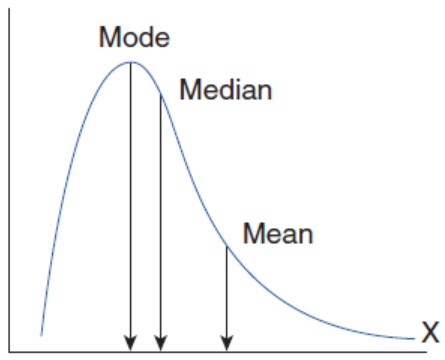
Positively skewed

Mutually exclusive
two events that cannot occur together
Independent
the probability of either event is not affected by the occurrence of the other
P(A and B)
P(A) x P(B)
P(A or B)
P(A) + P(B) - P(A and B)
Null hypothesis
a hypothesis of no difference; always the comparator
p-value
the probability that results were obtained by chance given that the null hypothesis is true
Confidence interval
a range of values believed to contain the true value with a given level of certainty
Graphs
analyze the axes first to determine whether the scale is linear, logarithmic, or semilog and what the units are. Determine whether relationships are direct or inverse
Pie charts
compare portions of data to a whole or relative responses of a group
Bar charts and histograms
compare absolute or relative responses between groups
Box plots
contain information about measures of central tendency and distributions; may be comparative or single