Biology ATP.
1/36
There's no tags or description
Looks like no tags are added yet.
Name | Mastery | Learn | Test | Matching | Spaced |
|---|
No study sessions yet.
37 Terms
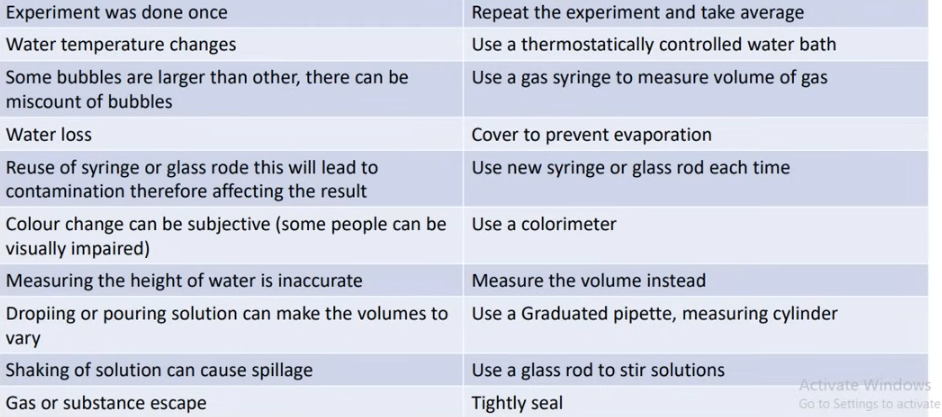
starch food test
Add drops iodine solution to the food sample
If the food sample contains starch, the iodine solution will go from orange-brown to blue-black
reducing sugar test
add benedict’s solution into a test tube containing the food sample
heat at 60-70C in a water bath
if reducing sugars r present, solution turns from blue to orange/brick-red/green
protein test
add few drops of biuret solution into food sample
biuret solution turns from light blue to lilac purple
lipid test
add 2cm^3 of ethanol to food sample in a test tube
shake well
pour the ethanol into an equal volume of cold distilled water
cloudy emulsion forms if lipids present
vitamin C test
add 1cm^3 of DCPIP sol to a test tube
add some food sample to a test tube
blue color of dye disappears if VC present.
enzyme practical: amylase
Add a drop of iodine solution to each well of a spotting tile.
Add 3cm^3 of amylase into a test-tube in a thermostatically controlled water bath to maintain a constant temperature.
Add 3cm^3 of starch solution into the same test-tube.
Heat to 30C.
After equilibrating the temperature, mix solution using a glass rod and immediately start a stopwatch.
Use the glass rod to transfer a drop of mixture to a well of iodine solution.
Repeat and continue adding a drop of mixture to a new well of iodine solution until it remains orange-brown/no longer turns blue-black.
Repeat the experiment at 40C and 50C.
Use a colorimeter, so it is easier to see colour change.
Three or more replicates/repeat investigation three or more times.
enzyme practical: pH amylase
Add a drop of iodine solution to each well of a spotting tile.
Add 3cm^3 of amylase into a test-tube in a thermostatically controlled water bath to maintain a constant temperature.
Add 3cm^3 of starch solution into the same test-tube.
Heat to 30C.
After equilibrating the temperature, mix solution using a glass rod and immediately start a stopwatch.
Use the glass rod to transfer a drop of mixture to a well of iodine solution.
Repeat and continue adding a drop of mixture to a new well of iodine solution until it remains orange-brown/no longer turns blue-black.
Use the glass rod to transfer a drop of mixture to a well of iodine solution.
Repeat and continue adding a drop of mixture to a new well of iodine solution until it remains orange-brown/no longer turns blue-black.
Repeat at two different pH values.
enzyme practical: activity
Add 3cm^3 of H2O2 to a test-tube.
Add fresh potato strips and shake gently.
Keep your thumb on top or use a stopper to retain gas.
Do the glowing splint test-tube. Oxygen relights the glowing splint.
Repeat the experiment using the catalyst manganese IV oxide. You'll observe bubbles of oxygen form.
Conclusion: Reaction occurs due to a catalyst.
----------------------------------------------------------
Repeat experiment using boiled potato strips.
Perform glowing splint test.
Nothing happens. Conclusion: Enzymes denature when they are at high temperatures.
Repeat experiment with water instead of H2O2.
Do the glowing splint test. Nothing happens.
Conclusion: H2O2 is the substrate.
----------------------------------------------------------
Repeat experiment in a cold room.
Effervescence is slower.
Conclusion: Enzymes work slowly in cold temperatures.
control variables for enzyme experiment
pH (for temperature experiment)
temperature (for pH experiment)
concentration of amylase
concentration of substrate, starch
light intensity affecting photosynthesis practical
Collect a piece of aquatic plant. Cut off a piece about 7 to 9 cm long under the water.
Fill a beaker with tap water, place the aquatic plant in the beaker upside down, i.e., the cut side should be upwards.
Place a lamp 10 cm from the beaker. Place a transparent heat shield or a beaker full of water between the lamp and beaker.
Turn on the lamp. Wait for five minutes, so that the plant adapts to the changed environment.
Start the stopwatch or timer and count the number of bubbles released from the cut end of the stem in one minute. Record this, and then repeat two more times.
Move the lamp 10cm further from its initial position. Measure the new distance and repeat the investigation at 20cm, 30cm, and 40cm.
Safety: Do not handle the lamp with wet hands. Cut the plant under the water.
Controls: Age of plant. Size of plant. Same time for counting bubbles. Species of plant.
CO2 affecting photosynthesis practical
Collect a piece of pondweed Cut off a piece about 7 to 9 cm long under the water.
Fill a beaker with distilled water. Add 3g of sodium hydrogen-carbonate to the water and stir. Place the pondweed in the beaker upside down the cut side should be upwards.
Place lamp 10 cm from the beaker. Place a transparent heat shield between the lamp and beaker. Turn on the lamp. Wait for some time so that the plant adapt to the changed environment.
Start the stopwatch or timer and count the number of bubbles released from the cut end of the stem in one minute. Record this, and then repeat two more times.
Repeat the investigation with different mass of sodium hydrogen-carbonate in water. (6g and 9g)
CV:
Species of plant
Age of plant
Size of plant
Same time for counting the number of bubbles.
Same light intensity.
Investigating the effect of light and darkness on gas
exchange in an aquatic plant
Hydrogen-carbonate indicator is initially red.
Set up three test-tubes
Add an equal volume of H-C indicator to each test-tube.
In the first test-tube, add 10cm of pondweed. Cover the test tube in black paper to block light.
In the second test-tube, add 10cm of pondweed and H-C indicator.
In the third test-tube, add only H-C indicator. This is a control set-up a test tube with hydrogen carbonate indicator solution only.
Leave the test tubes near a light for 2-3 hours.
1st test-tuber will turn yellow. This is because carbon dioxide was produced by pondweed by respiration. No photosynthesis occurred, for light was blocked.
The second test tube turns purple. This is because carbon dioxide was taken in photosynthesis. Rate of photosynthesis = rate of respiration.
The third test-tube remains red.
Control variables: Volume of hydrogen-carbonate indicator, size of pondweed, temperature, duration of exposure to light.
Investigating the effect of temperature on pathway of
water through the above-ground parts of a plant
Add known volume of water in a beaker. Add known volume of dye in the beaker and stir. Place the beaker in thermostatically controlled water bath at set temperature.
Equilibrate the temperature then place a celery stalk in the container for at least 2 hours.
Remove the stalk.
From the bottom part of the stalk start cutting 5mm sections of the stalk using a small knife and ruler.
Keep cutting until you stop seeing the colour of dye in the xylem of the cut section.
Count the number of sections that show the coloured dye in stalk. Multiply the number of sections by 5 to get the approximate distance travelled by the dye. Repeat using different temperatures.
CV:
Same type of celery stalk
Same diameter of stalk
Same volume of water and same volume of dye to maintain same concentration of dye.
factors affecting photosynthesis practical
Purpose of a water beaker: Maintain constant temperature. Temperature is a controlled variable. Prevent temperature influencing the results.
Light meter - Measure light intensity
Sodium Hydrogen Carbonate - So CO2 is not the limiting factor and provide carbon dioxide.
Syringe - Reposition air bubble, and return air bubble to top of tubing.
Counting bubbles may not be the best way to measure the rate of photosynthesis. The volume of the bubbles is not always exactly the same. Suggest and explain one alternative way of measuring the gas given off to solve this problem.
measure volume (of oxygen/ gas)
using a measuring cylinder
filled with water
during the photosynthesis experiment, explain what caused the meniscus to move down the capillary tubing
Oxygen gas was produced from the plant during photosynthesis. Oxygen gas was given off. This creates pressure to force the water down the tube.
test leaf for starch
Boil some water in a beaker to break down cell membranes. Place the leaf in it for 30 seconds.
Turn out the flame.
Pour some alcohol into a boiling tube, and then stand the tube containing alcohol in hot water.
Use the forceps to remove the softened leaf from the hot water. Drop it into the tube of alcohol.
Boil the leaf in the alcohol to remove chlorophyll. Leave the leaf in the alcohol until all the chlorophyll has come out of the leaf.
The leaf will now be brittle (it will break easily). Carefully remove it from the alcohol.
Dip it into hot water again to soften it and cell walls
Spread out the leaf on a white tile and cover it with iodine solution.
A blue-black colour shows that the leaf contains starch.
safety:
Wear gloves and lab coat
Alcohol is flammable so do not heat it in Bunsen burner.
Handle hot test tubes with tongs
use forceps to handle the fragile leaves.
chlorophyll test
Use a variegated leaf, one that has some white areas (with no chlorophyll) and some green areas (with chlorophyll)
Perform a starch test on this leaf. Cover the leaf in iodine solution.
You will observe that only the area that is green the iodine will turn blue-black.
The white area will remain orange-brown.
This proves that chlorophyll is necessary for photosynthesis, as no starch is produced in the region where there is no chlorophyll.
Safety/ Precautions
Same safety/ precautions as for test for starch
CO2 needed for leaf experiment
Destarch two plants by placing in the dark for two days.
Place one plant in a bell jar which contains a beaker of sodium hydroxide (which will absorb carbon dioxide from the surrounding air)
Place the other plant in a bell jar which contains a beaker of water (control experiment), which will not absorb carbon dioxide from the surrounding air
Place both plants in bright light for several hours.
Test both plants for starch using iodine
The leaf from the plant placed near sodium hydroxide will remain orange-brown as it could not photosynthesise due to lack of carbon dioxide
The leaf from the plant placed near water should turn blue-black as it had all necessary requirements for photosynthesis
safety:
Wear gloves while handling sodium hydroxide.
Wear safety goggle.
(Questions may talk about sodium bicarbonate/soda lime. Sodium bicarbonate releases CO2)
necessity for light
Before starting the experiment the plant needs to be destarched by placing in a dark cupboard for 24 hours.
This is to be sure starch is produced in the experiment, and any starch already present in the leaves will be used up and will not affect the results of the experiment.
Cover and attach black paper to a leaf of the plant. Partially cover the leaf. This is to block sunlight.
Leave the plant in bright light for one day or 24 hours.
The leaf can then be removed from the plant. Remove the black paper from the leaf, and tested for starch using iodine.
The area of the leaf that was covered with black paper will remain orange-brown as it did not receive any sunlight and could not photosynthesise, while the area exposed to sunlight will turn blue-black.
This proves that light is necessary for photosynthesis and the production of starch.
transpiration
1.) Fill a potometer with water.
2.) Cut a plant shoot with knife and attach it to the potometer. to prevent air bubbles entering xylem.
3.) Do steps 1-2 under the water.
4.) Remove the potometer from water and ensure there are no air bubbles.
5.) Attach a scale to the potometer so that you can measure the distance moved by the water.
6.) Keep an electric fan 20cm away from the potometer. Turn it on. OR Keep it in incubator at known temperature with a light source at known distance to maintain hot temperature. OR spray water in a plastic bag and wrap around the plant. OR set up a lamp 30cm away from the potometer.
7.) Leave the apparatus in a light.
8.) As the plant transpires, the water it loses is replaced by water taken up through the cut end of the stem. Air will be drawn in at the end of the capillary tube.
9.) Start the stopwatch. Measure the distance moved by the air meniscus in 2 hours.
10.) Repeat using different intensity of fan speed, light intensity, humidity or temperature.
Control variables for transpiration
Species of plant
Age of plant
Size of plant
Room temperature
Room humidity
Distance between lamp and potometer
Wind speed
osmosis experiment
Label for test tubes. A, B, C and D.
Fill one test tube with distilled water. Fill the other three with 0.4 mol, 0.6 mol, and 1.0 mol dm^3 of sugar solution.
Peel a potato. Cut four potato cylinders to exactly 40mm in length using a cork borer or knife. Safety precaution: Cut away from the body.
Measure the initial mass of the potato cylinders using a balance.
Place the potato cylinders in test tubes.
Heat the test-tubes in a thermostatically controlled water-bath at 30C this to maintain a constant temperature.
Leave them for 20-30 minutes.
Remove them from the test tubes.
Dry them using filter papers before reweighting.
Reweigh them using a balance.
CV: Initial length of potato cylinder
Same type of potato
Same temperature
Same soaking time
description of osmosis experiment
If the plant tissue gains mass - Water potential outside cylinder was lower. The cylinder was more concentrated.
Lose mass - The solution surrounding the tissue is more concentrated than the plant tissue (which is more dilute)
Same mass - There has been no net movement of water as the concentration in both the plant tissue and the solution surrounding it must be equal
visking tubing
Experiment:
Add a known volume of 1.0 mol per dm³ sugar solution to visking tubing using a dropper/pipette (V1)
Tightly tie threads at the two ends.
Submerge tubing in a beaker containing the other solution. (water)
Start the timer. Wait for 5 minutes.
Remove the dialysis tubing. Empty its content into a measuring cylinder and measure the volume of liquid in it as V2.
Calculate the change in volume = V2 - V1.
Repeat the experiment using a different concentration of sugar solution in the dialysis tubing. (0.6 and 0.4)]
Precautions:
Rinse the outside of dialysis tubing after filling it with sugar solution
Use a new clean dropper pipette to fill dialysis tubing with sugar solution
Control variables: Volume of sugar solution in DT, volume of water in beaker, temperature, soaking time, surface area of dialysis tubing,
heart rate practical
You’ll need one partner for the experiment.
Measure the initial pulse rate of your partner. By listening to sounds of valves closing.
Ask them to run 100m And them measure their heart rate.
Let them relax completely and let their heart rate return to normal.
Repeat for different distances to increase or decrease physical activity intensity.
CV:
Running speed
Gender
Age
Fitness
composition of air experiment
Breathing in:
Air drawn through boiling tube A.
Breathing out:
Air blown into boiling tube B.
Lime water reaction:
Lime water is clear initially.
Becomes cloudy (milky) when carbon dioxide is bubbled through it. Lime water in boiling tube A remains clear.
Lime water in boiling tube B becomes cloudy
Conclusion: Percentage of carbon dioxide is higher in exhaled air compared to inhaled air.
rate of physical activity on breathing practical
Counts the number of breaths in 15s, and multiply by four. Repeat 5 more times, and the find the average breathing rate.
Measure their chest expansion during each breath using measuring tape. Calculate average chest expansion over 5 breaths.
Tell your partner to exercise 5 minutes.
Immediately after exercise, count the number of breaths in 15s, and multiply by four.
Measure the average chest expansion over 5 breaths.
Compare results.
Tell them to rest, so their chest expansion and breathing rate returns to normal or resting rate.
Repeat.
temp effect on respiration
Add a pH buffer solution to the test tube.
Add yeast suspension and glucose solution to the test tube.
Place the yeast test tube in a thermostatically controlled water bath at 30°C.
Add a small drop of methylene blue to the test tube and start a timer. Shake for 10 seconds.
Record how long it takes for the methylene blue to go from blue to colorless.
Repeat the experiment at different temperatures.
Find the rate of respiration at each temperature.
CV:
amount of yeast suspension in TT
amount of methylene blue dye added
concentration of glucose
pH
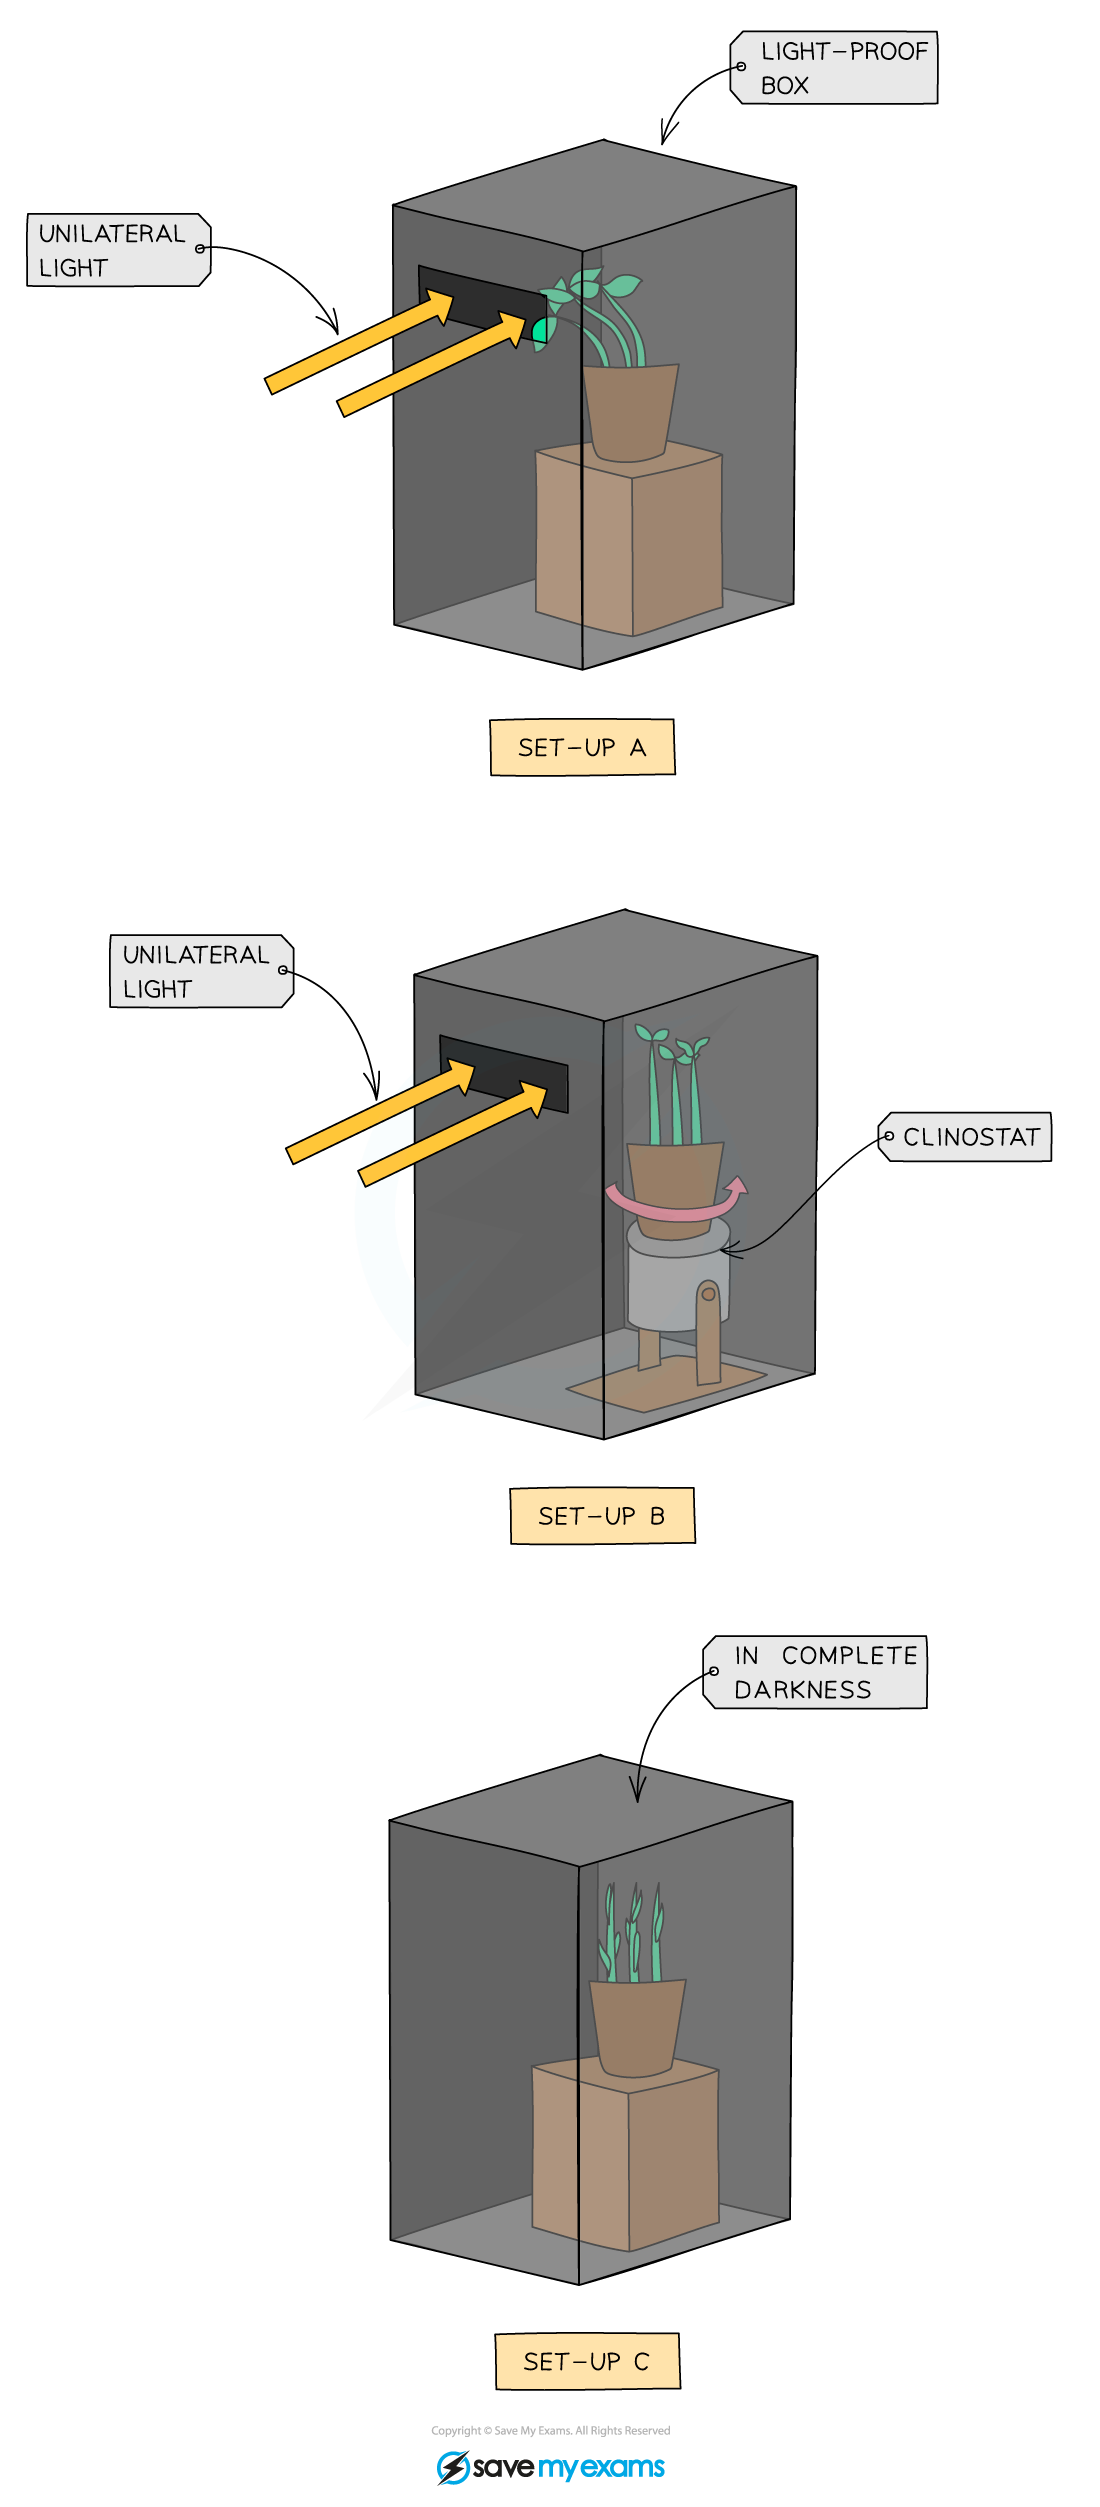
phototropism practical
Set up three plants.
Plant A is placed in a light-proof box, with light coming from one side only.
Plant B is placed on a clinostat, which rotates, with light coming from one side only. This allows the plant to get an equal amount of light on both sides.
Plant C is placed in a light-proof box with no light.
--------------------------------------------------------
The seedlings in A grow towards the light source.
The seedlings in B, all sides equally. They grow straight up. This is because each side gets an equal amount of light, due to the rotation of the clinostat.
In C the seedlings grow straight up looking for light and the plant becomes tall and slender with yellowing leaves due to the lack of light
gravitropism
Add some damp cotton wool to two petri dishes
Place 3 bean seedlings in the cotton wool in each petri dish
A - radicle facing downwards
B - horizontally
C - radicle (root grows from here) facing upwards
Cover each dish with a lid
Attach one petri dish to a support so that it’s on its side
Attach the second petri dish to a clinostat
Place both in a light-proof box ), leave for two days and then observe growth of the seedlings
Observe growth of seedlings for 5 days.
Repeat.
In the first petri dish all radicles (roots) have grown downwards (positive gravitropic response) regardless of which way they were initially facing (horizontal, up or down) and all plumules (shoots) have grown upwards (negative gravitropic response)
In the second petri dish, all radicles and all plumules have all grown neither up nor down but straight outwards in whichever direction they were placed as the effect of gravity has been cancelled out by the revolving of the clinostat - they have shown no gravitropic response at all
The experiment needs to be done in a lightproof box in order to cancel out the effect of light on the growth of the seedlings
tropism practical
Get three seedlings. A,B, and C.
Remove the tips of the shoot for seedling A.
Block any light for seedling B, by placing it in a dark place/light-proof box.
For seedling C, paint auxin on one side of shoot, so more light reaches one side than the other.
Leave for 2-3 days.
Repeat at least two more times.
-------------
In seedling A, the stem did not grow taller. This proves that the tip of shoot is the area where stimulus is detected. This also proves that auxin is produced in the shoot tip, and is needed to stimulate cell elongation and therefore growth.
The stem in seedling B grew longer and equally on both sides. This proves that phototropism is caused by the effect of light on auxin.
The cells on the darker/shaded side of the stem grew taller and faster than the cells in the light side of the stem in seedling C. This proves that the shoot tip and light is needed for a phototropic response. This also proves that the stem grows towards the light due to the unequal distribution of auxin in the shoot tip.
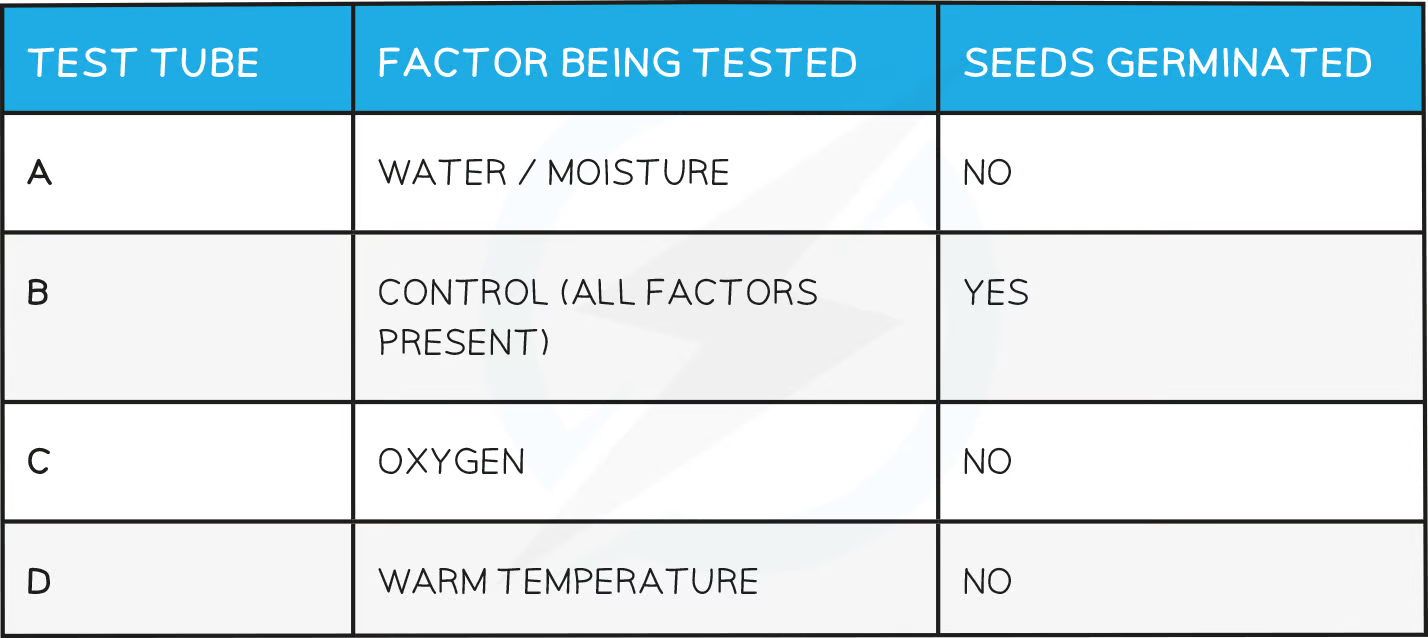
germination practical
Set up 4 test tubes, with each containing 10 cress seeds on cotton wool
Label the test tubes A, B, C and D
For test tube A, leave the cotton wool dry
For test tube B, add enough water to the cotton wool so that it becomes moist
For test tube C, add enough water to cover the cotton wool and seeds, then carefully add a layer of oil on top of the water
For test tube D, add enough water to the cotton wool so that it becomes moist
Leave tubes A, B and C at room temperature or incubated at a specific temperature (e.g. 20°C)
Place tube D in a fridge (approximately 4°C)
Leave all tubes for a set period of time (e.g. 3 - 5 days)
Ensure the cotton wool in tubes B and D remains moist throughout this time by adding more drops of water if required
Compare the results and see which tube has the greatest number of germinated seeds
control variables: Same number of seeds in each test-tube.
Same mass of cotton wool in each test-tube.
Same species of seeds.
Same age of cress seeds.
Same duration of experiment.
Effect of surface area on diffusion
Use agar cubes that contain universal indicator.
Cut two cubes of agar jelly, with sides of 1 cm.
Cut one of the cubes into four smaller cubes, each with sides of 0.5 cm.
Put the large cube into a test-tube. Put the four small cubes into the other test-tube.
Add equal volumes of dilute hydrochloric acid to each tube, making sure that all of
the cubes are covered with acid.
Start the stopwatch. Time how many seconds it takes for the cubes in each test-
tube to become fully red.
Safety
Take care with the acid. Wear safety glasses in case of splashes.
Take care with the sharp blade. Cut with the blade facing away from you. Place the
jelly on a firm surface before you start to cut it.
Constant variable
Concentration of acid
Temperature
Type of agar
Effect of temperature on diffusion
Use agar cubes that contain universal indicator.
Use at least 2 different temperatures.
Cut two cubes of agar jelly, with sides of 1 cm.
Add some hydrochloric acid in a test tube.
Heat the test tube in water bath at a specific temperature.
After equilibrating the temperature add one of the cube in it.
Start the stopwatch. Time how many seconds it takes for the cubes in each test tube to become fully red.
Repeat for other temperatures.
Safety/ Precaution
Take care with the acid. Wear safety glasses in case of splashes.
Take care with the sharp blade. Cut with the blade facing away from you. Place the
jelly on a firm surface before you start to cut it.
Use tongs to handle hot test tubes.
Constant variable
Surface area of cubes
Concentration of acid
Type of agar
effect of concentration gradient on diffusion
Use hydrochloric acids of at least 3 different concentrations.
(0.1 mol/dm³ HCl, 0.5 mol/dm³ HCl, 1.0 mol/dm³ HCl)
Use agar cubes that contain universal indicator.
Cut three cubes of agar jelly, with sides of 1 cm.
Add some hydrochloric acid of known concentration in a test tube.
Heat the test tube in water bath at known temperature.
After equilibrating the temperature add one of the cube in it.
Start the stopwatch. Time how many seconds it takes for the cubes in each test tube to become fully red.
Repeat for other concentrations of hydrochloric acid.
CV: Surface area of cubes
Temperature of Acid
Type of agar
common errors