IB Economics - 3.1
1/18
There's no tags or description
Looks like no tags are added yet.
Name | Mastery | Learn | Test | Matching | Spaced | Call with Kai |
|---|
No analytics yet
Send a link to your students to track their progress
19 Terms
National income
Measures economic activity within a country and provides insights into how it's performing
GDP
The total market value of all final goods and services produced annually in an economy
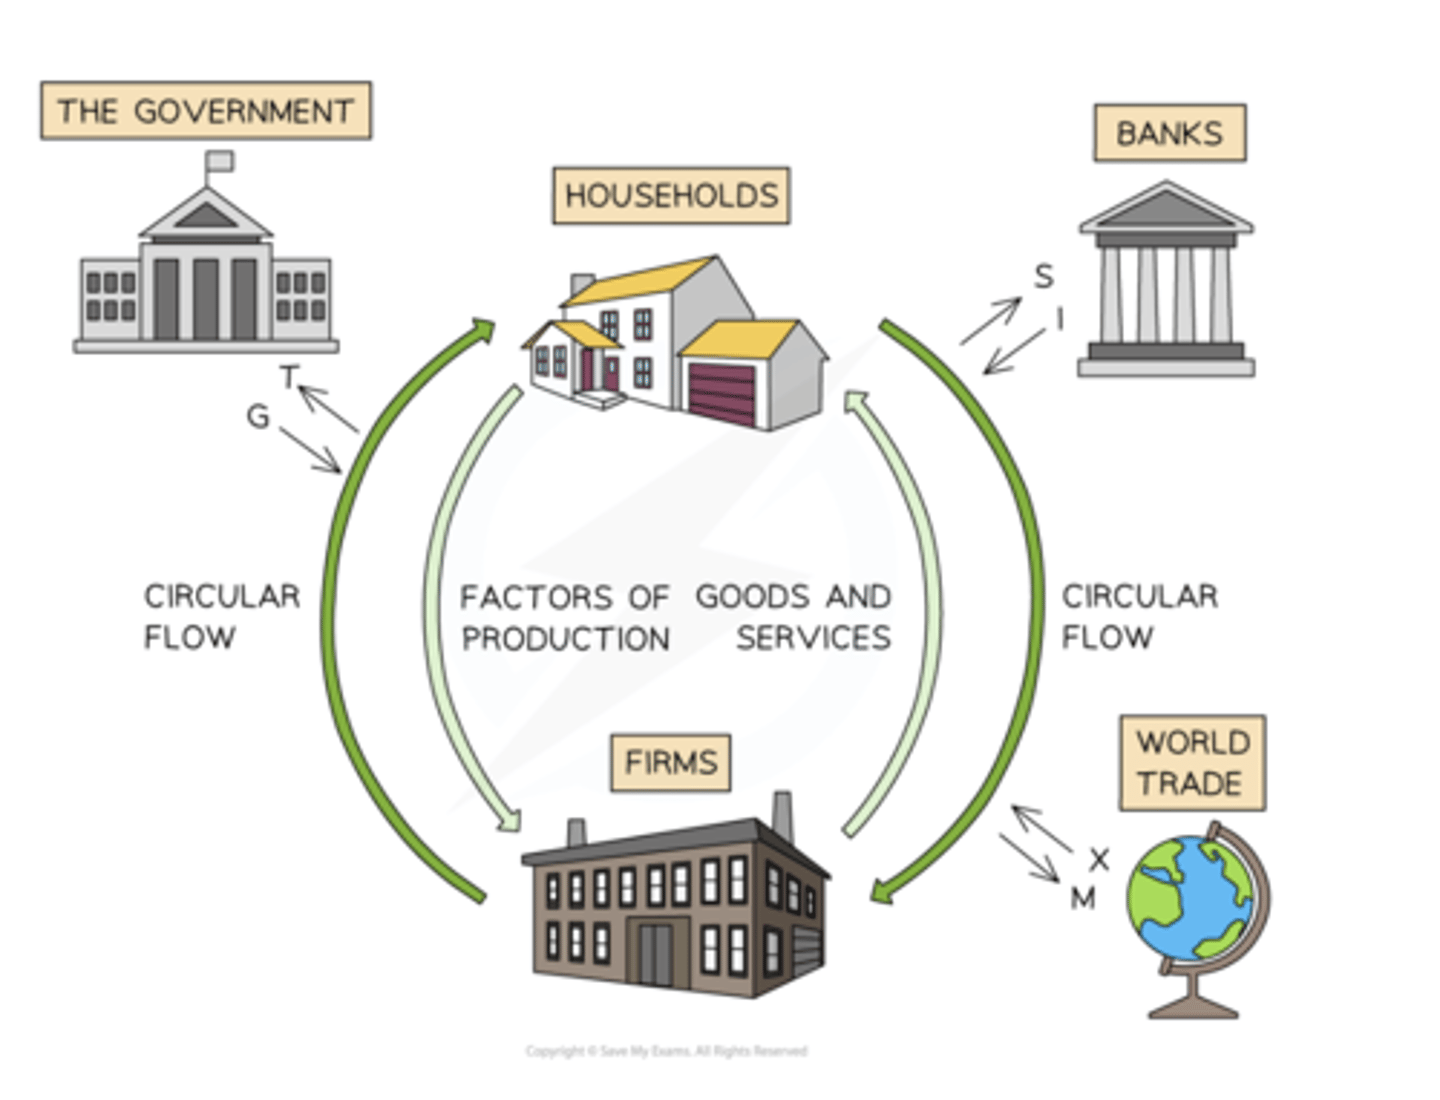
Circular flow of income
Injections > withdrawals = Economic Growth
Withdrawals > Injections = Economic decline

Injections in circular flow of income
Government Spending
Investment
Export
Leakages in circular flow of income
Saving
Taxation
Import Purchases
Approaches to calculating national income
Expenditure Approach: C + I + G + (X-M)
Income Approach (FoP rewards): W + R + I + P
Output Approach: The value of all finished goods/services within the economy each year
GNI (Gross National Income)
Nominal GDP + Net income earned from abroad
Used to calculate income earned by multi-national corporations and remittances.
Real GDP and GNI
Adjusted for inflation
Real GDP = (Nominal GDP / GDP Deflator) x 100
Real GNI = Real GDP + Net income from abroad
Real GDP/GNI per capita
Real GDP per capita = Real GDP / Population
Real GNI Per capita = Real GNI / Population
Purchasing Power Parity
Calculates the purchasing power of different currencies to make more accurate standard of living comparisons between countries where goods and services cost different amounts.
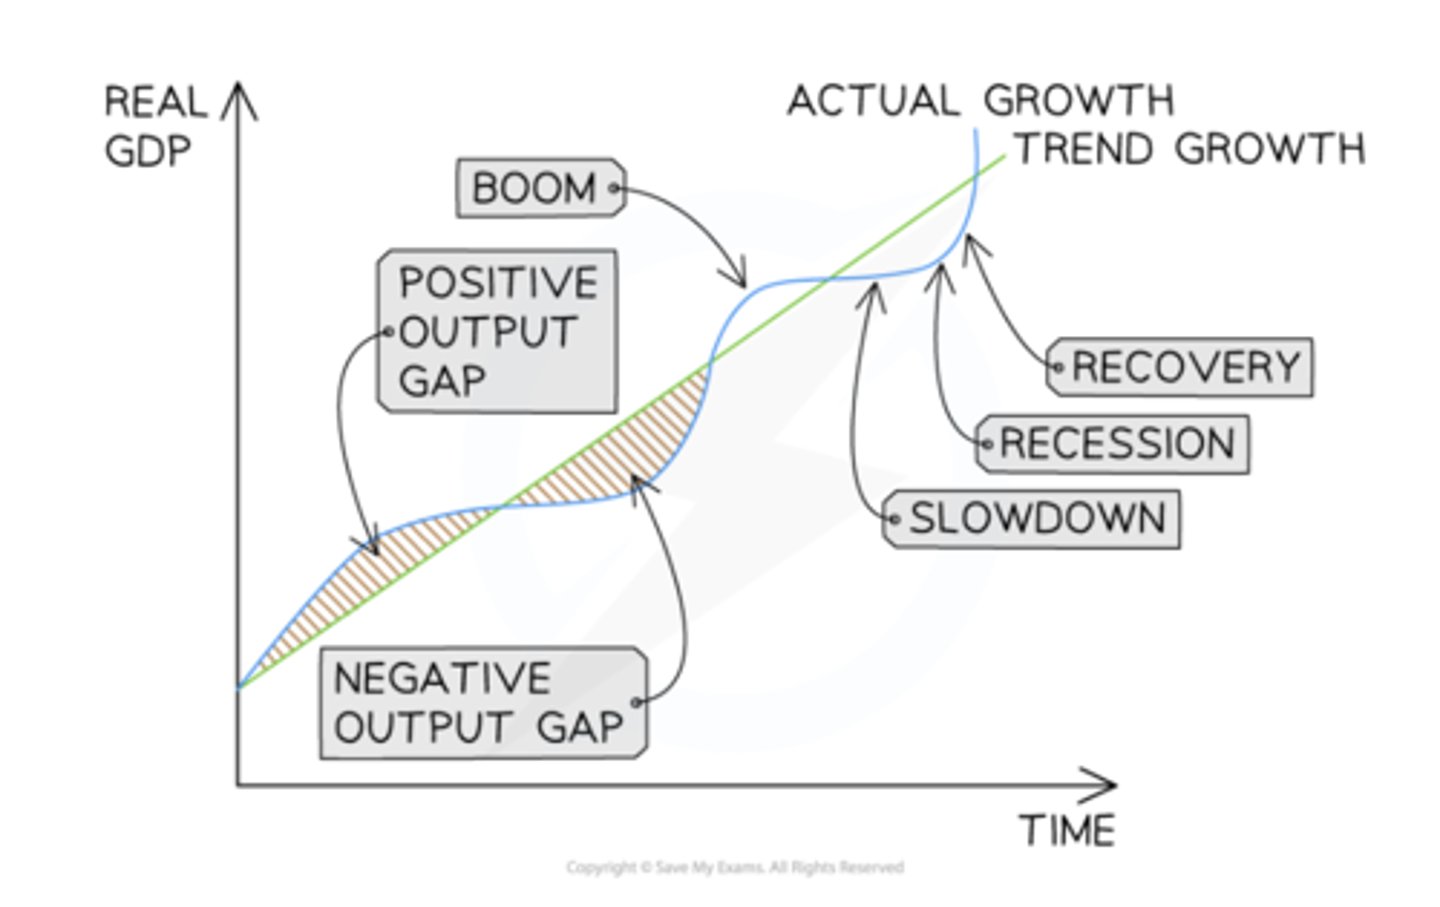
Business Cycle
Shows changes in real GDP over time
Positive output gap = growth in real GDP above the trend
Negative output gap = in real GDP below the trend

Boom
High economic growth
Decreasing unemployment
Creation of positive output gap
High confidence
Demand-pull inflation
Improvement in govt. budget
Recession
Two or more consecutive quarters of negative economic growth
Increasing unemployment
Increasing negative output gap and spare production capacity
Low confidence
Low inflation
Increase in govt. expenditure
Using national income statistics to measure well-being
Useful for making comparisons:
- In effectiveness of policies
- In standards of living
- over different time periods
Limitations of GDP date for making comparisons
Do not include non-marketed output
Do not include output sold in underground markets
Lack of information about quality of goods/services
Environmental factors like negative externalities and depletion of natural resources are ignored
No distinctions about the composition of output
Do not take into account quality of life factors and education/healthcare/life expectancy
Lack of information about inequality and distribution of income
Alternative measures of well-being
OECD better life index
Happiness index
Happy Planet index
OECD Better Life Index variables
Housing, income, jobs, community, education, environment, civic engagement (voter turnout, community involvement in legislation), health, life satisfaction, safety, work-life balance
Happy planet index variables
(Wellbeing x Life Expectancy) / Ecological Footprint
Happiness Index variables
Psychological well-being
Health
Time Balance
Community
Social Support
Education, arts, culture
Environment
Governance, Material Well-being (financial security), work.