econ inflation graphs + ex
1/14
There's no tags or description
Looks like no tags are added yet.
Name | Mastery | Learn | Test | Matching | Spaced |
|---|
No study sessions yet.
15 Terms
neoclassical
rule of 10
keynesian
rule of 9
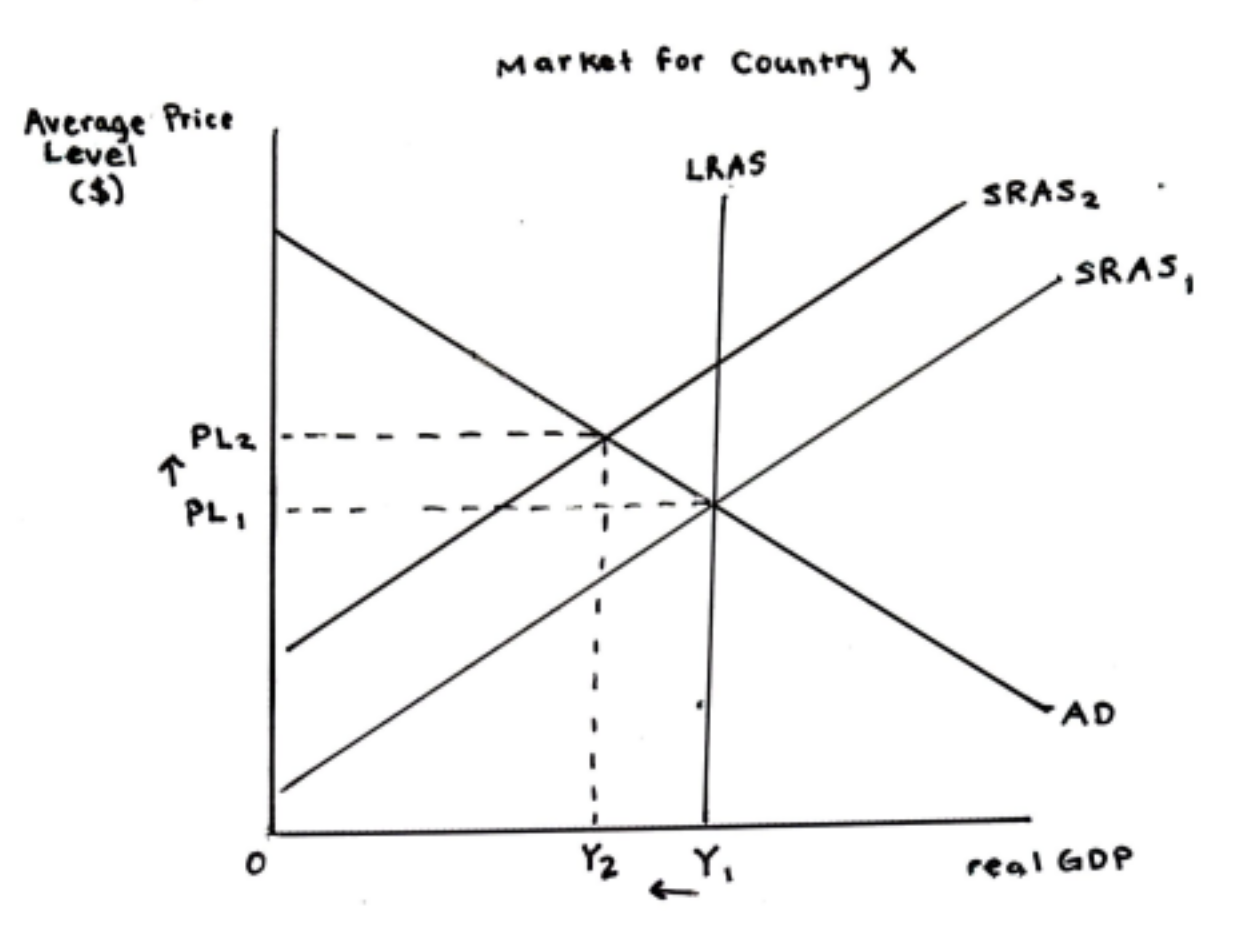
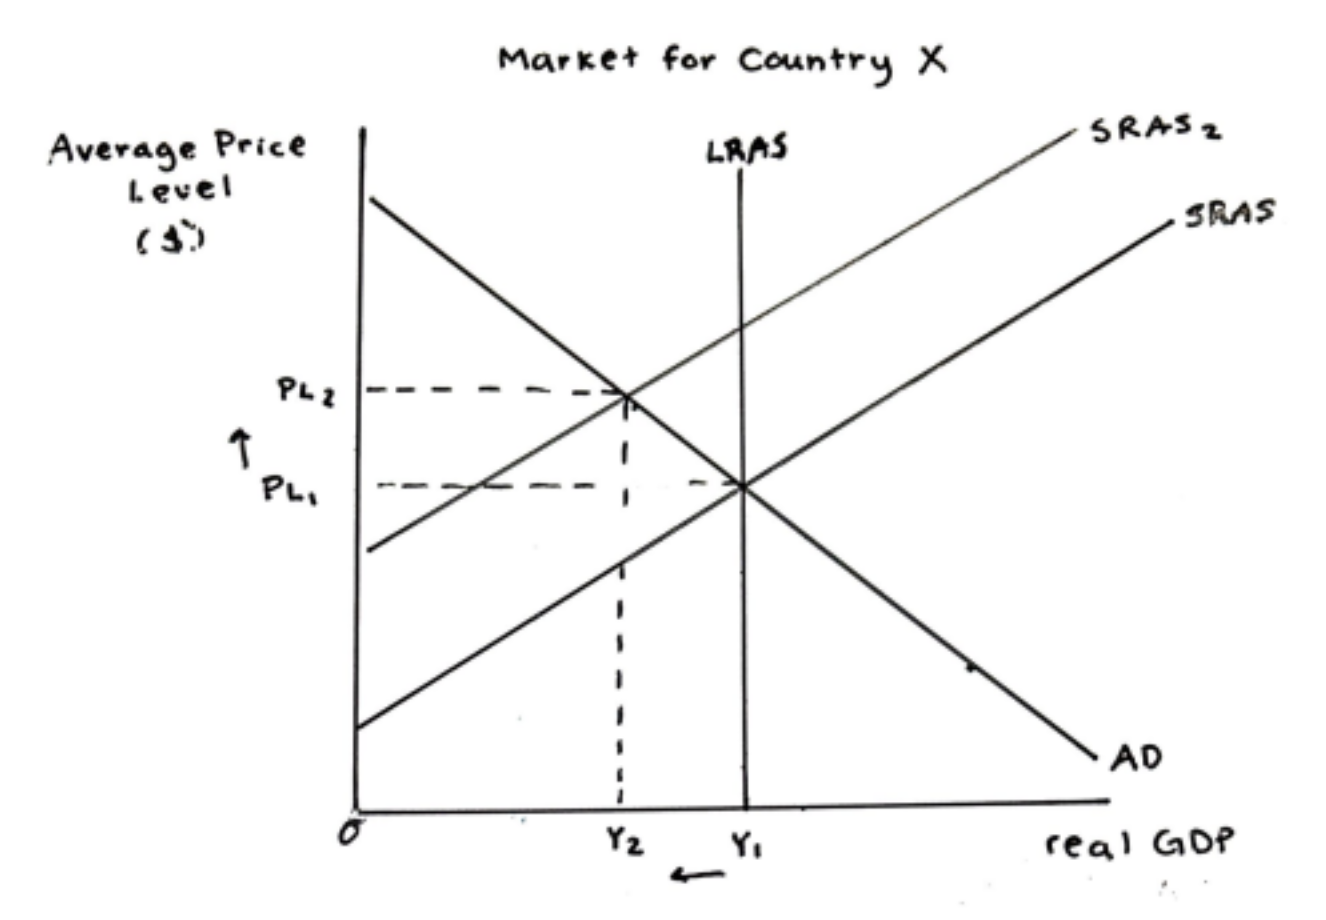
cost push inflation
SRAS shift left. Ex: US energy and input price surge (2021-22)
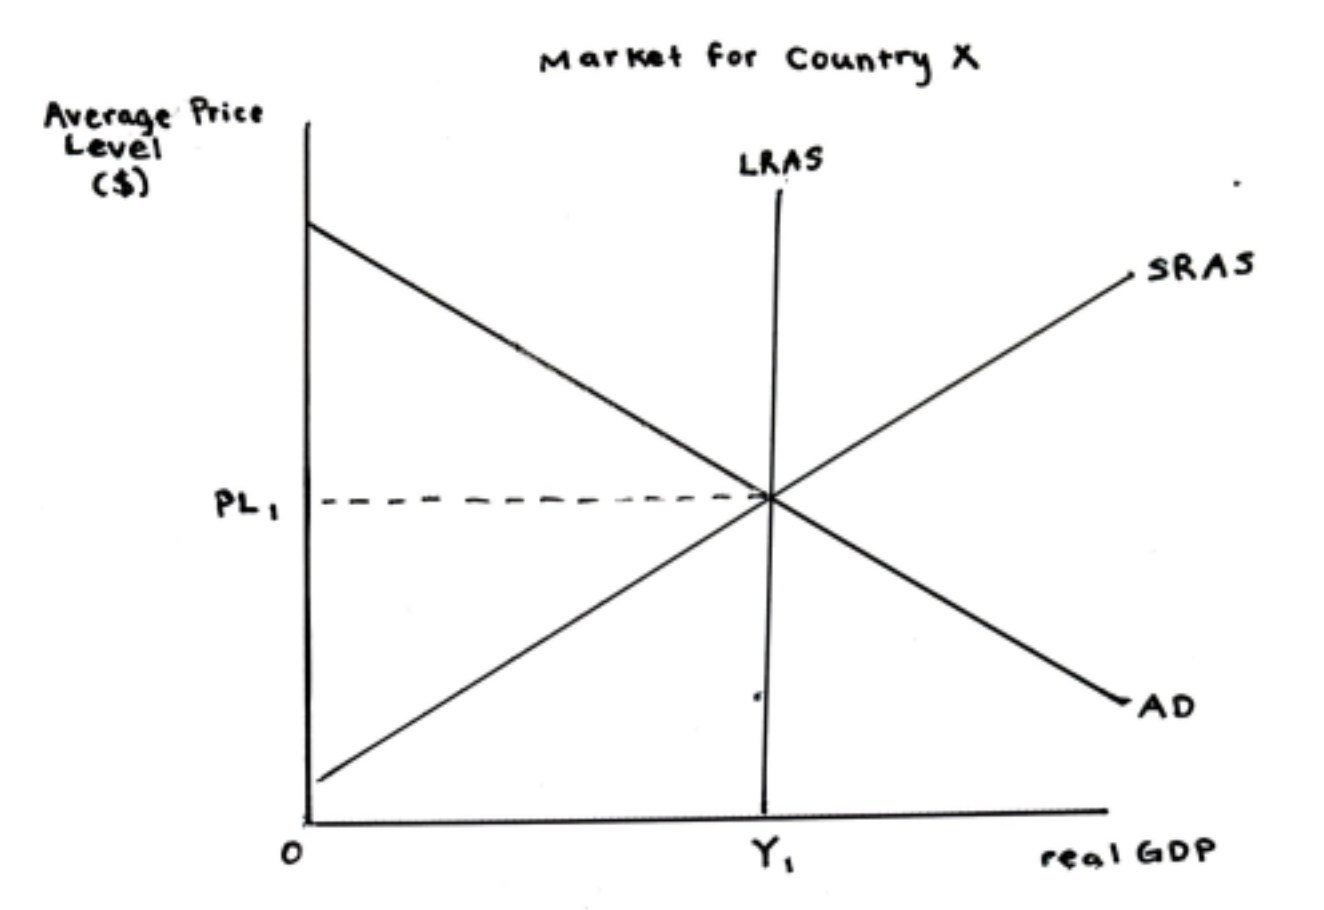
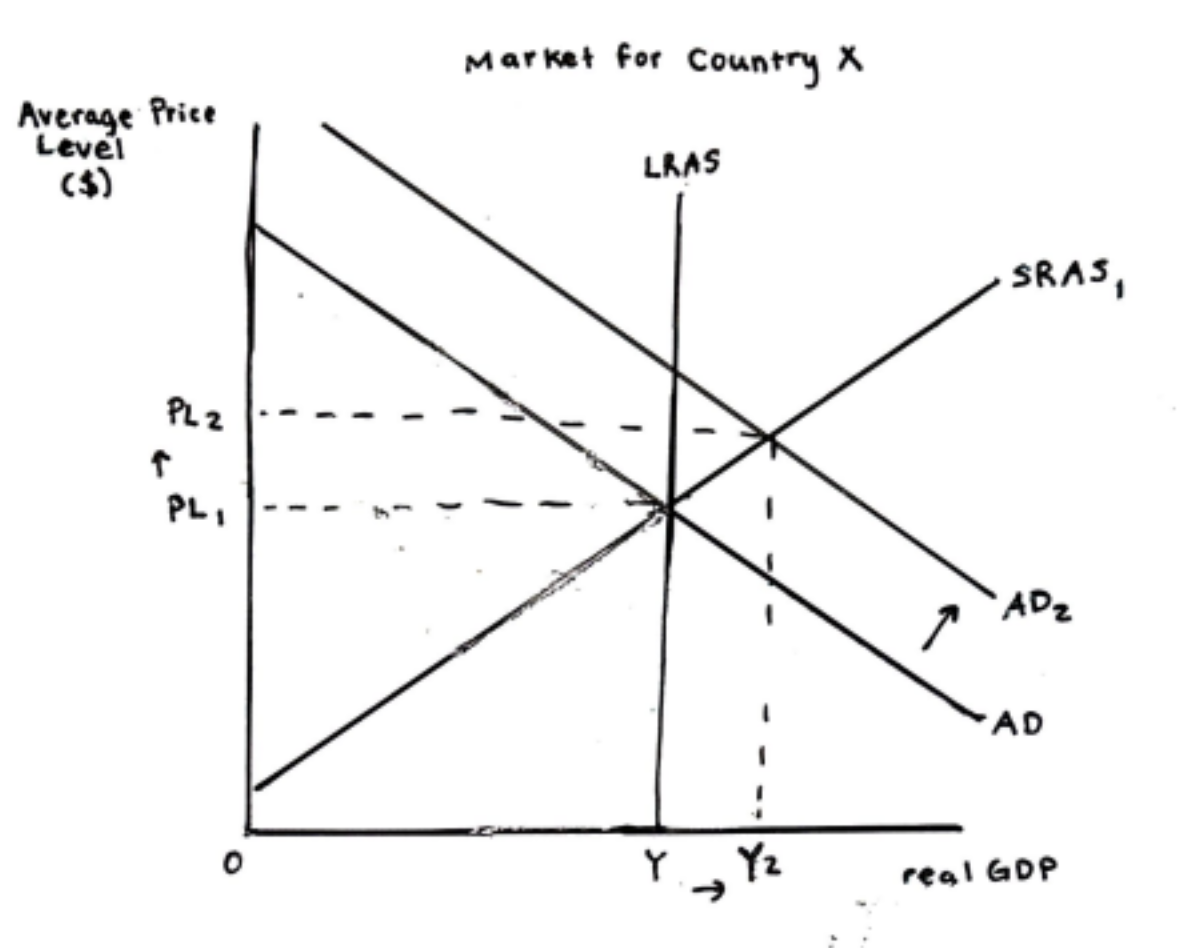
demand pull inflation
AD shift out. Ex: US post-pandemic recovery spending (2021)
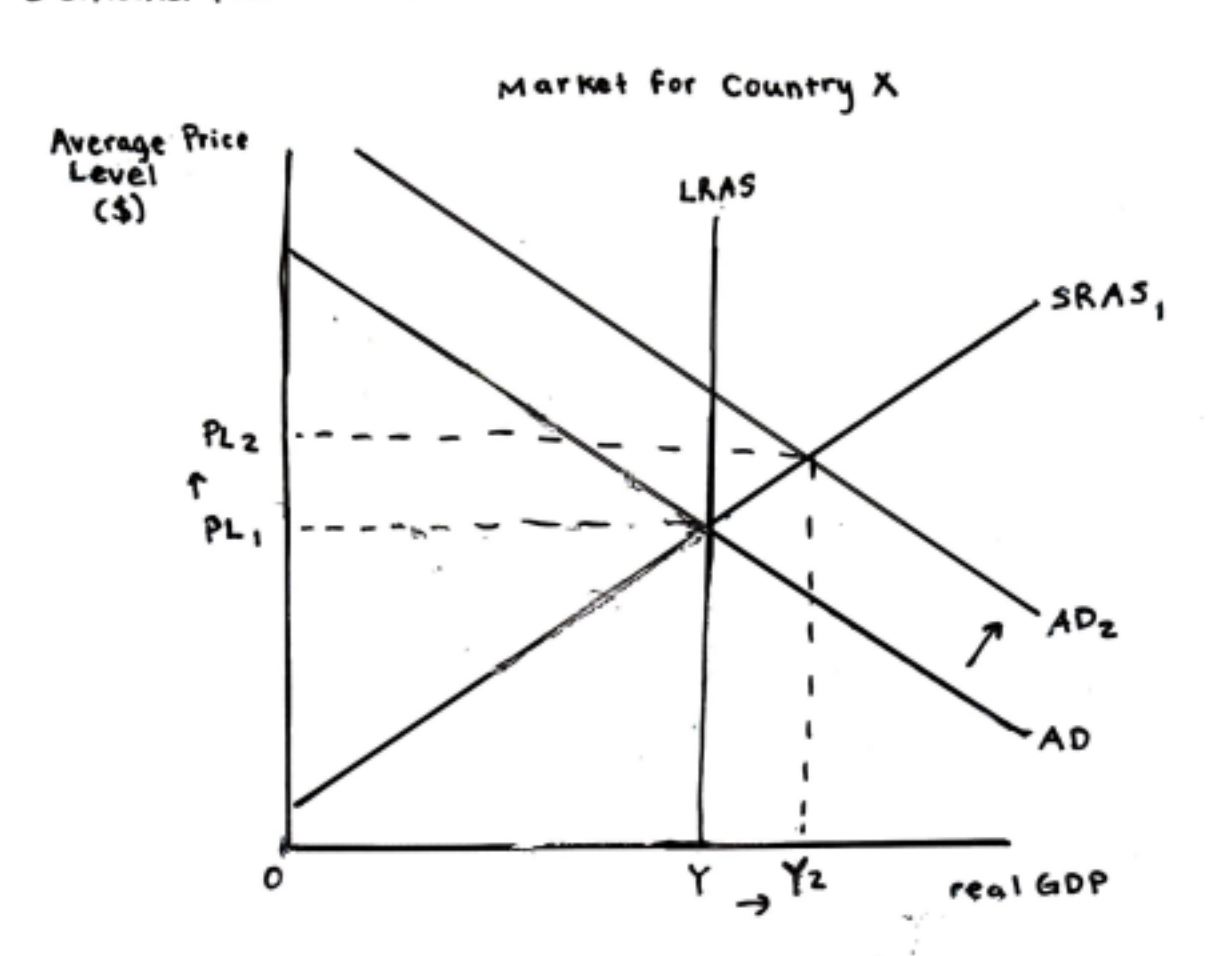
short term economic growth
AD shift out. Ex: US recovery after great recession (2010-11)
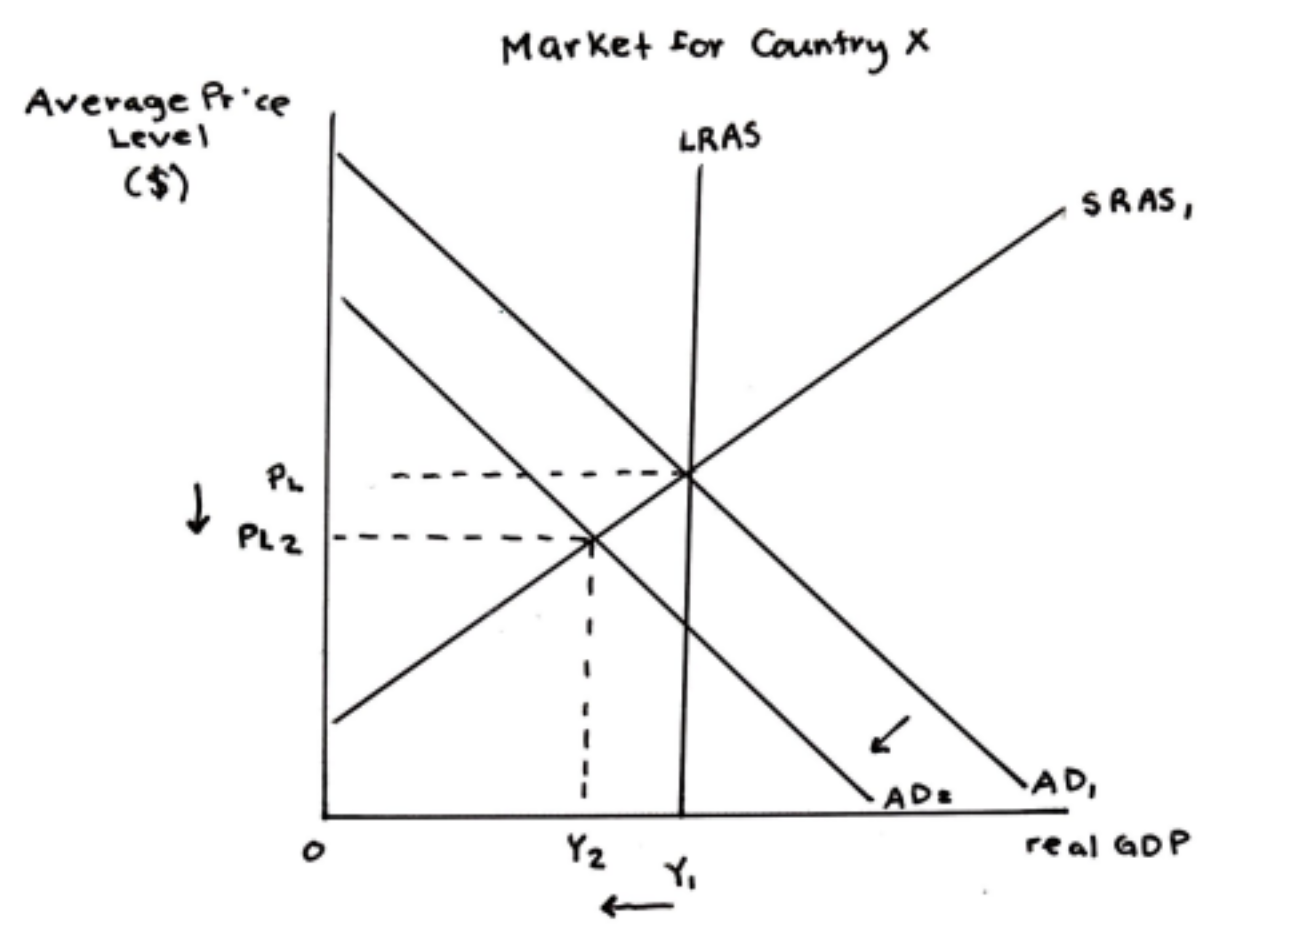
cyclical/demand-deficient unemployment
AD shift in. Ex: US unemployment during 2008-2009 great recession
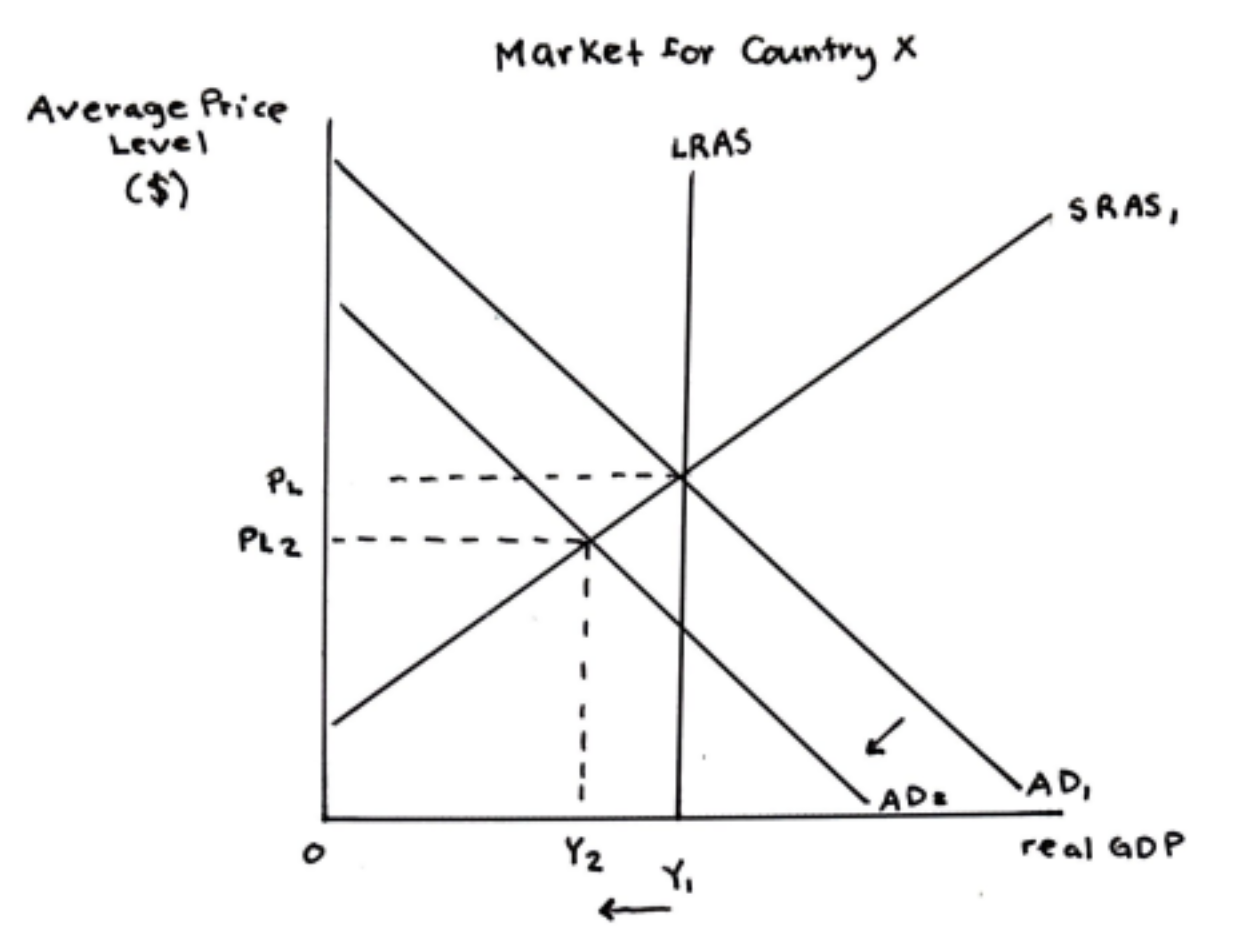
bad deflation
AD shift in. Ex: great depression (1930s)
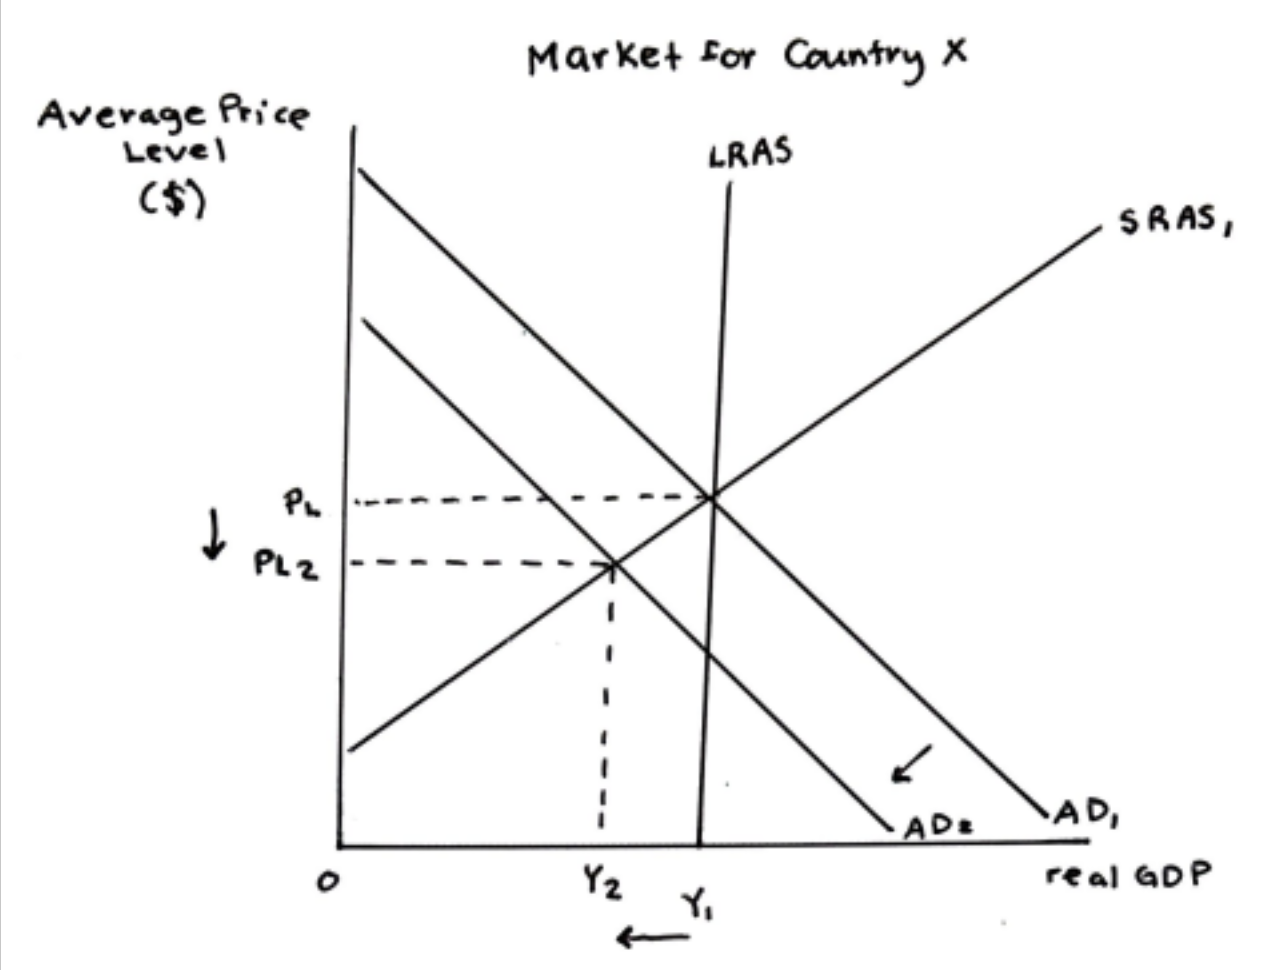
drop in AD (negative growth)
Ex: US COVID-19 lockdowns in 2020
negative supply shock unemployment
SRAS shift left. Ex: US COVID-19 supply chain disruptions in 2020
long run economic growth
LRAS right, SRAS right w/ LRAS. Ex: US tech innovation and human capital growth (1990s-2000s)
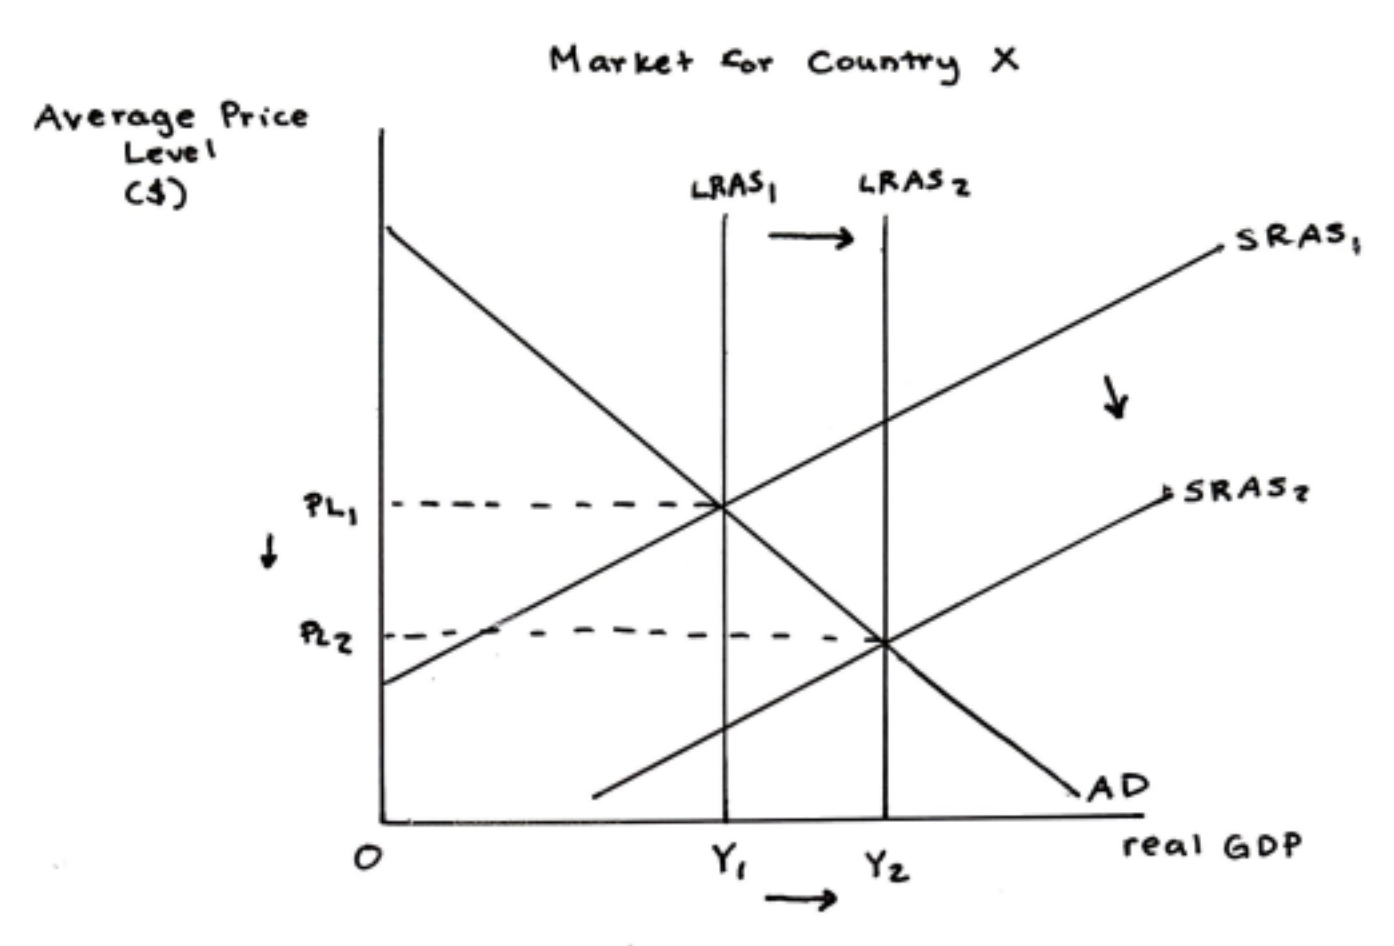
good deflation
LRAS right, SRAS right w/ LRAS. Ex: US tech sector efficiency and falling prices (2010)

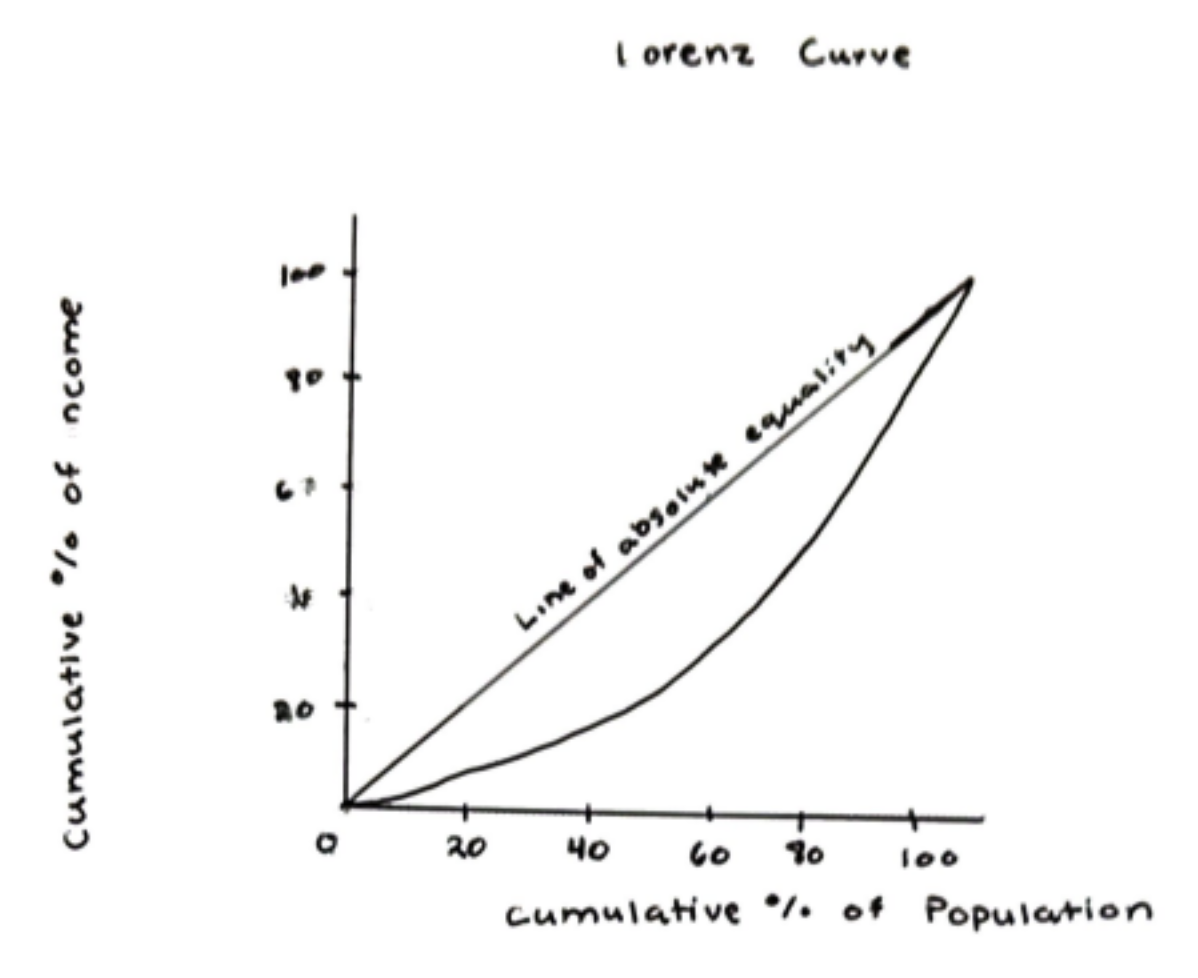
lorenz curve
Ex: US income inequality (gini ~ 0.41)
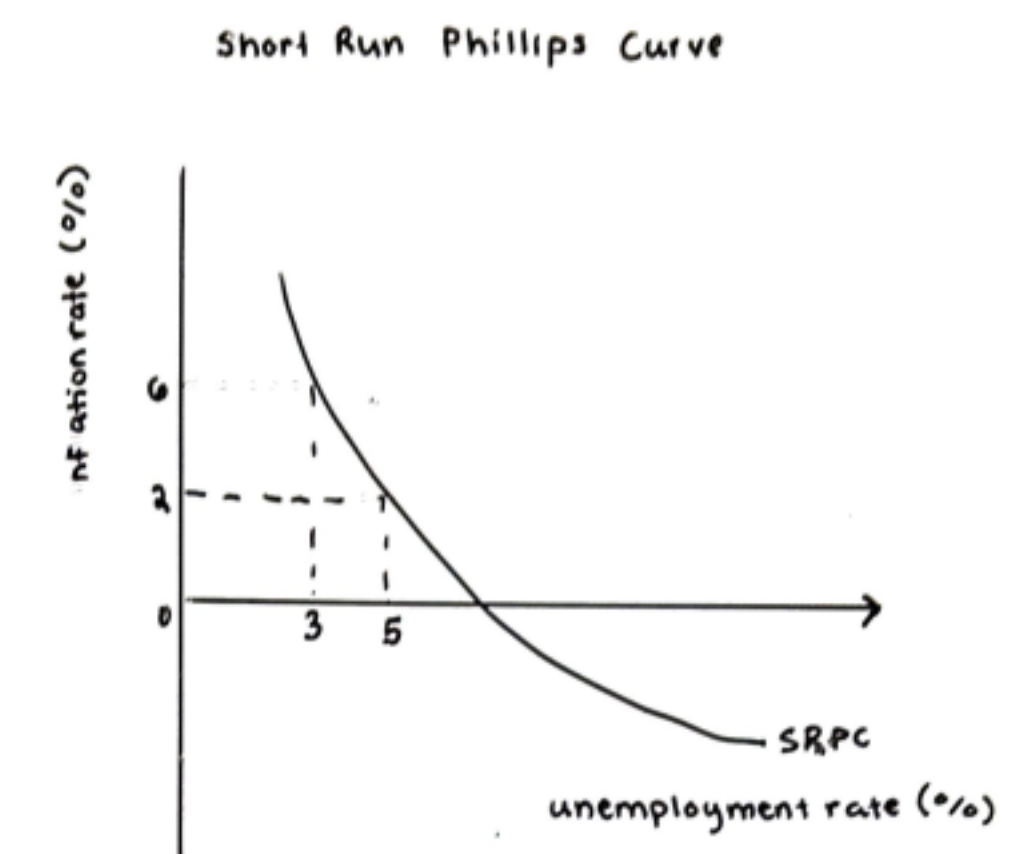
short run phillips curve (HL)
Ex: US low unemployment and rising inflation (2018-2019)
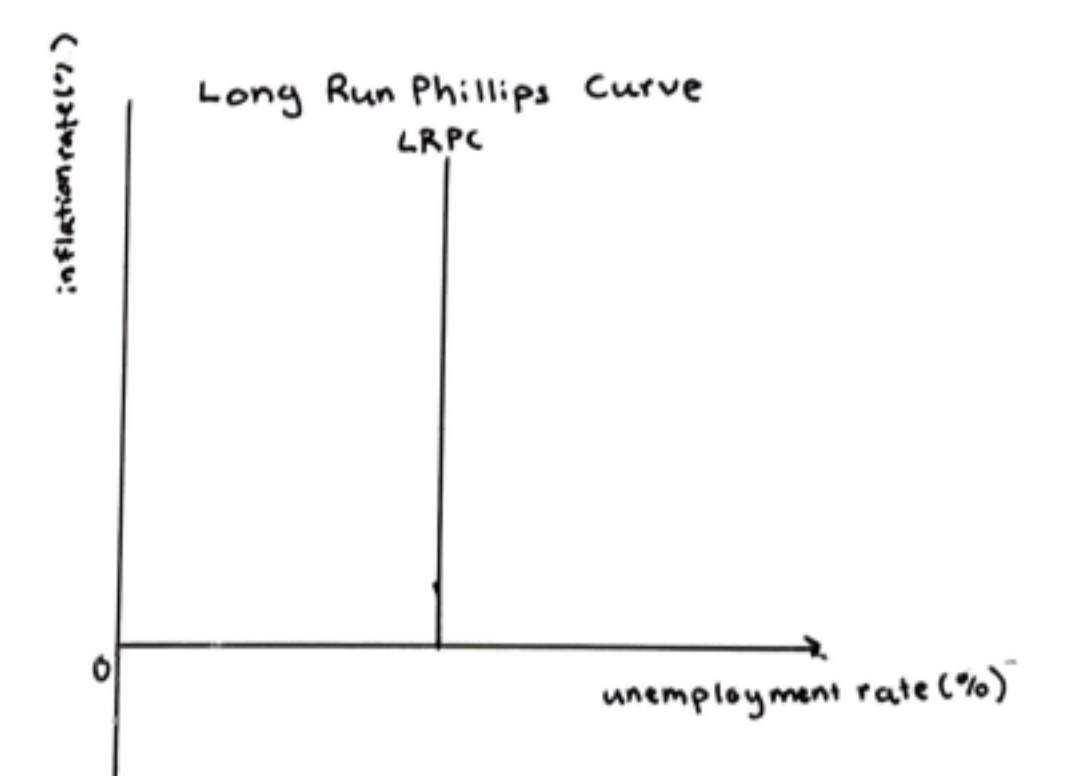
long run phillips curve (HL)
Ex: US natural rate of unemployment (~4-5%)
inflationary spiral
AD1 shift out, SRAS1 shift in, AD2 shift out. Ex: US wage-price spiral in 1970s
