IB ESS Topic 8
1/74
There's no tags or description
Looks like no tags are added yet.
Name | Mastery | Learn | Test | Matching | Spaced |
|---|
No study sessions yet.
75 Terms
Demographics
the study of the dynamics of population change
Exponential curve-
when populations follow an accelerating rate of growth which is proportional to the population size
Crude Birth Rate (CBR)
number of births per thousand individuals in a population per year
Crude Death Rate (CDR)
number of deaths per thousand individuals in a population per year
calculate CDR and CBR
dividing the amount of deaths or births by the population, and then multiplying it by 1000.
Natural Increase Rate (NIR)
rate of human growth expressed as a percentage change per year.
calculate NIR
CDR-CBR, then divide it by 10.
Doubling Time (DT)-
the time it take for a human population to double
Total Fertility Rate (TFR)-
average amount of children each woman has over a lifetime.
3 Estimates on Human Population Growth Over Time
High Variant- assumes that CDR will continue to fall rapidly but that the CBR will continue to fall slowly
Medium Variant- middle ground and straight forward projection of the curve
Low Variant- assumes we will not find a cure to AIDS or any of the other big killers and that CBR will fall.
Factors That Affect Population Size
Birth Rate
Death Rate
Immigration
Emigration
Fertility Rates-
number of births per thousand women of childbearing age.
Fertility Rate + 2.0)
higher pop
fertility rate -(2.0)
lower pop
Differences between Birth Rate and Fertility
Birth Rate expressed in percentage forms, births per thousand of total population (male, female, child, old)
Fertility represents only women
Human Development Index (HDI)-
measurement of "well-being" for a country.
(wealth, life expectancy, gross domestic product, education)
Factors that drive MEDC's
North Americas, Europe, Japan, Israel,
Industrialized nations w/ high GDP
Population is relatively rich
Individuals are unlikely to starve
Relatively high level of resources
being used
Low population growth rates largely to do with CDR and CBR
Very high ecological footprints and carbon footprints
Factors that drive LEDC's
Sub Saharan Africa, large areas in Asia, South America
Less or non industrialized at all
May have raw materials but tend to be exported into MEDC's
Populations has low GDP and right poverty rates
More people are poor with low living standards
High population rates due to rapidly falling CDR
Low ecological and carbon footprints
The Term (1st, 2nd, 3rd, and 4th World)
Respectively used to refer to...
Technologically advanced democracies
Communist States within the soviet Bloc
Economically underdeveloped countries
Stateless nations
Factors that drive a NIC (newly industrialized country)
Increased industrial development and increased GDP
Massive foreign investment
Population migration to cities providing workforce
Free trade and increased civil rights
Countries Considered to be a NIC
China, India, South Africa, Thailand, Turkey, Mexico, Brazil
Underminers of Human Population Growth Effect on the Environment
More people require more resources
More people produce more waste
People demand increased living standards
The more people there are, the greater the impact is
Demography-
statistical study of which includes human population, total size, age and sex composition, change over time w/ variation in births and death rates.
Factors That Affect Our Resources And Impact on The Environment
Size of the population
Wealth of the population
Resource needs and desires
Malthusian Theory
Expressed views on the danger of overpopulation and claimed that food supply was the main limit to overpopulation
-explains the human population grow geometrically (2, 4, 8, 16, 32)
Explained food supply only grew arithmetically (2, 4, 6, 8, 10, 12)- was limited by the lack of land
"Laws of Nature," dictated that a human population can never grow over the food supply
Factors That Lead To An Increase In Food Production
Productivity capacity of the land
Existing levels of technology
Factors Leading To Food Declination
Over cultivation
Soil Erosion
Limitations of the Malthusian Theory
Too simplistic
Ignores the reality that only the poor go hungry
Technology can feed the whole globe
Lack of consideration for globalization
Boserup's Theory
Asserts that population increase would result in a stimulation of technological increase which would later stimulate food productions
Also suggest that any increase in population will result in an increase for food production, thus demanding that that agrarian technology will need to change
As population increased so does the demand on technologies
Limitations of Boserup's Theory
Based on assumption of closed community
Closed in communities aren't possible because of constant immigration
Overpopulation may also lead to unhealthy land practices of crop cultivation
Population increase does not always lead to technology increase
Factors That Lead To Large Families
High Infant and Childhood mortality (more chance of a child reaching adulthood)
Security in old age (more of a chance of the parent being cared for be the child)
Children are an economic asset (more kids able to be worked out in the fields)
Status of women (typically considered as being subordinate to men, meaning they are the primary workforce that help manage agricultural)
Ways of reducing family size
Providing education
Improving health
Family counselling
Enhanced income
Improved resource management
Demographic transition model (DTM)-
pattern of decline in the regards of fertility and mortality due to social and economic developments
The 5 Stages of DTM
High Stationary (Pre Industrial Society)- High births due to no birth control, high infant mortality rates, cultural factors of encouraging large families. High death rates due to disease, famine, poor hygiene and little medicine.
Early Expanding (LDCs)- Death rates drops as a result in increase of sanitation, and improvements in food sources. Diseases are decreasing. Birth rates are still high, though child mortality drops due to improved medicines.
Late Expanding (Wealthier LDCs)- Nations becoming wealthier cause a decrease in birth rates because of their accessibility in things like healthcare, education, and emancipation for women. Population levels begins to level and more desire for good materials and less infant death rate indicate that they are more families of smaller size
Low Stationary (MEDC's)- Low birth rates and death rate, industrialized nations, and stale population sizes.
Declining (MEDC's)- Population may not be replaced as fertility rate is low. Problems arise within an ageing workforce
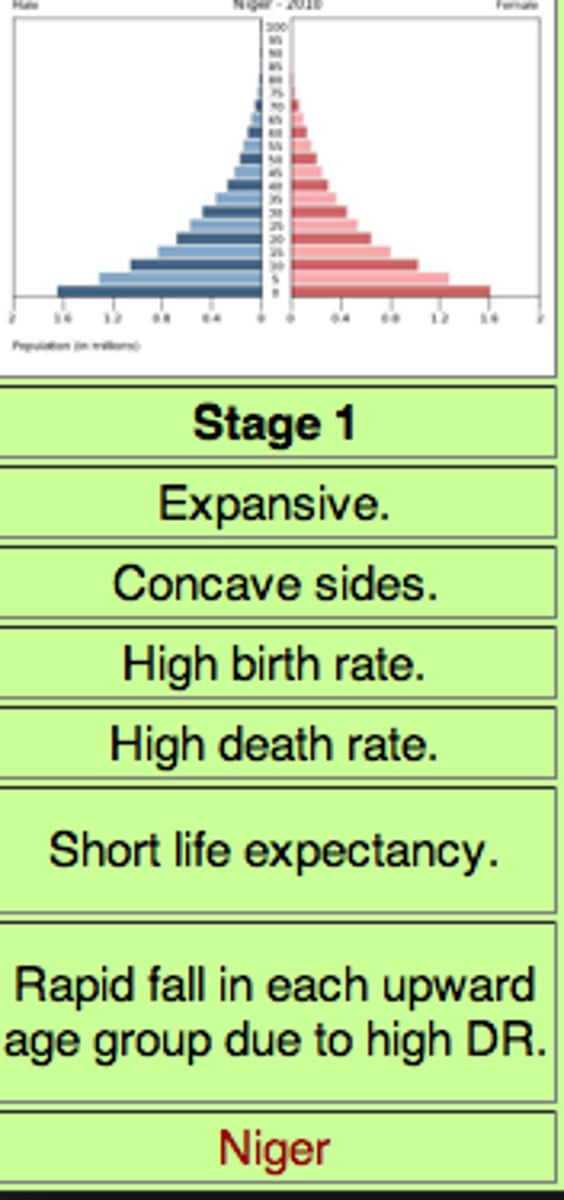
Population Pyramids Stage 1 Expanding
high birth rates, rapid fall in upward age group due to high death rates, short life expectancy
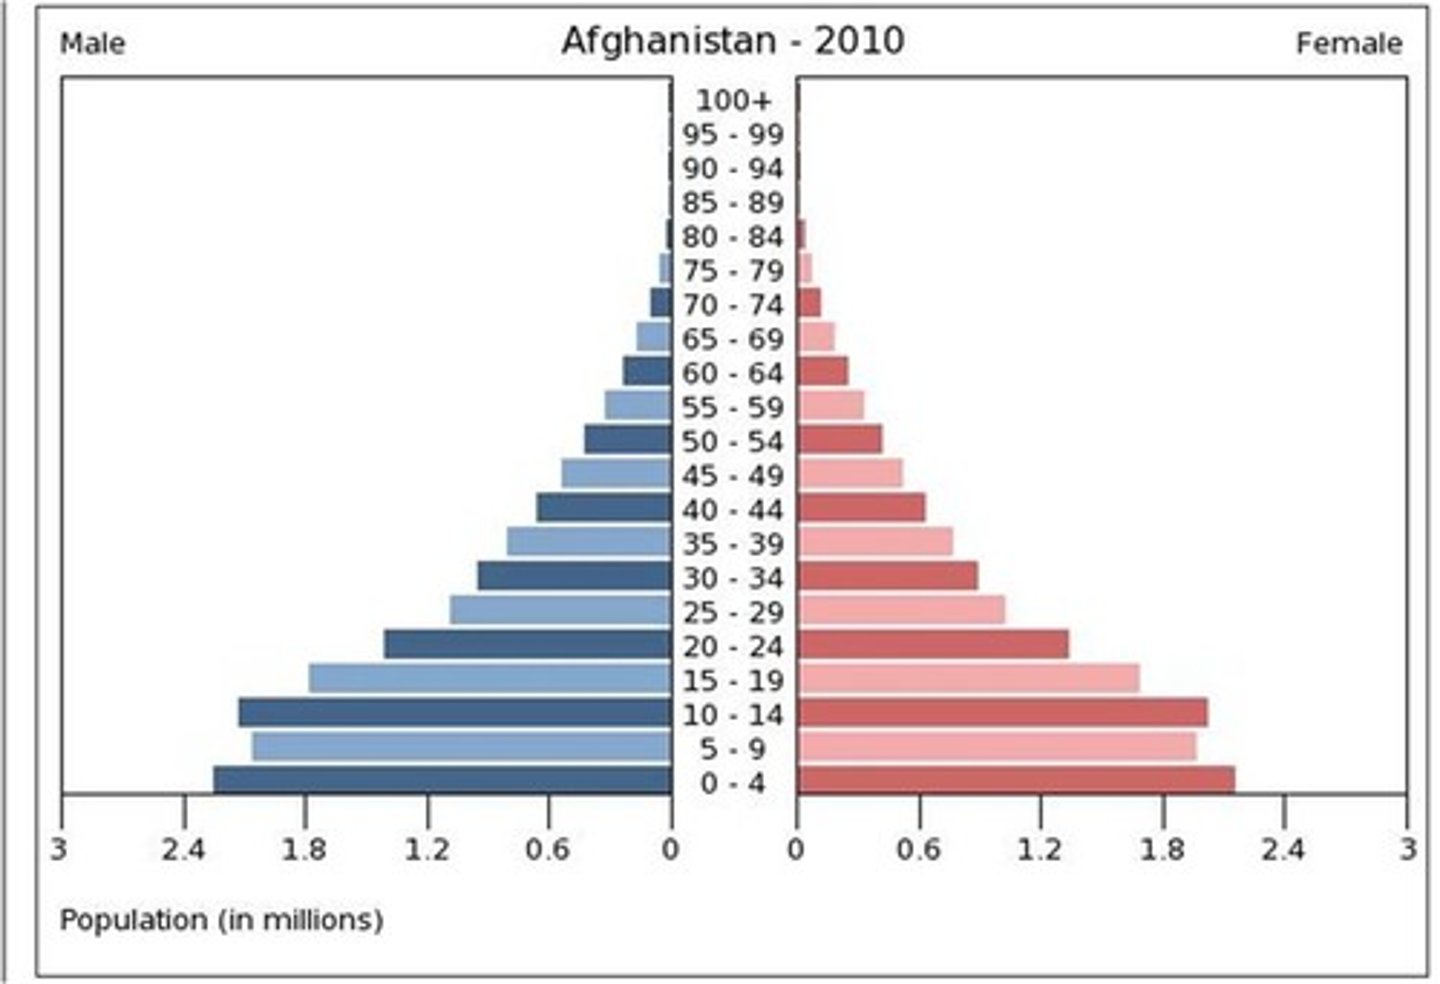
Stage 2 (Expanding)
High birth rates, fall in death rate as more living to middle age; slightly longer life expectancy
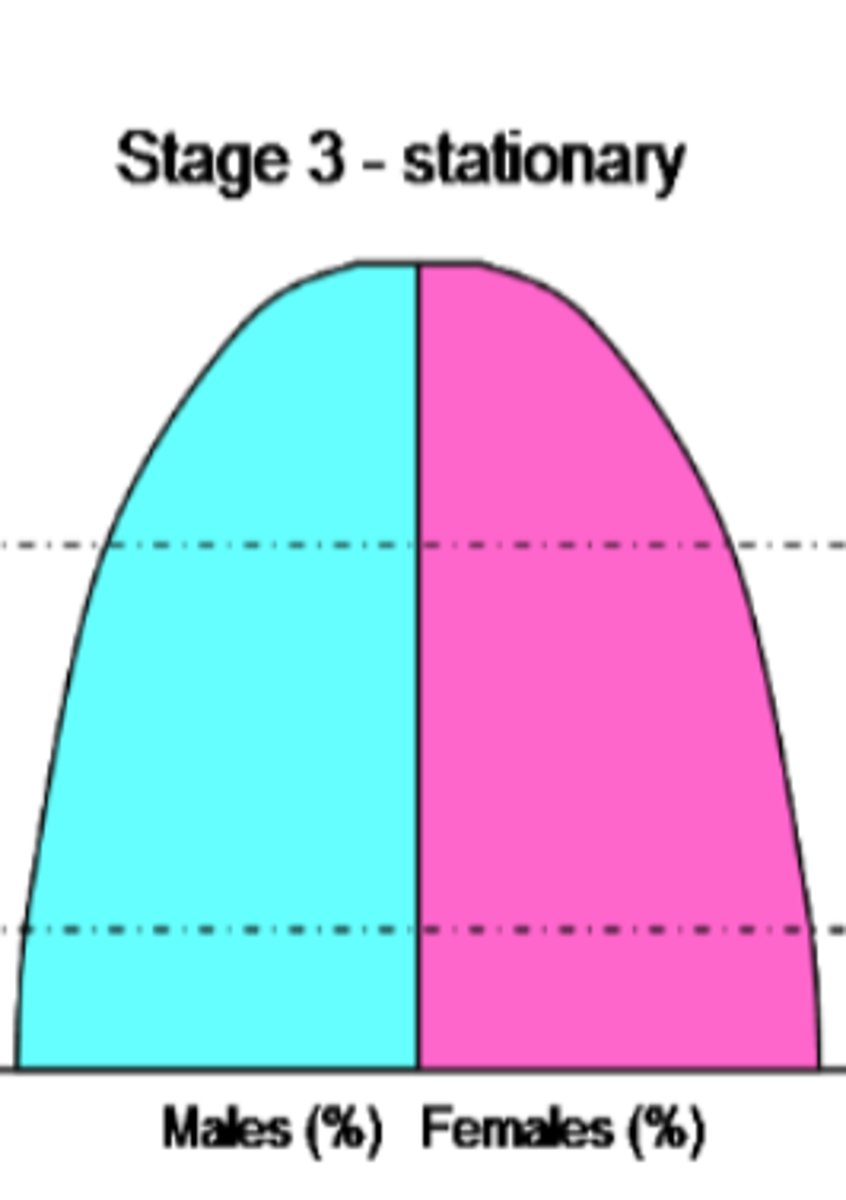
Stage 3 (Stationary)-
Declining birth rate; low death rate; more people living to old age
Stage 4 (Contracting)-
low birth rates; low death rate, higher dependency ratio; longer life expectancy.
Limitations With Population Pyramids
This model set doesn't feature a 5 pyramid to it. It does not feature population declination.
The fall in death rate is over exaggerated
AIDS and other disease would have effect on thiS (this is ignored in these models)
It is assuming contraception. It is assuming the obtention of education. This is always not the case
Factors That Lead To Decreased Population Growth
Governmental pension schemes
More and high taxes
Economic stimulation that lead to increased accessibility of education or health care
Urbanization
Educative and economic policies aimed directly at women
Factors Leading To Increased Population Growth
Agricultural development, increased sanitation facilities, and public health sectors
Lowing taxes, increased health care and free education
Immigration movements
Natural Income
rate of replacement of a particular or natural capital
Renewable Natural Capital
resources able to be replaced as fast as it is being used
Nonrenewable Natural Capital-
resources only replaceable by geological timescale
Factors That Give Resources Important Value
Natural resources that have good value to humans
Resource that provide services to humans that support life also (photosynthesis, Water Cycle, maintenance of ecosystem
Natural capital yields natural income (yield, or harvest or services)
Renewable Natural Capital Includes...
Organisms that use solar energy and photosynthesis
Non living items (groundwater and ozone layers)
Non Renewable Natural Capital Includes...
Some of these values can include... (soil, water in aquifers, fossil fuels)
Water is a pre determined values (either renewable or nonrenewable)
Iron ... when extracted is a nonrenewable source
Factors That Determine The Use of a Natural Capital
Politics, the environment, social and cultural values, and technology
Hydrogen fuel cells replacing hydrocarbon based fuel- harvesting algae as a food source
Example of Changing Values of natural Capital\
Many of the cork oak trees were harvested for the biodegradable cork wine bottle sealings. There being replaced by plastic cork sealing which aren't biodegradable and also are made by fossil fuels. Cork forest are losing their natural capital value and thus are being chopped down for property use. The trees have acquired biodiversity.
Valuation-
natural capital that we can put prices on
Factors That Determine Valuation
Economic price of a marketable good
Ecological functions (water storages)
Recreational functions (tourism, leisure activities)
Non-Valuation-
natural capital that is almost impossible to put a price on
Factors That Determine Non Valuation
Intrinsic value
Potential future energy source use
Has value to preexisting future generations
Socioeconomic Environmental Assessment (SEA)-
trying to value the environmental and track resource depletion.
Solid Domestic Waste (SDW) / Municipal Solid Waste (MSW)-
human waste (garbage) from urban and residential zones.
Types of SDW
Biodegradable- food waste, paper, green waste
Recyclable- Paper, glass, metal, some plastics, cloths
Waste Electrical and Electronic Equipment- TV's, computers, phones
Hazardous- paints, chemicals, light bulbs
Toxic- pesticides, herbicides
Medical- needles, syringes, drugs
Inert- concrete construction waste
Mixed- plastic toys
Operations That Produce Waste
energy productions, transportation, industrial processes, construction, selling of good and services, domestic activities)
Linear Model's Process
Find the raw materials or natural capital
Uses the energy to produce goods
Breaking down of an item leading to it becoming a deterrent
The Aims of A Circular Economy
Restorative to the environment
Uses renewable energy resources
Elimination or reduction of toxic wastes
Eradication of waste through careful design
Strategies To Managing (SDW)
Reduce, Reuse, Recycle
The Process of Waste To Energy Energy Production
Trash is incinerated by an incinerator. The heated produced is then transferred into steam which then is used to directly power turbines or heat buildings
Anaerobic Digestion
Biodegradable matter is broken up by microorganisms in the absence of oxygen. Methane produced can be used as fuel and the waste can also later be used as fertilizer or soil conditioner.
Domestic Organic Waste
Can be composted or put into anaerobic digesters. Governmental authorities can collect organic waste and compost it on a large scale and sell the composted material which are fertilizers to the public .
Carrying Capacity-
the maximum number of a species or "load" that can be sustainably supported by a given area
Reasons on why it is difficult determining the carrying capacity for humans
Far greater range of resource use for humans
Substituting resources for when they run out
Resources from human to human may vary extremely
Importation of resources
Developing technologies will also lead to change in resource use
Ecocentrist-
People who attempt to virtually eliminate all non-renewable resource use, and minimize their use of renewable resource use.
Ethnocentrists-
People who believe that technological innovation will allow for a expanded human carrying capacity
Conventional Economist:
Argue that trade and technology increase the carrying capacity
Ecological Economist:
Argue that technological innovation increase will lead to increased efficiency when regarding the use of natural capital.
Problems with Increased productivity due to technological innovation
Long term carrying capacity will decrease
High productions cannot be sustained
Factors that result in an increase in Human Carrying Capacity
Less environmental demand
Reusing (reuse object more than once)
Recycling (object material is used again and again)
Remanufacturing (an object's materials are used to manufacture a product of similar conduct)
Absolute reduction in energy and material use (in general using less materials- paper, energy) --- often eroded by population increase
Ecological Footprint (EF)-
an area of land and water required to support a defined human population at a given standard of living.
Factors That Determine a Ecological Footprint
Lifestyle choices
Productivity of food production systems
Land use and industry
A Fair Earthshare-
amount of land each person would get if all the ecologically productive land on Earth were divided evenly among the present world population
Ecological Footprint's Dependence on a country
Population size
Consumption per capita
How many people and how much land one uses
Material Growth lands (timber areas, cow grazing, biofuels, etc)