AP Stats Project 1 Task 1
 Call Kai
 Learn
Learn Practice Test
 Spaced Repetition
 Match
Match Flashcards
 Knowt Play
1/20

There's no tags or description
Looks like no tags are added yet.
Name | Mastery | Learn | Test | Matching | Spaced | Call with Kai | Chat |
|---|
No analytics yet
Send a link to your students to track their progress
21 Terms
Individuals
- an object/ the "thing" being described in a data set
- depending on type of study, individuals can be observational or experimental units

Variables
-attributes of individuals that take different values for different individuals
Data Set
-a collection of data (set of multiple datum)

Categorical Variable
- a variable that assigns labels placing each individual into a category/group
- ex: color, age, group, graduating class

Quantitative variable (blanket term)
- a variable that takes number values that are quantities
Discreet Variable
- quantitative variable that takes on a fixed set of values that have gaps in-between
- ex: shoe size, age, etc.

Continuous Variable
- quantitative variable that takes on any value in an interval; includes in-between values
- ex: height, weight, test scores

Distribution
- something that tells us what values a variable takes and how often it takes those values
Frequency Table
-a table that displays the COUNT/FREQUENCY of observations in each category or interval

Relative Frequency Table
- a table that displays the PROPORTION/PERCENTAGE of observations in each category or interval

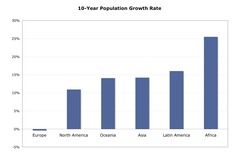
Bar Chart
- displays distribution of a categorical variable w/ heights of bars showing frequency/relative frequency for each values
-spaces between bars; used for categorical variables
Pie Chart
- shows the distribution of a categorical variable as a "pie" whose slices are sized by the counts/percentages for the categories
- must include all categories; used for categorical variables

Histogram
- shows each interval of values as a bar, heights of bars show frequencies/relative frequencies of values in each interval
- bars don't have spaces b/t; used for quantitative variables

Stemplot
- shows each value separated into 2 parts:
a) stem: consists of all but the final digit, ordered from lowest to highest and arranged in a vertical column
b) leaf: the final digit, arranged in increasing order from each stem

Split Stemplot
- contains 2 rows for each stem w/ leaves from 0-4 in the first copy & leaves from 5-9 in the second copy
Side-by-side stemplot
- Shows distribution of two variables with common stems

Shape terms
- Symmetric: right and left sides are approximately the same
- Skewed left: tail of data on L, peak at R
- Skewed right: tail of data on R, peak on L
- Unimodal/Bimodal: having 1 or 2 peaks/modes
- Uniform: relative frequency of everything is approximately the same (equally likely)

Unusual Features
- Outliers: data that falls outside the overall pattern of a distribution
- Gaps: spaces between data
- Clusters: data grouped together

Center terms (median/mode)
- Mean: the "average" of the data; add all data together then divide by amount of data
- Median: the "middle" of the data; count how many total values you have and find the midpoint

Spread/Variability Terms
- Range: difference between maximum and minimum values
- IQR: difference between Q3 & Q1
- Standard Deviation: typical distance of the values from the mean

Boxplot/ 5 number summary
- the five number summary consists of....
- minimum
- Q1
- Q2/median
- Q3
- maximum
