BSCI222 - After Exam 3 - Final
 Call Kai
 Learn
Learn Practice Test
 Spaced Repetition
 Match
Match Flashcards
 Knowt Play
1/74

Earn XP
Description and Tags
50% of final composed of this content.
Name | Mastery | Learn | Test | Matching | Spaced | Call with Kai | Chat |
|---|
No analytics yet
Send a link to your students to track their progress
75 Terms
Mendelian Traits are continuous or discontinuous?
Discontinuous (qualitative) traits because individual displays one phenotype or the other.
Example: Green vs Yellow pea
What is quantitative genetics?
The study of traits that show continuous variation that are influenced by multiple genes and environmental factors.
Env Factors: Climate, living conditions
Continuous Variation
Traits that fall between 2 extremes on a spectrum.
“How the trait is distributed.”
Additive genetic variation
More genes that influence trait will have a stronger effect on the phenotype
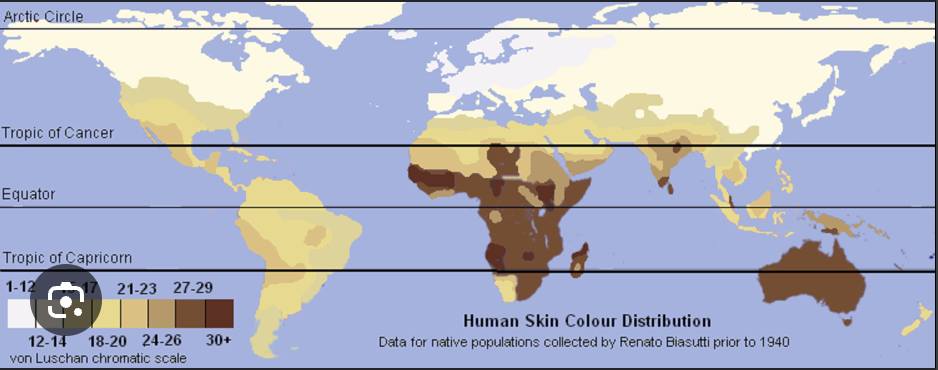
Why are quantitative traits considered additive?
Traits are considered additive because each gene has a small contribution to the phenotype (Additive Genetic Variation). The environment can also affect phenotype.
Meristic Characters
Vary in whole numbers
Number of pups in litter
Number of fingers
Threshold Characteristics
Traits that only appear once a certain genetic/environmental level is reached
Below the threshold → trait doesn’t show
Above the threshold → trait appears
Examples:
Type 2 diabetes (genetic risk + lifestyle)
Polygenic inheritance can be explained by rules of ______________.
Mendelian genetics.
The number of genes involved can be estimated from the number of parental phenotypes observed.
In Polygenic inheritance, what happens to the parental phenotype in the offsprings when there are more genes involved?
When more genes are involved, the chances of offspring displaying parental phenotype decrease.
What does (1/4)n represent in a cross?
The proportion of offspring with the parents’ genes in the F2 hybrid cross. Where n is the number of genes.
Midparent value
Offspring phenotype in between parental phenotypes
Frequency Distribution
A representation showing how different trait values occur in a population
True or False: Sampling is used to estimate mean (average) and variance (spread).
True
Population sampling requires: (2 things)
Random Sampling: Uses a random sample to estimate the population
Large Sample Size
Standard Deviation
Used to measure how much values deviate from mean
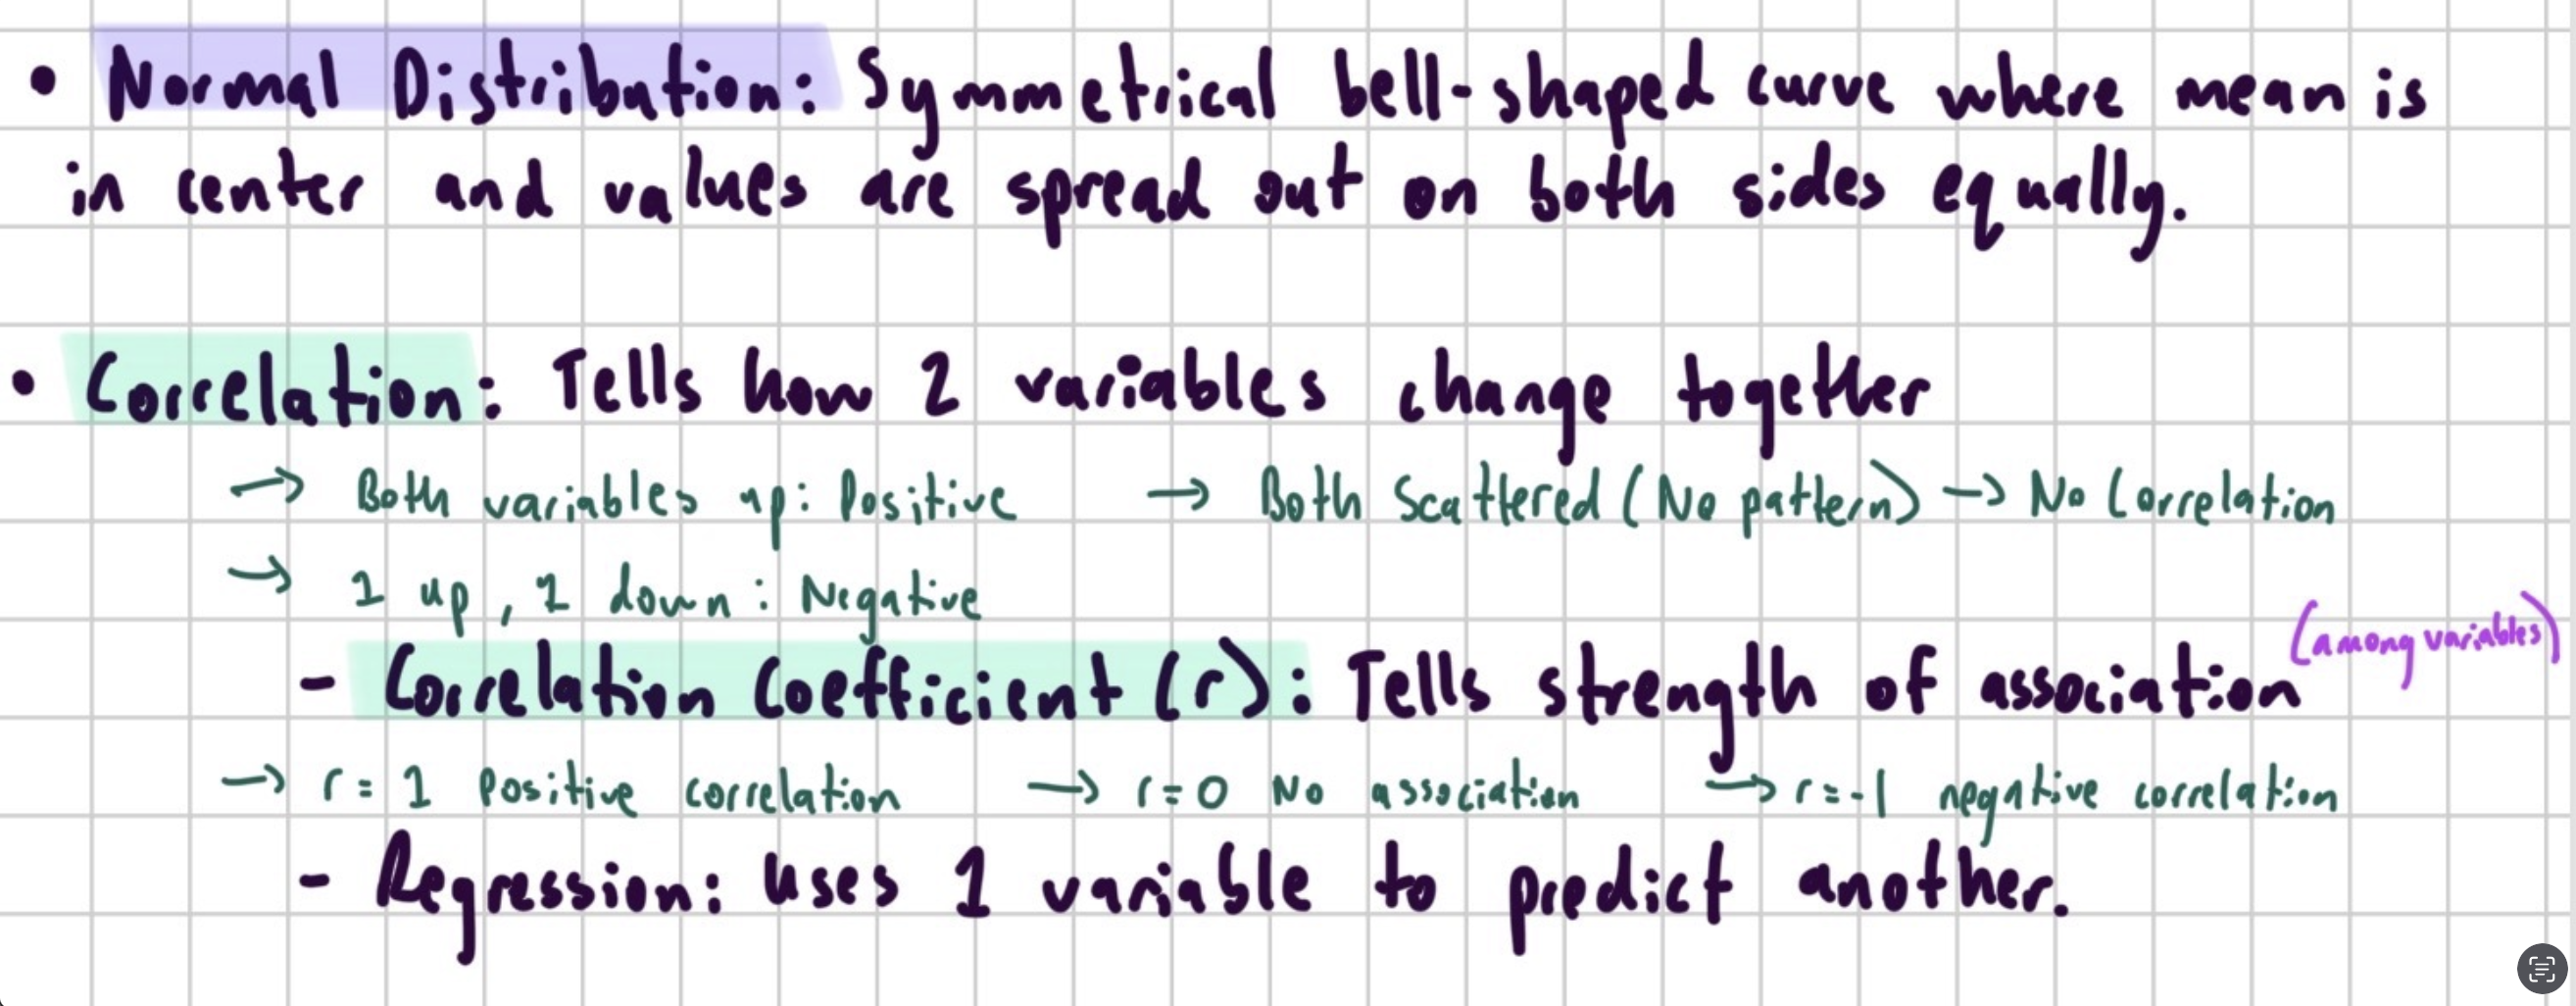
Normal Distribution
Symmetrical bell-shaped curve where the mean is in the center and values are spread out on both sides equally
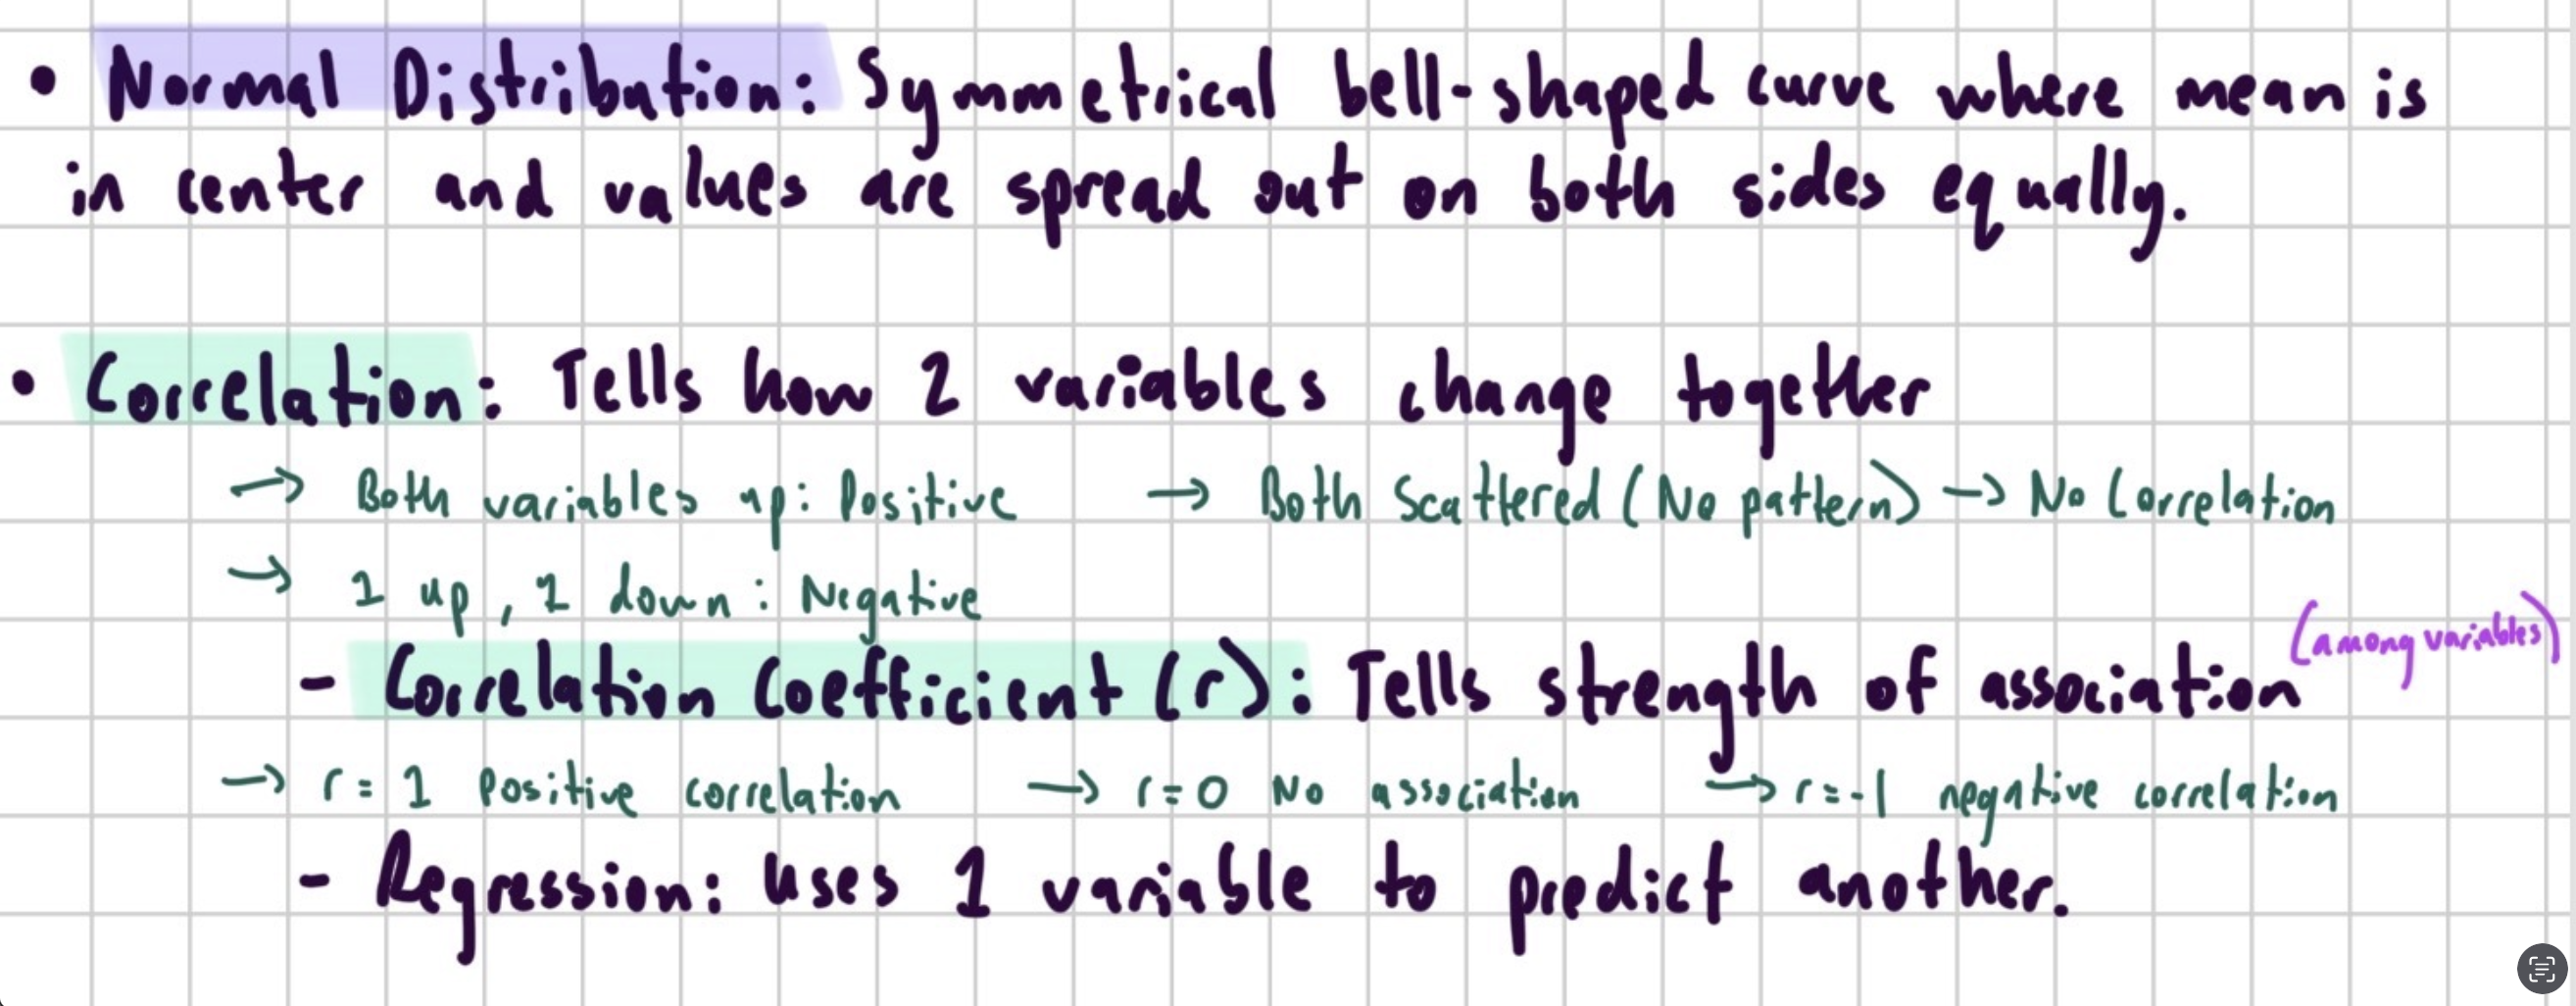
Correlation
Correlation Coefficient
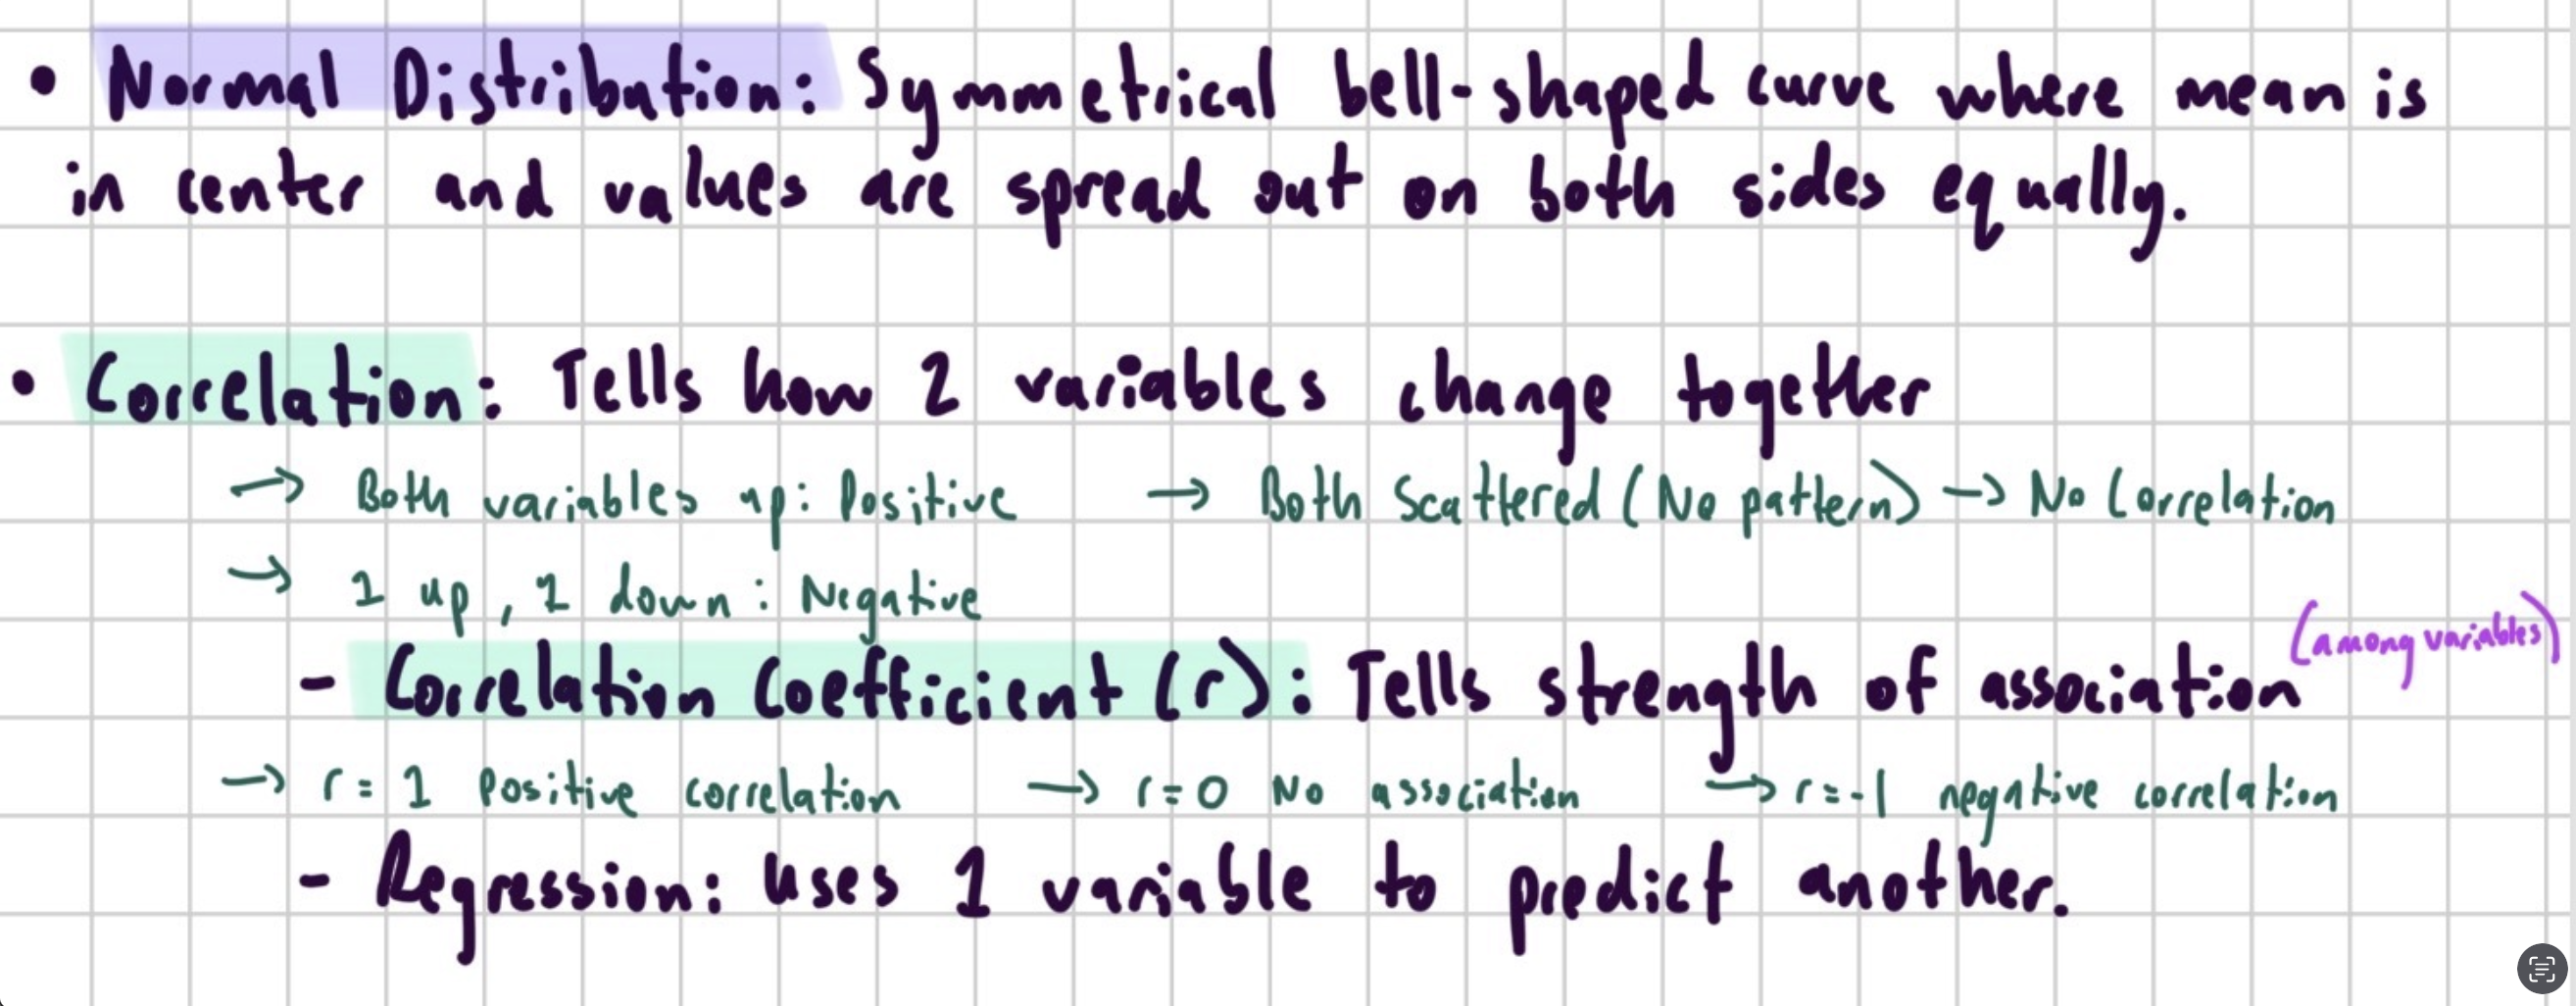
Regresstion
Heritability
How much of the variation is due to genetics
Phenotypic Variance (VP) is equal to
the total variation in a trait in the population (INCLUDES GENETIC + ENVIRONMENTAL VARIATION)
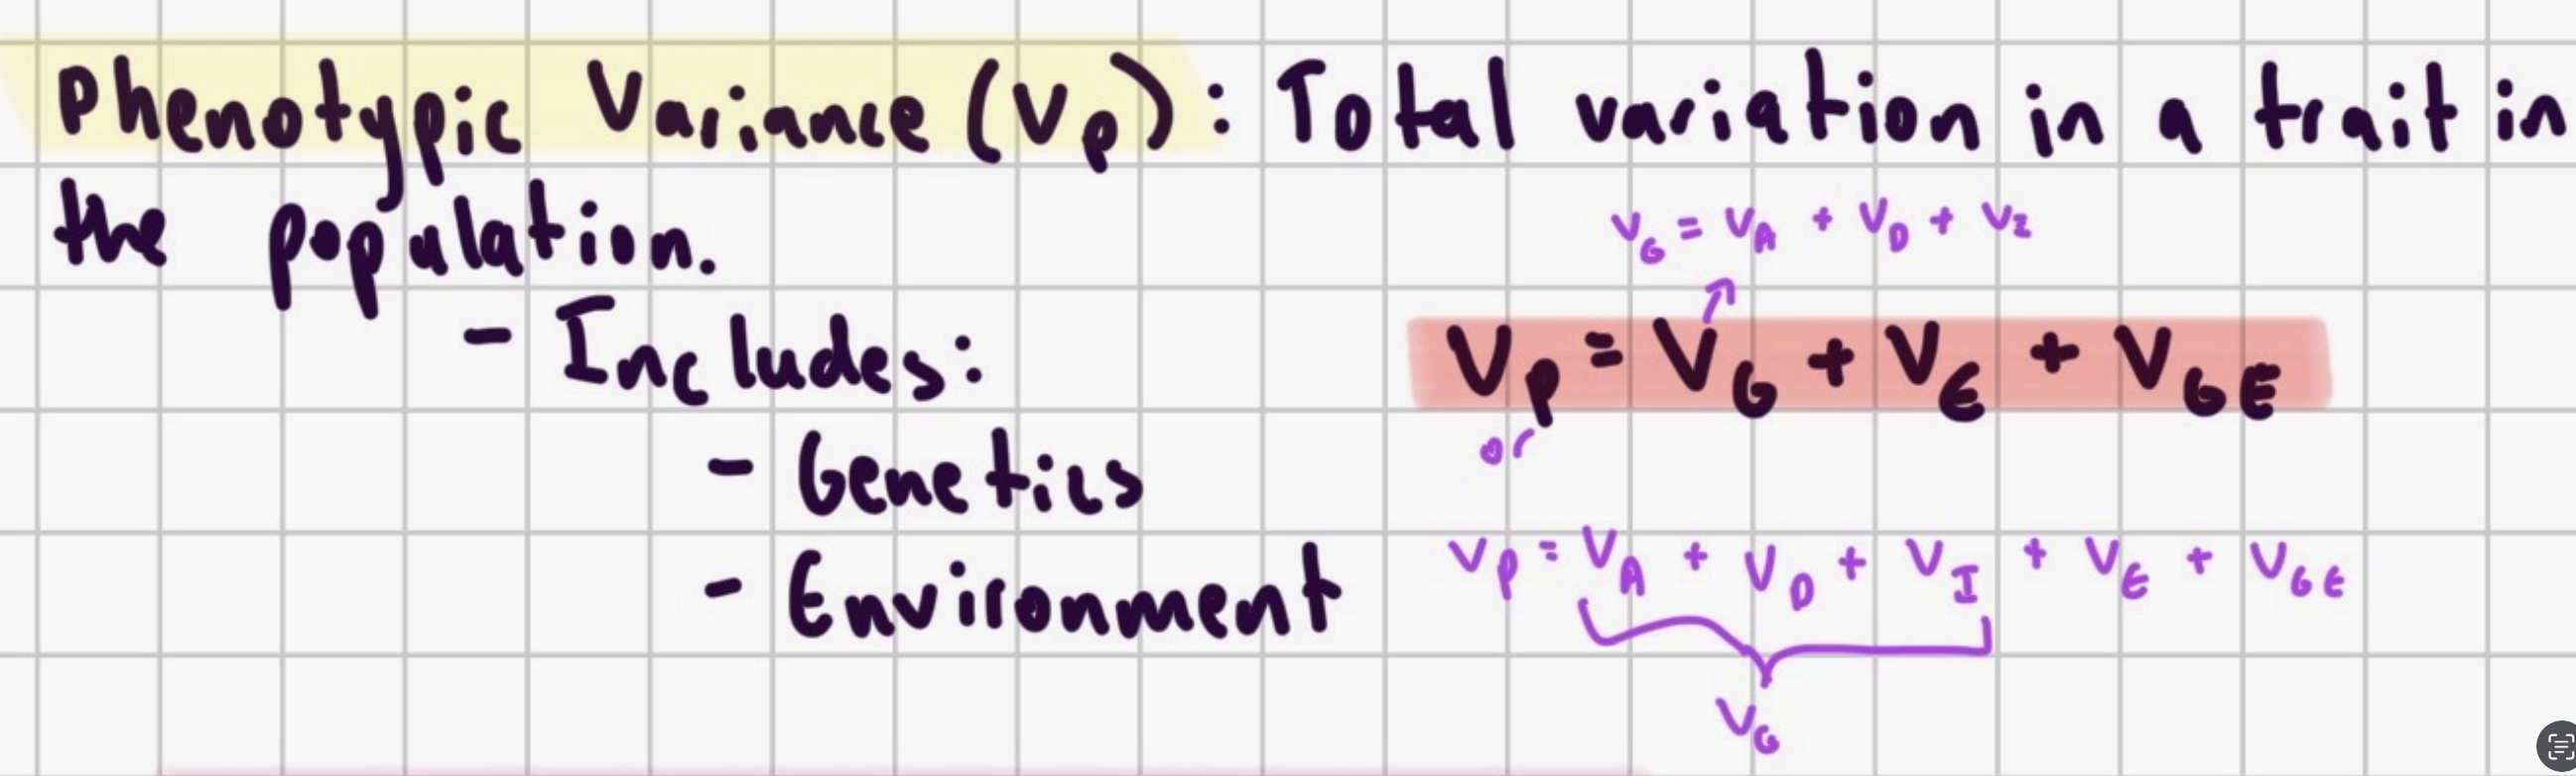
Genetic Variance (VG)
Includes:
Variation due to genotype (3 types)
Additive Genetic Variance (VA): Sum of effects of different alleles
Dominance Genetic Variance (VD): Dominant allele masks other allele (non-additive)
Gene Interaction Variance (VI): Genetic variance resulting from one gene influencing another.
Additive Genetic Variance (VA)
Phenotypic variance is explained by summing the effects of different alleles in a genotype.
Explains codominant alleles
Dominance Genetic Variance (VD)
Dominant allele masks other allele (non-additive)
Example:
In heterozygotes: Aa (dom A masks the effect of rec a)
Gene Interaction Variance (VI)
Genetic variance resulting from one gene influencing another.
Total Genetic Variance =
VG = VA + VD + VI
Environmental Variance (VE)
Variation caused by environment
Gene-by-environment Interaction (VGE)
Effect of a genotype on a trait changes depending on environment
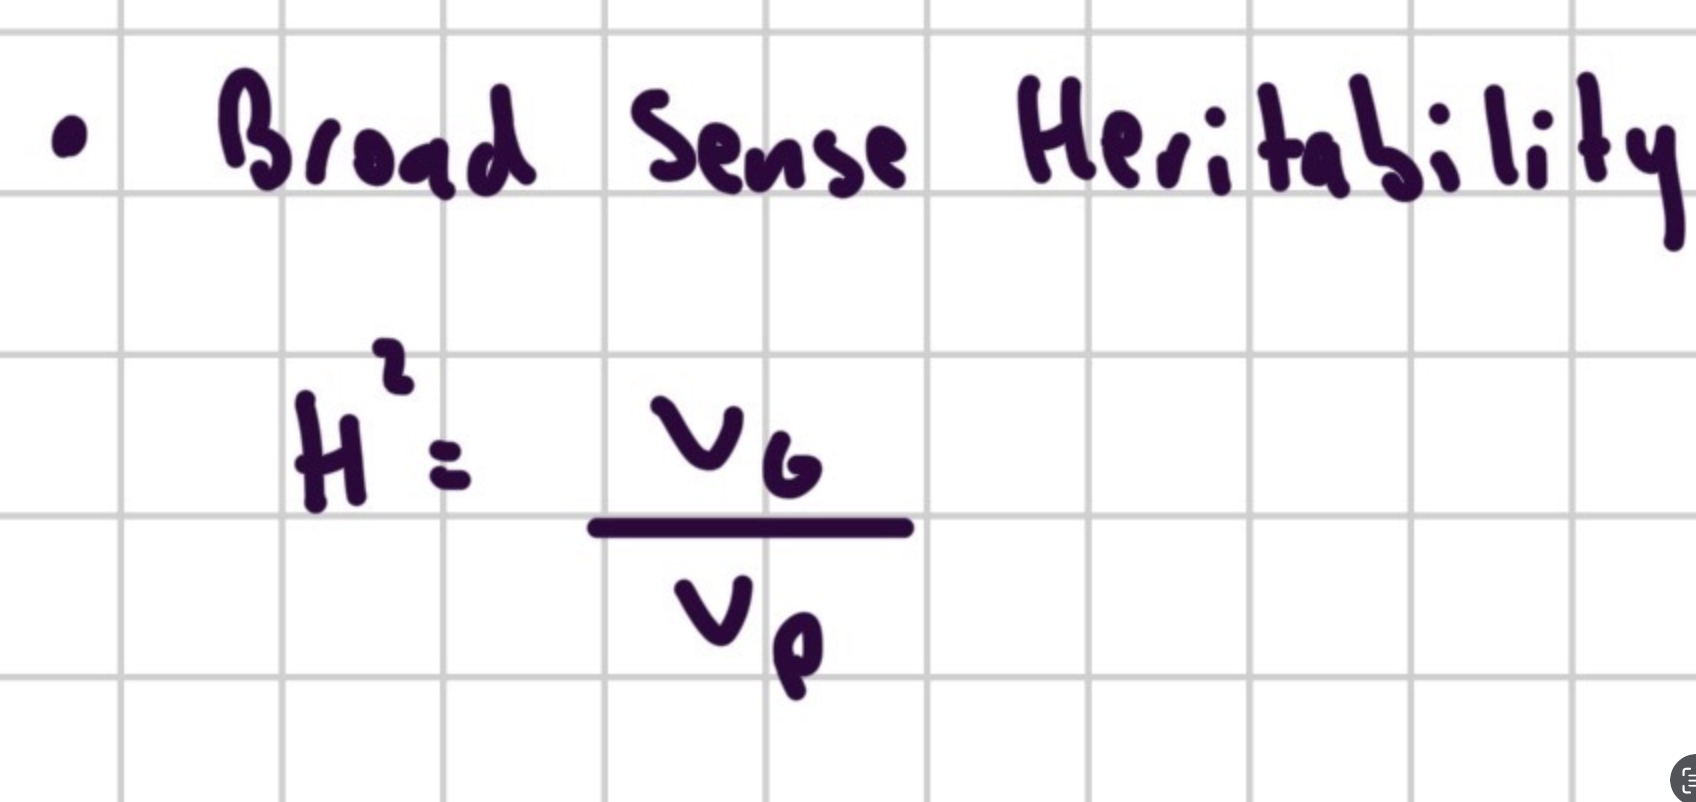
What is broad-sense heritability? How can broad sense heritability be calculated?
Broad Sense Variability: How much variation due to genetics alone?
H2 = VG / VP
Use experiments to get VG and VE individually.
VP is usually given.
How can you estimate genetic variance? How can you estimate environmental variance?
Since VP = VG + VE
Controlling Genetic Variance:
Control the environment that sets VE = 0. (SAME env for all)
Same env for entire experiment.
Controlling Environmental Variance:
Control genotypes by cloning ind or using twins or inbred lines
Different environments for genotypes
What is Narrow Sense Heritability?
Narrow Sense Heritability: Variation in trait due to additive effects of alleles.
h2 = VA / VP
What does Parent-Offspring regression analysis estimate?
Estimates narrow-sense heritability by plotting parent vs offspring phenotype.
Slope of h = 1 indicates offspring phenotype matches parent phenotype
Slope of h = 0 indicates trait is not heritable (variation due to environmental effects)
Explain how genome-wide association studies can be used to identify genes contributing to a quantitative trait. Explain Quantitative Trait Loci.
GWAS: Scans ind for SNPs
QTLs: Genomic regions that control variation of a quantitative trait.
GWAS identifies regions of the genome contributing to phenotypic variation, which can then be traced to specific genes influencing the quantitative trait.
Use information about selection pressure on phenotypic variation to calculate narrow sense heritability.
h2 = R/S
Change in trait mean after one generation.
R = Response to selection
Measures how much the offspring actually change
Mean of offspring - Mean of original pop
S = Selection Pressure
Measures how strong selection is on parents
Mean of parents - Mean of original pop
Population Genetics
Study of allele and genotype frequencies in populations, and how or why they change over time
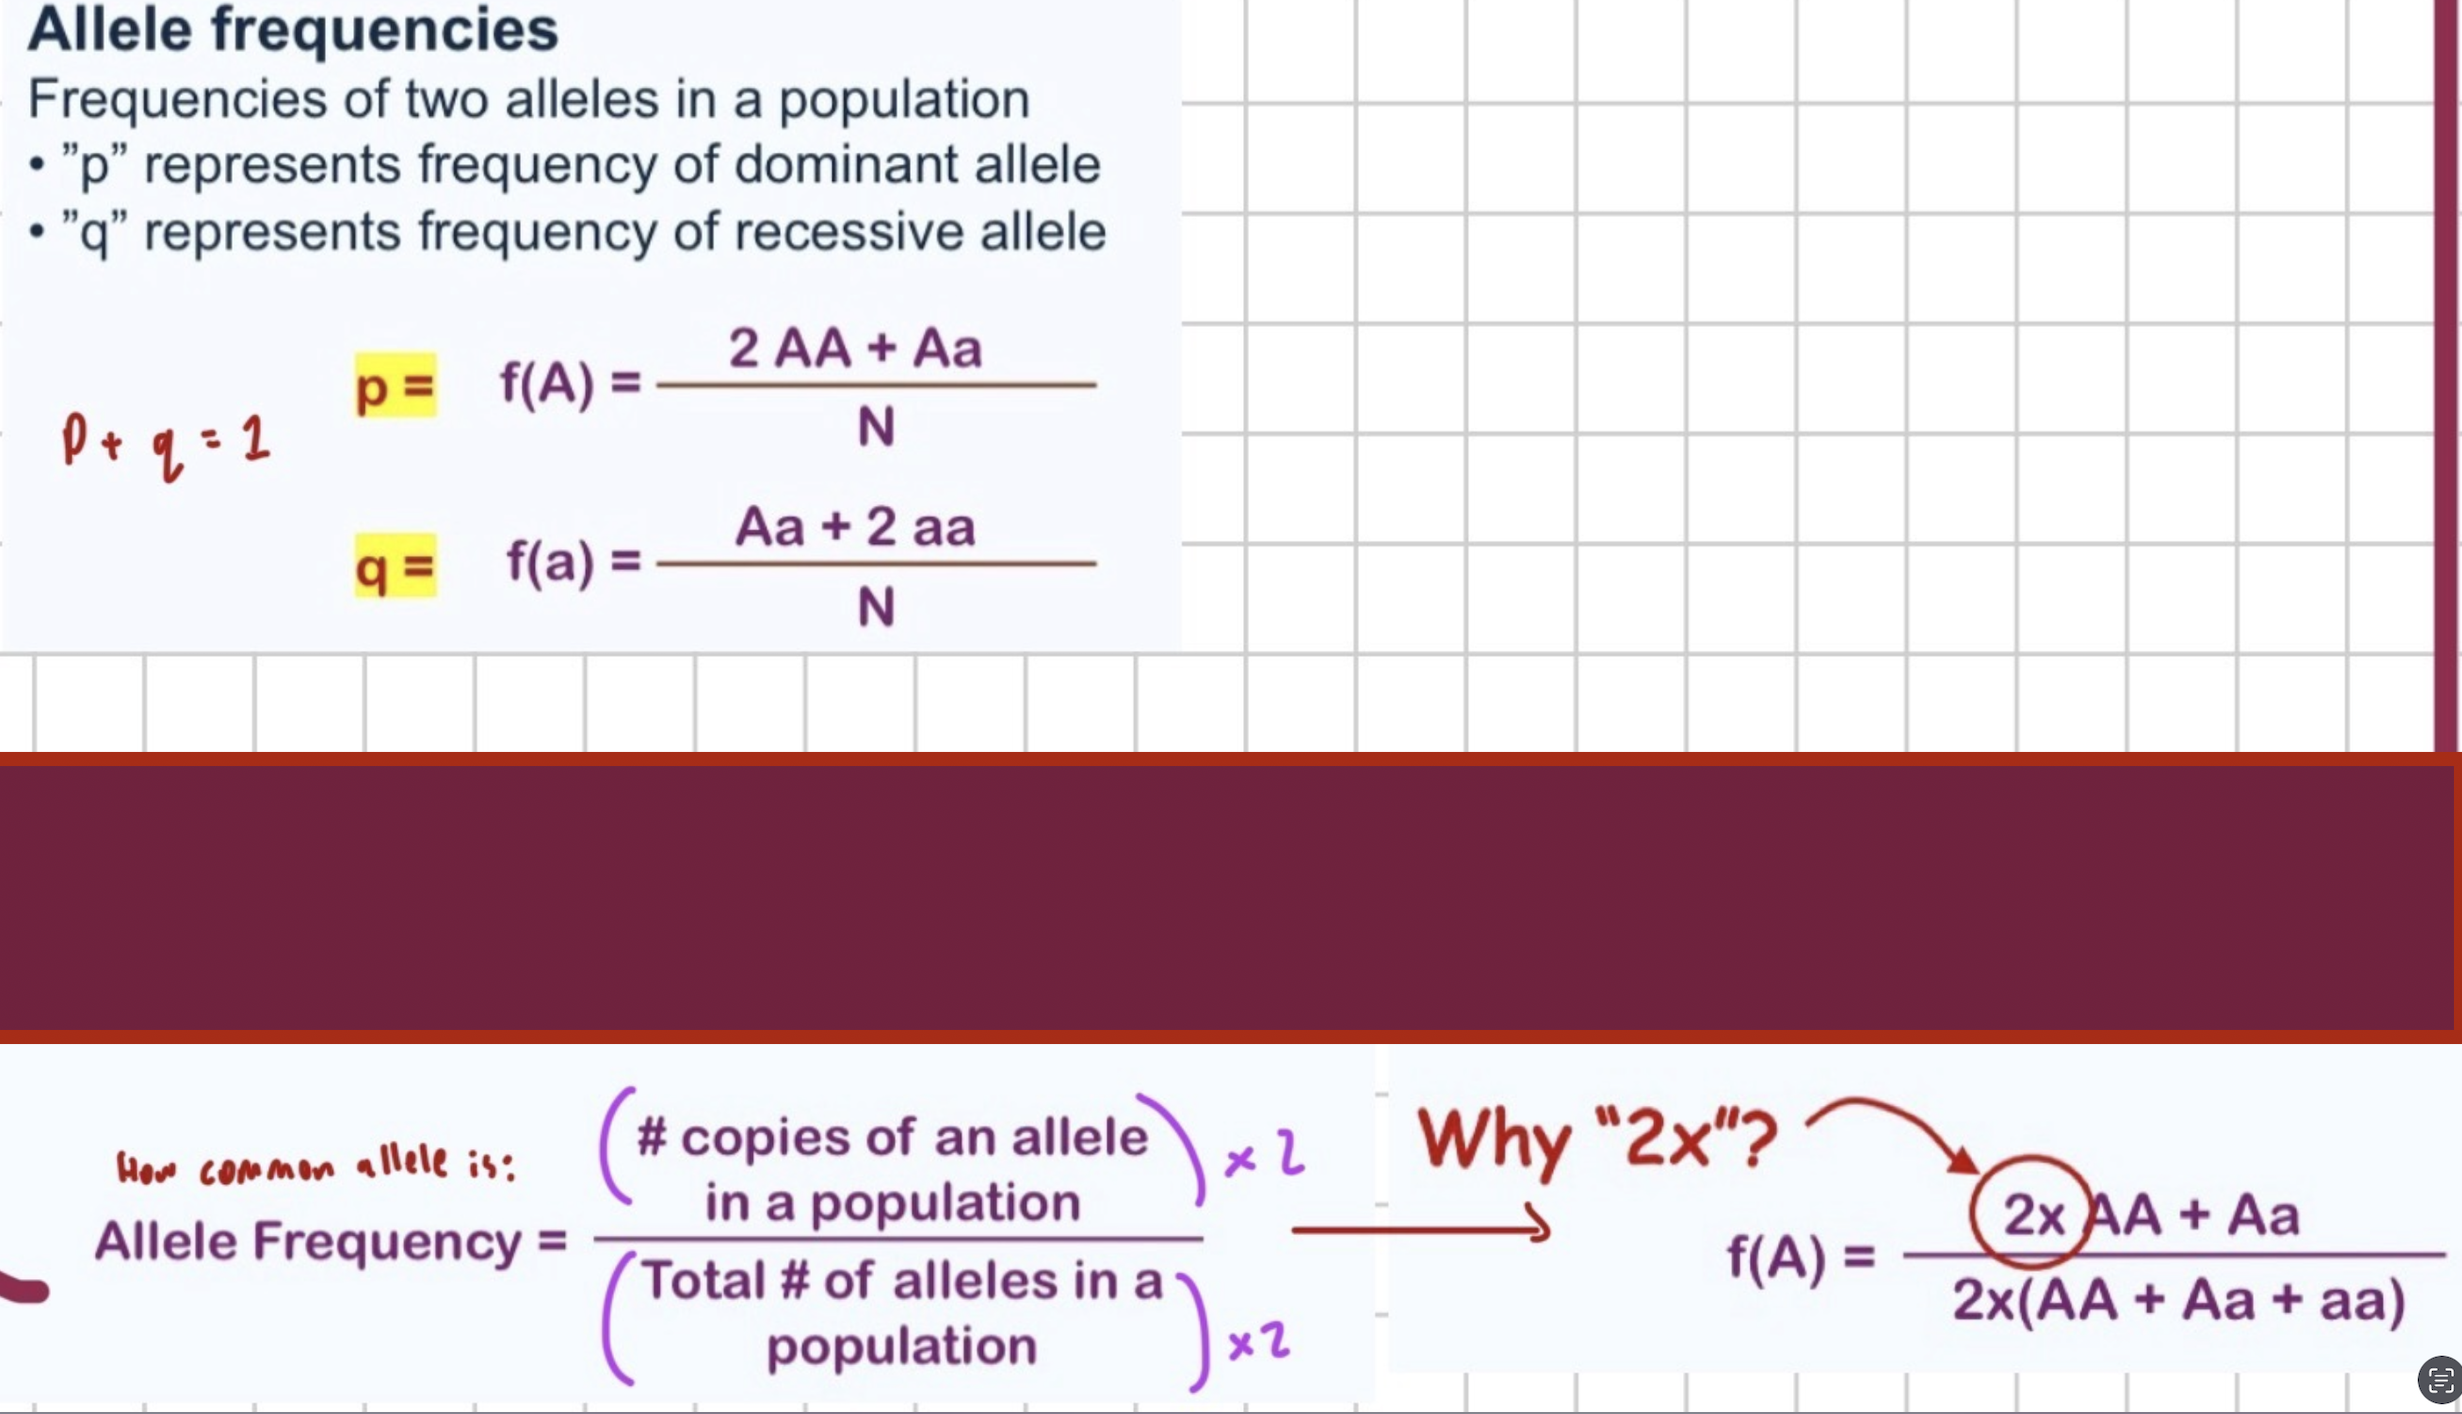
Allele frequency is _____.
Formula is ________.
What do p and q represent?
How common allele is
p = Freq of dominant allele
q = Freq of recessive allele
Genotype Frequency is _____.
Formula is ______.
How common a genotype combination is

True or False: If there are only two alleles, p + q = 1.
True
List the conditions for Hardy-Weinberg equilibrium. What are consequences of violating these assumptions?
Conditions:
Random mating, no migration, no selection, no mutation, very large population size.
Allele frequencies (p + q) must remain constant
Consequence:
Any of the above (migration or mutation to new alleles) results in variation that changes allele frequencies.
What is the equation for genotype frequencies with two alleles? (Used for Hardy Weinberg Equilibrium)
p2 + 2pq + q2
What indicates a population is in Hardy-Weinberg equilibrium?
Allele frequencies do not change over time (p and q).
Genotype frequencies do not change over time.
How can we test if a population deviates from the Hardy-Weinberg equilibrium?
Using the chi-square test for goodness of fit.
Find p and q (allele freq)
Use that to find genotype freq (p2, q2, 2pq)
Multiply genotype freq by appropriate observed counts to get expected
Use observed and expected to get chi square
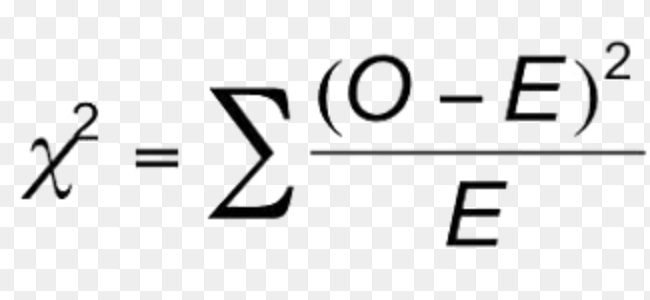
Chi squared Formula
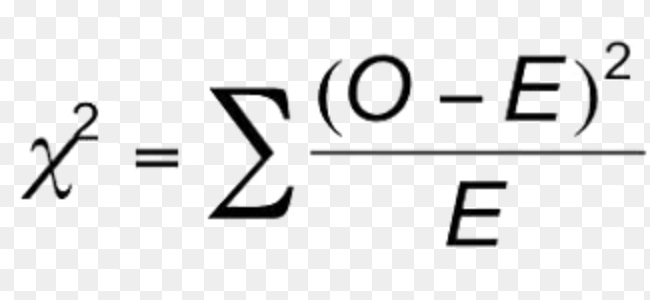
Degrees of Freedom
df= number of genotypes possibilities−number of alleles
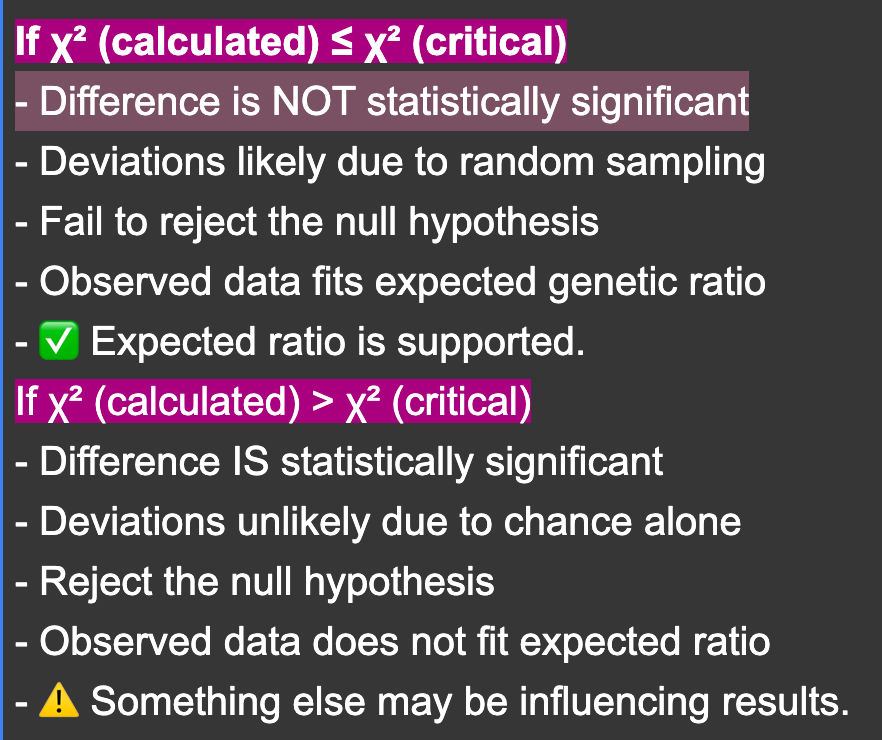
How do you interpret chi-squared value to determine HWE?
Use critical value at p = 0.05
Chi-Square < critical value
Population at HWE
“Difference is NOT statistically significant”
Chi-Square > critical value
Population not at HWE
“Difference is statistically significant”
Non-Random Mating
Individuals do not choose mate randomly = bias in offspring
3 Types of Non-Random Mating
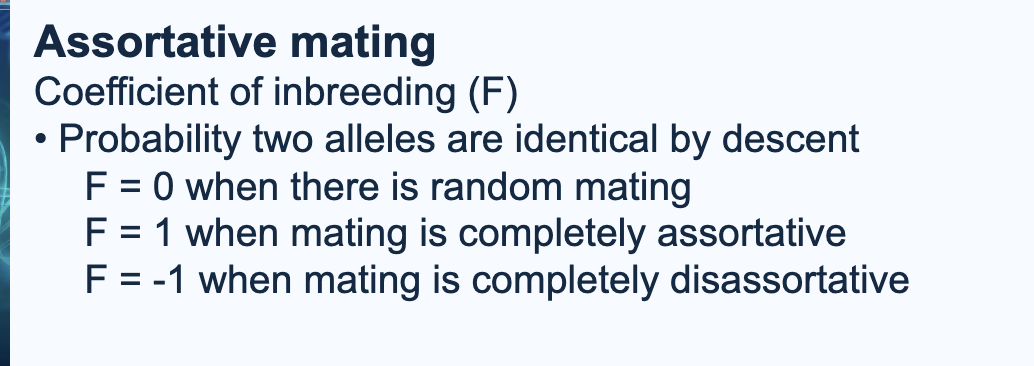
Assortative
Assortative: Preference for mates with similar traits
Increases Homozygptes
Decreases Heterozygotes
F= 1 (?????)
3 Types of Non-Random Mating
Disassortative
Disassortative: Preference for mates with different traits
Increases Heterozygotes
Decreases Homozygotes
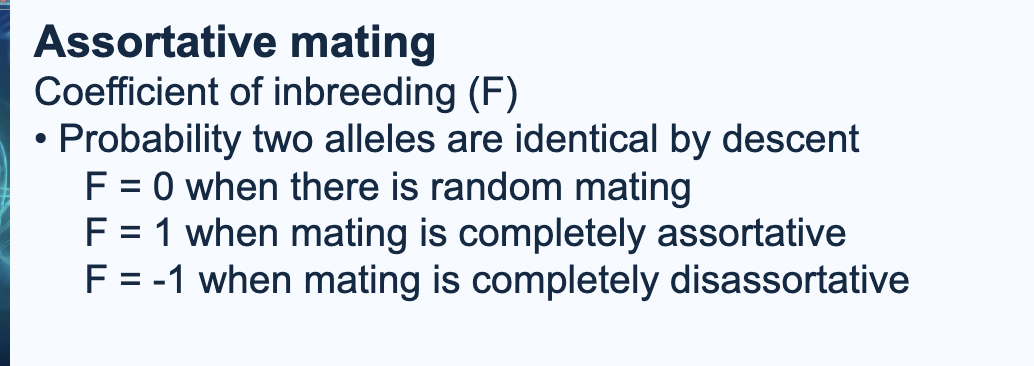
F= -1 (?????)
3 Types of Non-Random Mating
Consanguineous Mating
Inbreeding (Of closely related individuals)
Increases Homozygotes
Increases the chance of inheriting a recessive deleterious allele (harmful allele)
Effect on Inbreeding Coefficient:
F= Greater than 0 (usually 0.25 for sibling-sibling mating)
Coefficient of Inbreeding (F) or Fixation Index.
F is the probability of 2 alleles coming from 1 common ancestor (shared by both parents)
F=1 (COMPLETELY INBRED, FOR MULTIPLE GENS, USUALLY THE CASE FOR CELL LINES)
Large F = Fast elimination of heterozygotes
Inbreeding Depression
Reduced fitness (survival and fertility) due to closely related individuals mating.
Increases homozygotes
Exposes recessive deleterious alleles (harmful alleles) ——> can be lethal
What is hybrid vigor?
Normal mating (genetically different individuals mate)
Heterozygotes increase
Homozygotes decrease
Fitness increases because the deleterious recessive alleles are masked
Natural Selection
Environmental factors create a reproductive advantage of one genotype over another, creating a difference in fitness.
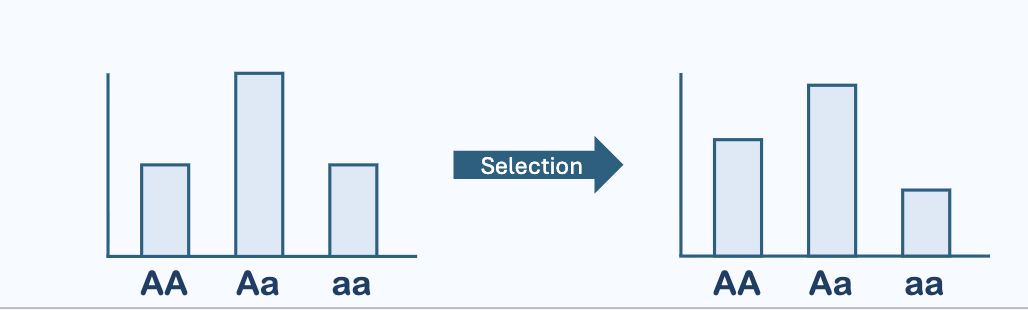
Directional Selection
Selection against one allele
Selection increases frequency of one homozygote relative to the other.
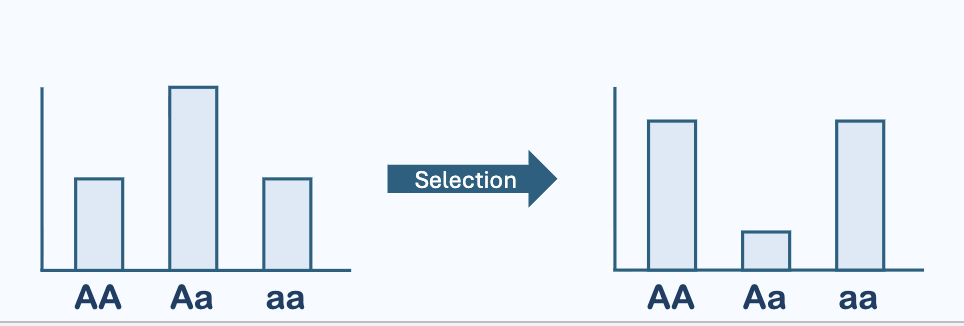
Disruptive Selection
Selection against heterozygotes increases homozygotes.
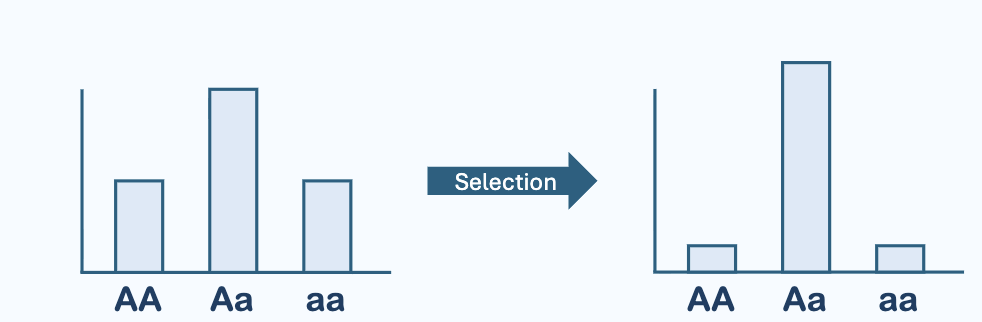
Stabilizing Selection
Selection favors heterozygotes, which decreases homozygotes.
Define Fitness (W).
What is the formula? What does W=1 indicate?
Relative measure of reproductive success for a genotype
“how good genotype is at reproducing”
W=1 BEST GENOTYPE

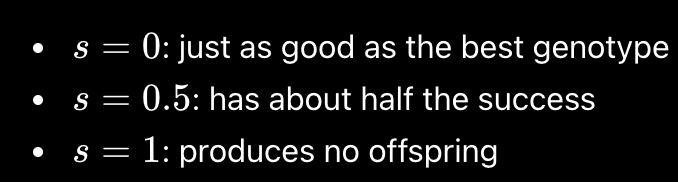
Define Selection Coefficient (s).
What is the equation?
How strongly selection acts against genotype (alleles)
“How much a genotype loses in fitness”
S= 1 - W
Genetic Drift
Small population size —> random fluctuation in allele frequency ——-> causes changes in genotype frequency
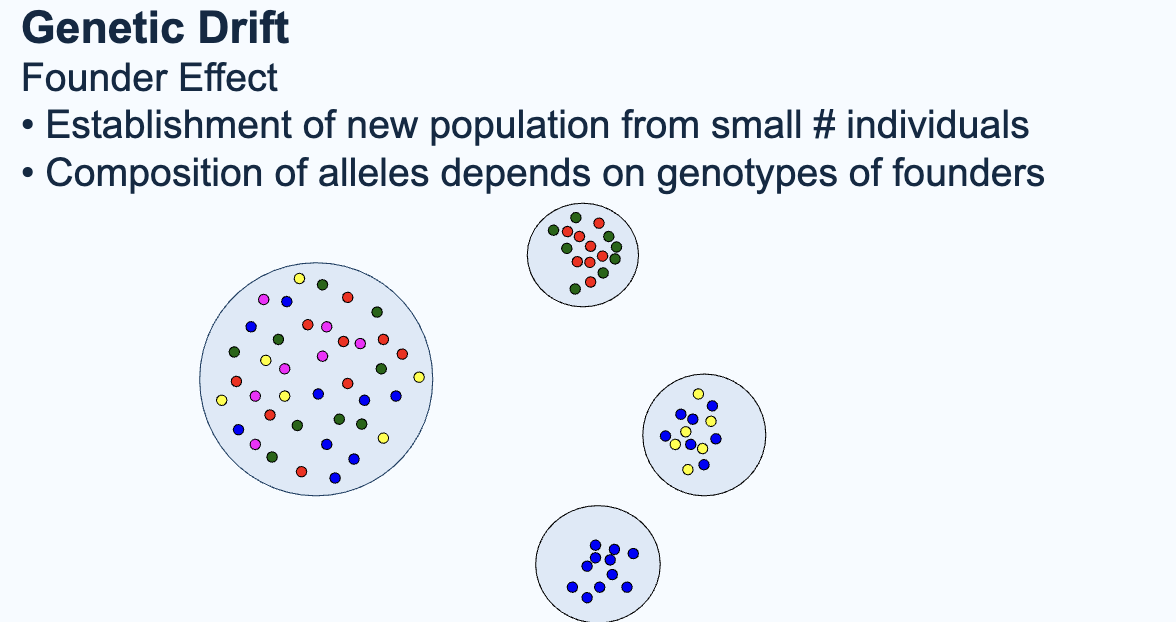
Founders Effect
New population establishes from small # of individuals —> alleles of new pop completely dependent on genotypes of ind that migrated
“When a small group breaks off from a larger population and starts a new population, the new group has allele frequencies that are just a random sample of the original population.”
Bottleneck Effect
Population size is drastically reduced (natural disaster), and many alleles are lost to chance. Causes less genetic diversity in the new population.
Recognize how migration and mutation can increase or maintain genetic variation in a population.
Migration = Alleles move into and out of populations (creates gene flow)—> increases genetic diversity
Mutation = Spontaneous (random) introduction of new alleles ———> Slowly increases genetic variation
Mutations can be lethal, beneficial, or neutral
Not strong driver of allele freq
Eukaryotic Cell Cycle
Comprised of:
Interphase: Cell grows, and DNA is replicated.
Mitosis: Forms identical daughter cells through division.
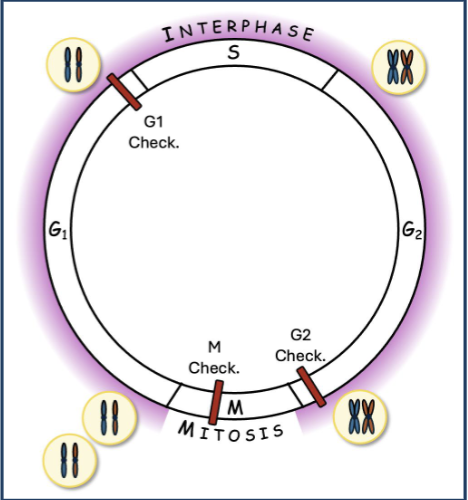
Identify the checkpoints in Eukaryotic Cell Cycle.
G1: Cell grows
Each cell has one chromatid per chromosome.
G1 CHECKPOINT:
S: DNA synthesis.
G2: Cell grows
Each cell has two chromatids per chromosome.
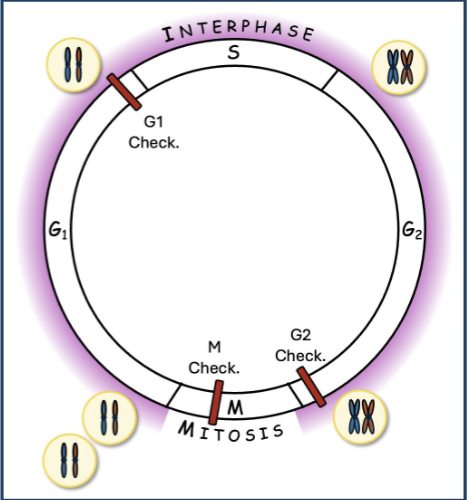
How is Eukaryotic Cell Cycle regulated?
Checkpoint Proteins: prevent continuation if there is DNA damage.
Cyclins: Activate CDKs (cyclin level rises and falls)
Cyclin-Dependent Kinases (CDKs): CDKs phosphorylate proteins that activate M or S phase.
Cancer Cells
Have loss of cell regulation
Explain how loss of cell cycle regulation results in cancer.
Cancers fail to regulate the cell cycle:
Rapid Division
Lack Inhibition
Cancer Cell Developmental Stages:
What is a primary tumor? What is a secondary tumor (METASTASIS)?
Primary Tumors: Original region where cancer cells divide + replicate
Benign: Abnormal cells that divide continuously (non-cancerous)
(Metastasis) Secondary Tumor: Cancer cells invade other cells in other tissues (malignant).
Relate stages of cancer cell development to the multigene model.
Multigene Model: Several mutations accumulate over time in different genes to develop cancerous cells.
Causes of Somatic Cell Cancer: ________
Consequences of mutations in Somatic Cells: _______
Causes of Gametic Cell Cancer: ________
Consequences of mutations in Gametic Cells: _______
(*Use genetic predisposition)
Causes of Somatic Cell Cancer: Random (stochastic) damage occurs over time in somatic cells (body cells)
Consequences of mutations in Somatic Cells: Can lead to cell death, abnormal cells, or cancer (if multiple mutations occur in same cell)
Causes of Gametic Cell Cancer: Replication error in cell division
Consequences of mutations in Gametic Cells: Heritable mutations that will be found in offspring. Genetic predisposition for certain cancers, which increases risk in offspring due to genetic makeup.
Oncogene
Mutated genes that make cells divide excessively
(Promote cell division)
Proto-oncogene
A normal gene that controls cell regulation, growth, and division.
Explain different ways to get gain-of-function mutations in proto-oncogenes.
Gain-of-function mutations in proto-oncogenes create oncogenes.
3 Different Ways to get Gain-of-Function:
Altered transcriptional regulation > too much protein
Tandem duplications > too much protein
Amino acid change > hyperactive protein
Define Tumor Suppressor Genes. What is the significance of a loss-of-function mutation?
Normally prevent advancement through the cell cycle if there is damage. (INHIBIT CELL DIVISION)
Loss-of-function mutations cause tumor suppressor genes to lose ability to control cell cycle
= Rapid cell division of damaged cells = inc risk of cancer
Recognize different types of proteins that can act as oncogenes.
Growth factors: Signals that tell cells to grow and divide
Receptors: Receptor always on and continue dividing
Signaling proteins: Continuous division signal
Transcription factors: Turn on growth genes
Cell cycle activators: Cyclin, CDKs, uncontrolled division
Discuss how impaired epigenetic mechanisms, chromosomal rearrangements, and viral infection might contribute to cancer.
Epigenetic Gene Regulation: Can alter DNA Methylation and histone modification which leads to loss of cell cycle regulation
Chromosomal Alterations: Deletion, inversion, translocations.
Deletions can remove tumor suppressor genes
Viral Infection: Viral DNA can integrate into host DNA, which can cause rapid cell division.