Chapter 6: Scatterplots, Association and Correlation
 Call Kai
 Learn
Learn Practice Test
 Spaced Repetition
 Match
Match Flashcards
 Knowt Play
1/31

There's no tags or description
Looks like no tags are added yet.
Name | Mastery | Learn | Test | Matching | Spaced | Call with Kai | Chat |
|---|
No analytics yet
Send a link to your students to track their progress
32 Terms
Scatterplot
Showing relationship between 2 quantitive variables
Ideal way to picture associations between two quantitative variables
Example where a scatterplot could be used:
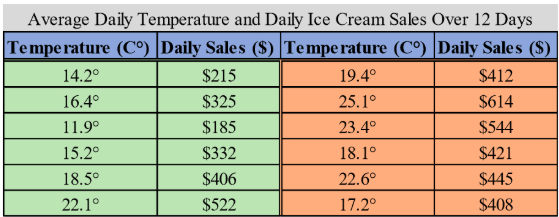
Average daily temperature and daily ice cream sales over 12 days
Scatterplot direction of the association - Negative
Runs from the upper left to the lower righ

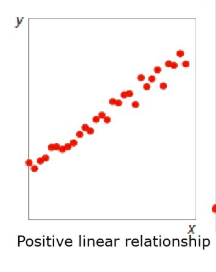
Scatterplot direction of the association - Positive
Running from the lower left to the upper righ

Positive linear relationship
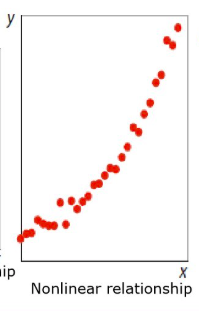
Nonlinear relationship
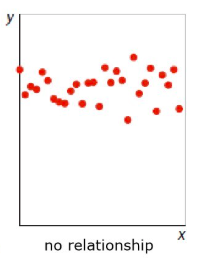
No relationship
There's no correlation between X and Y
Scatterplot - Form
Is it straight, curved, something exotic, or no pattern?
If there is a straight-line relationship, it will appear as a
cloud or swarm of points stretched out in a generally
Linear form
Consistent, straight form
Scatterplots. -Strength
How much scatter?
The more scattered = the weaker the relationship between X and Y
The less scattered = the stronger the relationship between X and Y
Scatterplots - The unexpected
Are there unusual observations or subgroups?
An outlier is an unusual observation, standing away from the overall pattern of the scatterplot
Correlation Coefficient (r)
Measure that describes the direction and strength of a linear assocation
What is the unit of correlation coefficient?
Unit-less
What are possible values of the correlation coefficient and what do they indicate
-1: Strongest negative linear association
0: No linear association
1: Strongest positive linear association
Sample correlation coefficient (𝑟) is computed as
N = number of data points
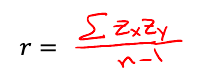
Two of the more common alternative formulas for
correlation are
N = number of data points

Covariance
An alternative to the correlation coefficien
Depends on the unit of measurement
Good for direction but not strength
Covariance is NOT unit-less
Associations
Change in the value of one variable associated with change in the value of the other variable
Bivariate analysis
Investigation of 2 variables
To make a scatterplot of two quantitative variables, assign
one to the y-axis and the other to the x-axis
Coordinates (x,y)
Explanatory or Predictor variable
X-axis (independent)
Response variable
Y-axis (dependent)
Correlation
Measures the strength of the linear association between two quantitative variables
Quantitative variables condition
Correlation applies only to quantitative variables
Linearity Condition
Correlation measures the strength only of the linear association
Outlier Condition
Unusual observations can distort the correlation
Correlation Properties
Correlation is always between −1 and +1
Correlation treats x and y symmetrically
Correlation has no units
Not affected by changes in the center or scale of either variable.
Example of a change in scale
Change in currency (ie converting from CAD to USD)
CAD --> USD = You can either multiply or divide 1
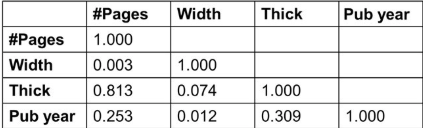
Correlation Table
Compact and give a lot of summary information at a glance.
Example of a correlation table for Amazon books
Correlation ≠ Causation
Two variables may be correlated but that does not mean there is a causal effect between them
Example that Correlation ≠ Causation
Poverty rates causes crimes to go up
It might be correlation not causation
Lurking variables
It is not included in the original analysis but affects the outcome.
Example of a lurking variable
Increased sales of ice cream and the number of deaths by drowning
Lurking variable (that feeds into both): Temperature
Positive correlation