Measures of Central Tendency
1/21
There's no tags or description
Looks like no tags are added yet.
Name | Mastery | Learn | Test | Matching | Spaced |
|---|
No study sessions yet.
22 Terms
mean
average
median
middle number
mode
number that appears most frequent
range
difference between the highest and lowest values in a data set
how to calculate mean
add up all the numbers in the data set and then divide by the total amount of numbers in the data set
how to calculate median
order the numbers in the data set from least to greatest, cross out each number on both ends until you find the middle number. If there’s 2 middle numbers add them together and then divide by 2.
how to calculate range
subtract the smallest number from the data set of the greatest number of the data set
pros: mean
Uses all data points
cons: mean
Sensitive to outliers
pros: median
Resistant to outliers
Appropriate for skewed data
cons: median
Doesn’t use the magnitude of all values
Less stable than the mean for symmetrical data
pros: mode
The only measure for categorical data
Unaffected by outliers
cons: mode
Can be far from the center
May not exist
mean is best used for
Symmetrical Distributions
All numerical data where outliers are not a concern (eg: heights)
median is best used for
skewed distributions (eg: income, house prices)
mode is best used for
Categorical data (eg: favourite colour, most popular product)
numerical data to find the most common value
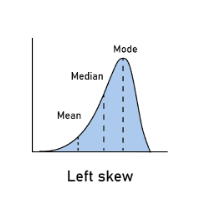
left skew (negative skew) example
age of death
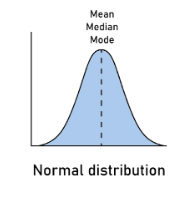
normal distribution (symmetrical) example
height
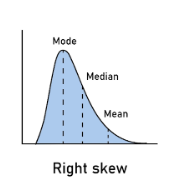
right skew (positive skew) example
household income
symmetrical data =
no outlier
positive skew =
high outlier
negative skew =
low outlier