distribution curves, levels of significance and probability, type 1 and type 2 errors
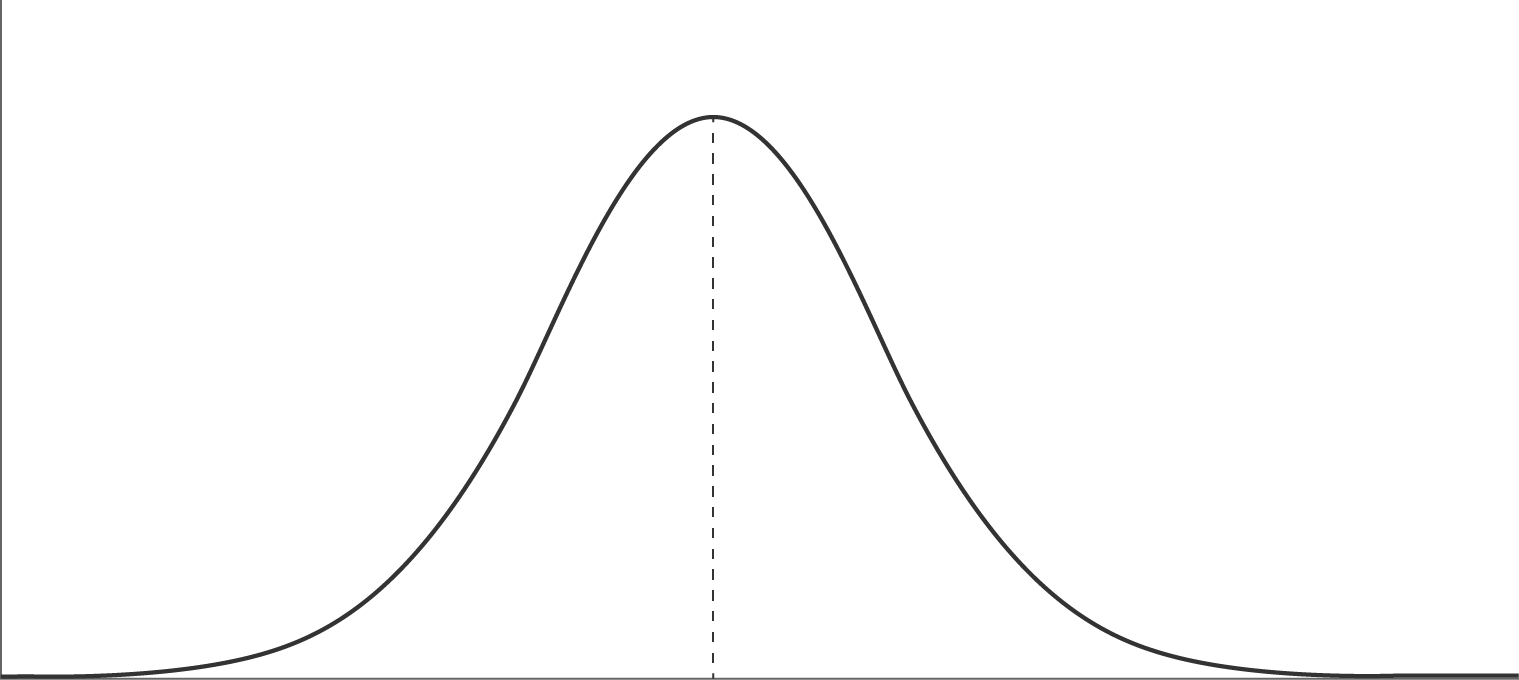
what kind of distribution curve is this
normal distribution curve
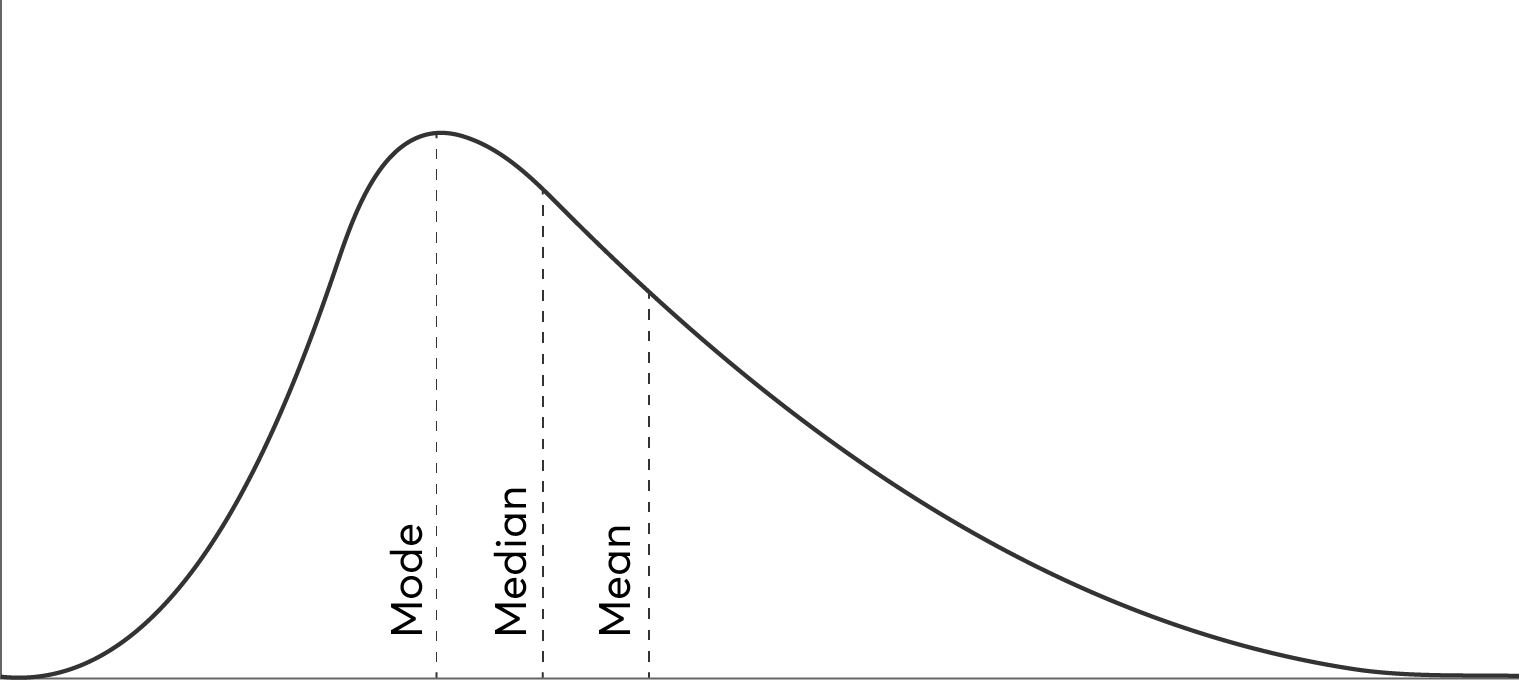
what kind of skewed distribution is this
left skew/negative distribution
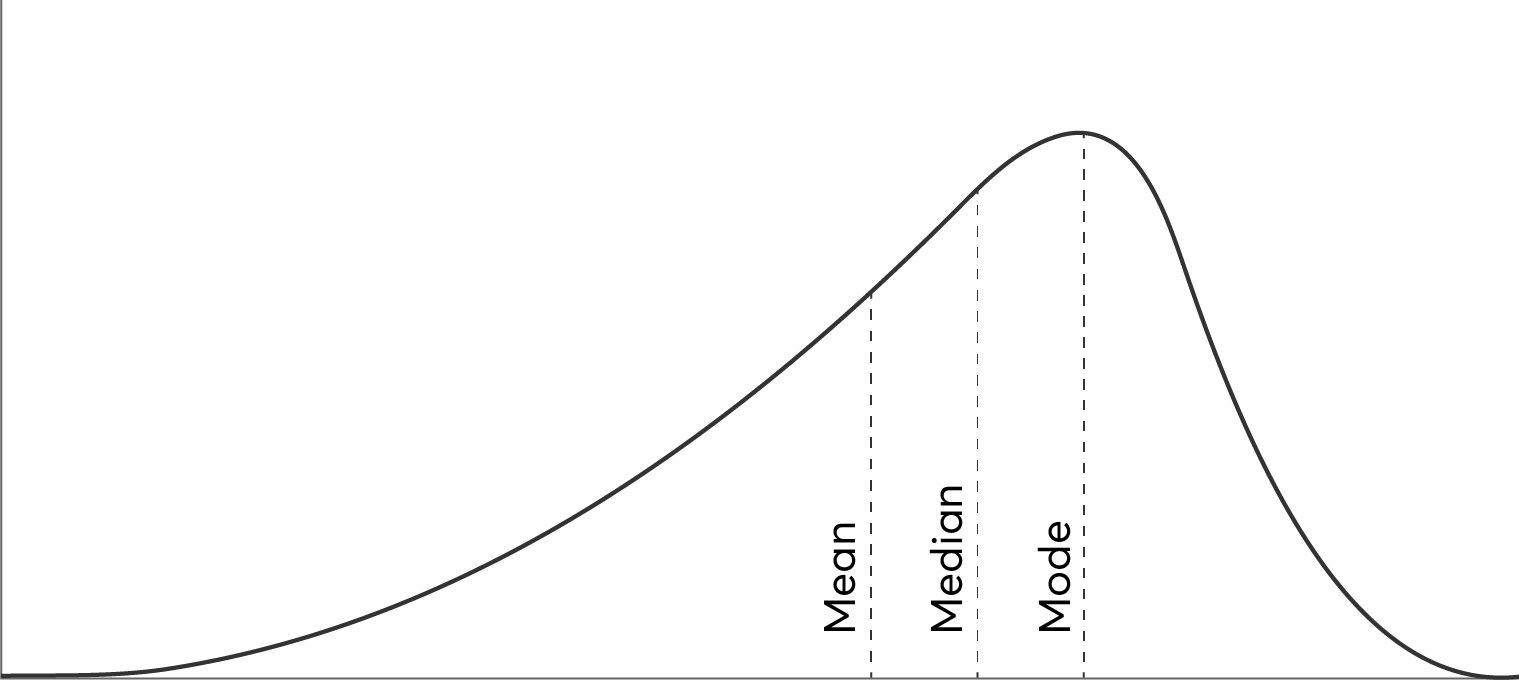
what kind of skewed distribution is this
right skew/positive distribution
what is the mode
the most frequent score
what is the median
the middle point in the data
what is the mean
adding all the data and dividing by how many scores there are
what does probability mean in psychology
the likelihood that the pattern in the data could be due to chance
by assessing the probability…
…we can determine the significance of the results
high significance
low probability
high probability
low significance
type 1 error
false positive
what hypothesis is rejected but correct in a type 1 error
null hypothesis
what hypothesis is rejected but correct in a type 2 error
directional hypothesis
type 1 error
false positive
type 2 error
false negative
what error happens when the probability is too strict
type 2 error
what error happens when the probability is too lenient
type 1 error
68% of participants
percentage of participants that are within 1 standard deviation of the mean
95% of participants
percentage of participants within 2 standard deviations of the mean
99.7% of participants
percentage of participants within 3 standard deviations of the mean
two requirements of parametric tests
normal distribution, interval data