Macro - Topic D : The long run
1/22
Earn XP
Description and Tags
Name | Mastery | Learn | Test | Matching | Spaced |
|---|
No study sessions yet.
23 Terms
SR vs MR vs LR
SR - business cycles
MR - Revert to norm
These are dominated by shocks & policy
LR - K accumulates + tech change dominates
Very LR - tech change dominates even more
Neoclassical growth model (with tech progress) assumptions
Assume L augmenting tech progress - As tech improves it makes L more productive
Constant RtS
Diminishing returns to inputs (K / AN)
State of technology
A
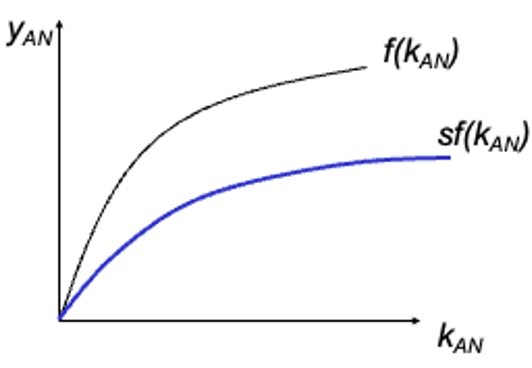
Output per unit of effective L
Y / AN = F (1/AN * K , 1) → yAN = f(KAN)
Savings and MPC
S = 1 - MPC
I, S and Output → kAN
I = S = sY
I / AN = sY/AN
I / AN = syAN
iAN = sf(KAN)
Inflow of K per effective L (+∆kAN)
iAN = sf(KAN)
Output per effective L graph
K, AN increase over time
A, N growth exogenous - but constant
K growth endogenous
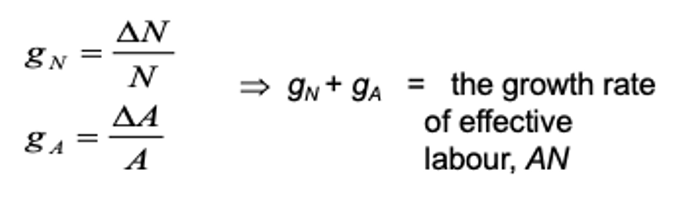
Effective L
AN
Growth rate of effective Labour
Investment needed to maintain a constant level of K per unit of effective worker
(δ + gN + gA) kAN
Every time period some tech wears out (at a constant rate)
Outflow of capital per effective worker (-∆kAN)
dAN = (δ + gN + gA) kAN
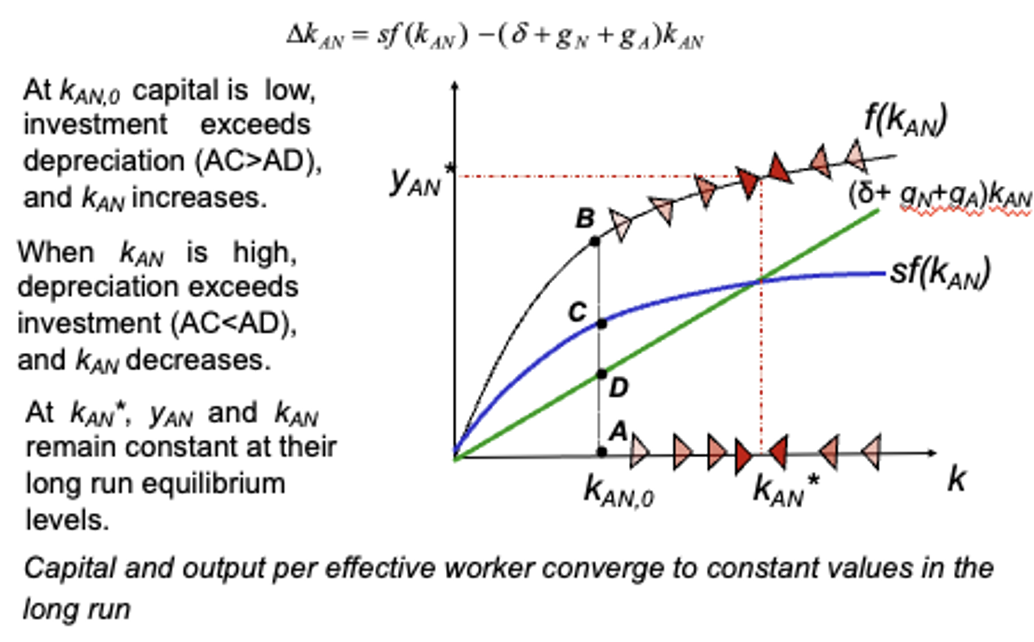
Dynamics of capital
Blue line = inflows & Green line = outflows
In equilibrium K/AN ratio constant → If not at equilibrium it will converge
Model shows us countries have different per capita incomes due to varying savings rates
K & Y per worker in steady state
They both grow at the rate of tech progress (ga)
yAN = Y/AN = y/A → gyAN = gy - ga
In steady state gy*AN = 0 → gy = ga
What affects the steady state?
Savings rate increase
Growth rate of tech progress (ga) changes
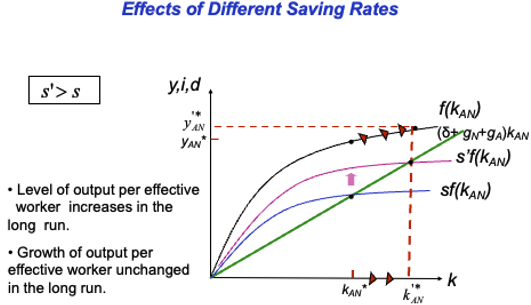
Savings rate increase
s’ > s → K inflows increase → K/AN (kAN) increase → line shifts
Level of output per effective worker increases in LR → higher growth until economy reaches new steady state (same growth rate)
Growth of output per effective worker unchanged in LR
Crowding in
Increased government spending or investment leads to greater private sector investment → I increases
due to spare capacity + confidence boost + complementary public I
In LR this increases Y
Growth rate of tech change / progress changes (gA)
SS shocks cause this
ga > g’a → Outflows of K slow → K/AN rise → gradient shallower
Level of output per effective worker increases in LR → higher growth unti; economy reaches new steady state (same growth rate)
Growth of output per effective worker unchanged in LR
Growth of output per worker falls
Limitations of LR model
Model doesn’t explain what are the determinants of the technological progress (ga exogenous)
Doesn’t explain lack of convergence in poorest economies
Suggests that differences in per capita income are due to differences in K.
In practice H & A important
Productivity is absent from model
Determinant of tech progress
R&D spending
What does spending on R&D depend on
The fertility of the research process
The appropriability of research results
The fertility of the research process
how spending on R&D translates into new ideas and new products
The appropriability of research results
the extent to which firms benefit from the results of their own R&D