BUSS1040 Lecture 6 - Monopoly
1/16
There's no tags or description
Looks like no tags are added yet.
Name | Mastery | Learn | Test | Matching | Spaced |
|---|
No study sessions yet.
17 Terms
Characteristics of Monopoly
single seller (high concen)
no close substitutes
unique product
barriers to entry
legal barriers
exclusive rights over a goods prod (patent, copyright)
public franchise (aus post), govt licenses (taxis, practice of med)
Why do monopolies exist?
natural barriers to entry
control over essential input not available to other firms
e.g Esso and gas fields in Victoria
monopolist might have lower COP that effectively allows them to prevent other firms entering
favourable access to raw materials, geographic location, learning curve advantages
Tech/level of d make one producer more efficient than a no. of producers — natural monopoly
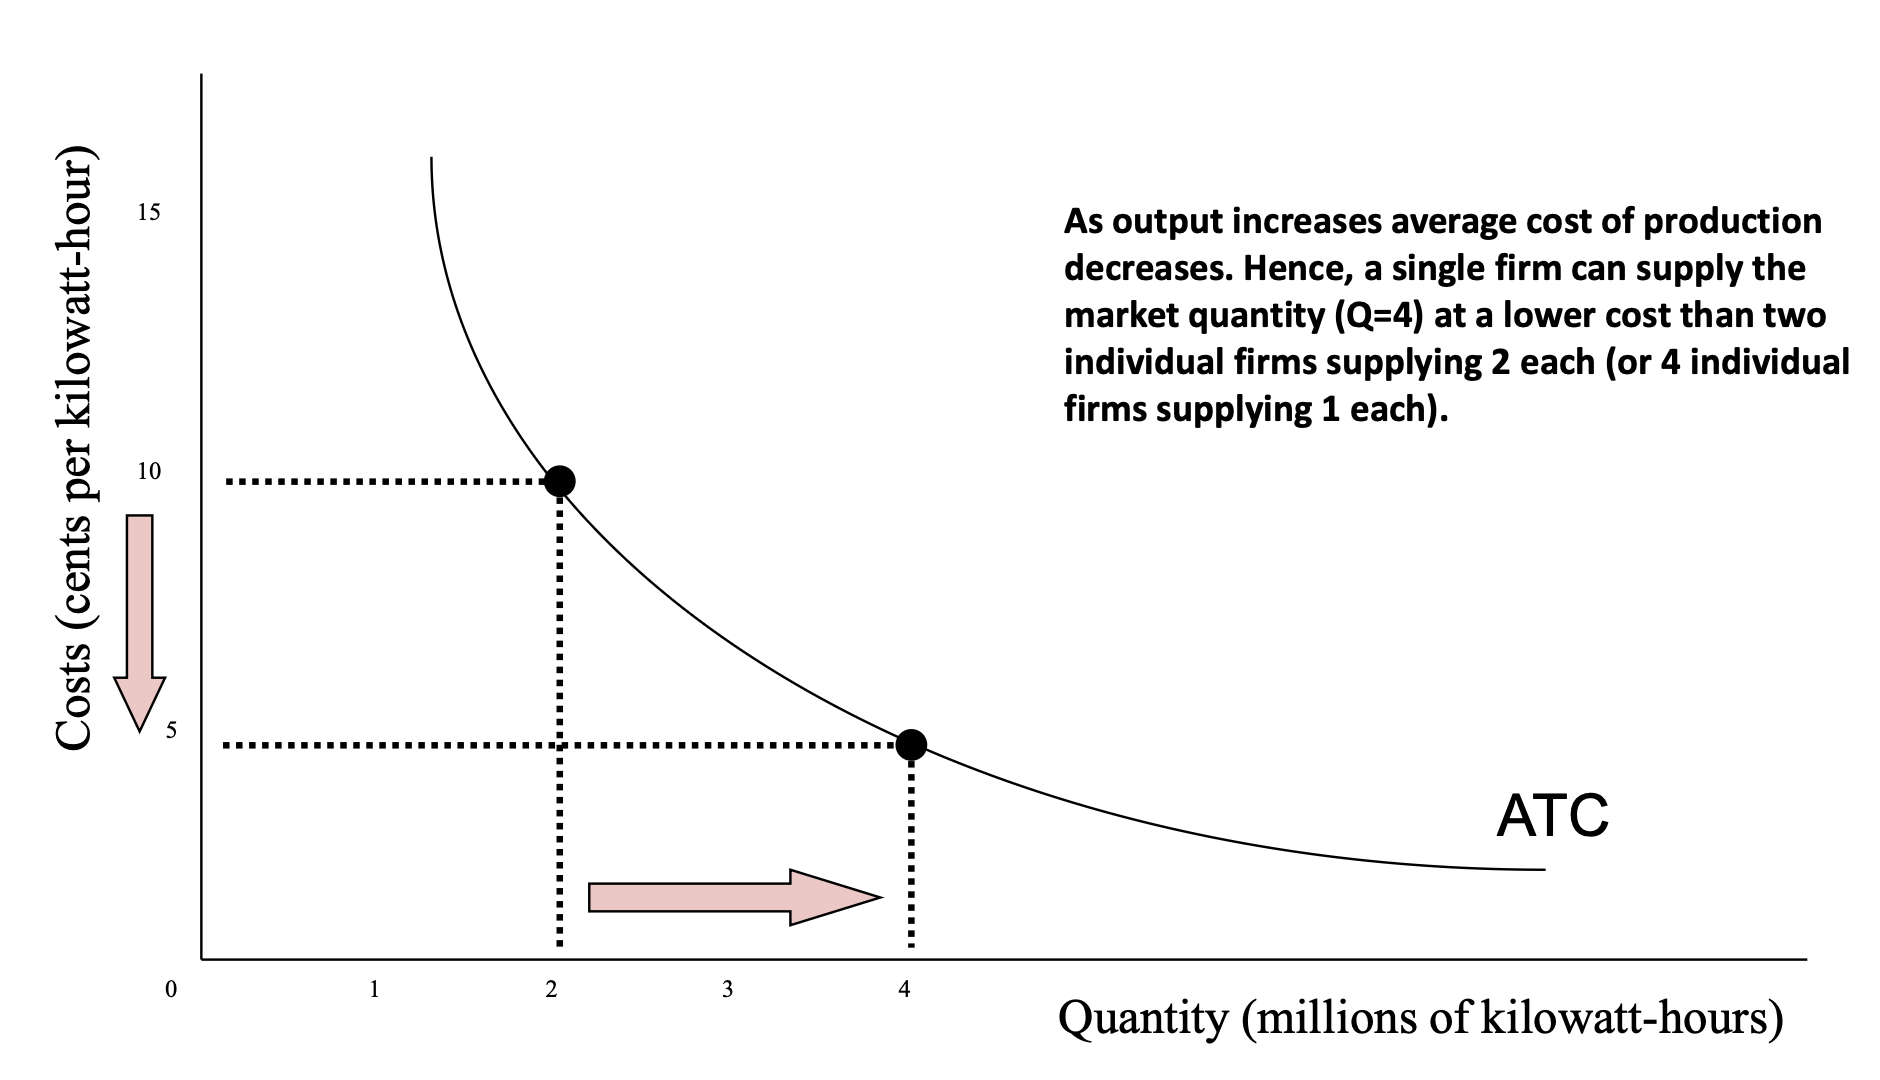
Natural monopoly
single firm can supply an entire market at lower cost than 2/more firms could supply
e.g. telecomms, electricity, tap water
declining LR ATC implies natural monopoly
substantial EOS (natural barrier to entry)
often larger capital costs (infra) but low marginal cost of supply
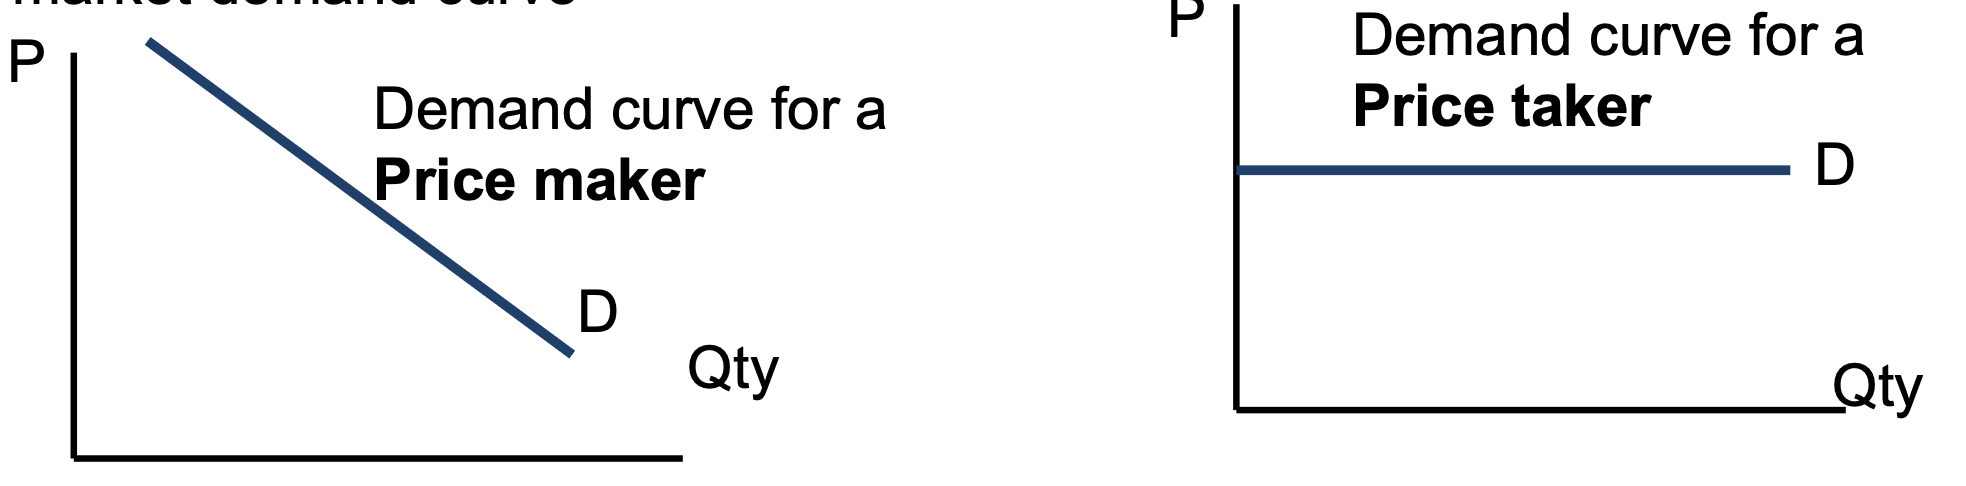
Price taker/maker
since only one single seller — monopolist can decide p of their product to max profit
d curve for monopoly same as market curve as only 1 seller
monopolist is the price maker hence d curve for monopolist is downward sloping
Monopoly market power
firm that has low PED for output can raise p and not lose customers
Monopolist’s output and pricing decision
single price monopolist — charges same p to all its consumers
will choose output to max total profits = TR - TC
can alter p in the market by changing q
downward sloping d curve
if increase output by one unit — p will fall by some amt
if prod more — p falls
if prod less — p rises
causes trade off
sell less q for higher p or sell more q for lower p
Monopoly MR
MR — additional rev from one extra unit of g sold
for monopolist — MR has 2 effects
output effect
as sell more units, extra rev obtained from add units sold
price effect
sell more units, p fall and rev lost on existing units sold
MR is not the same as market P (always below p)
Elasticity for MR and D curve
slope of MR curve is x2 value of D curve and has same intercept
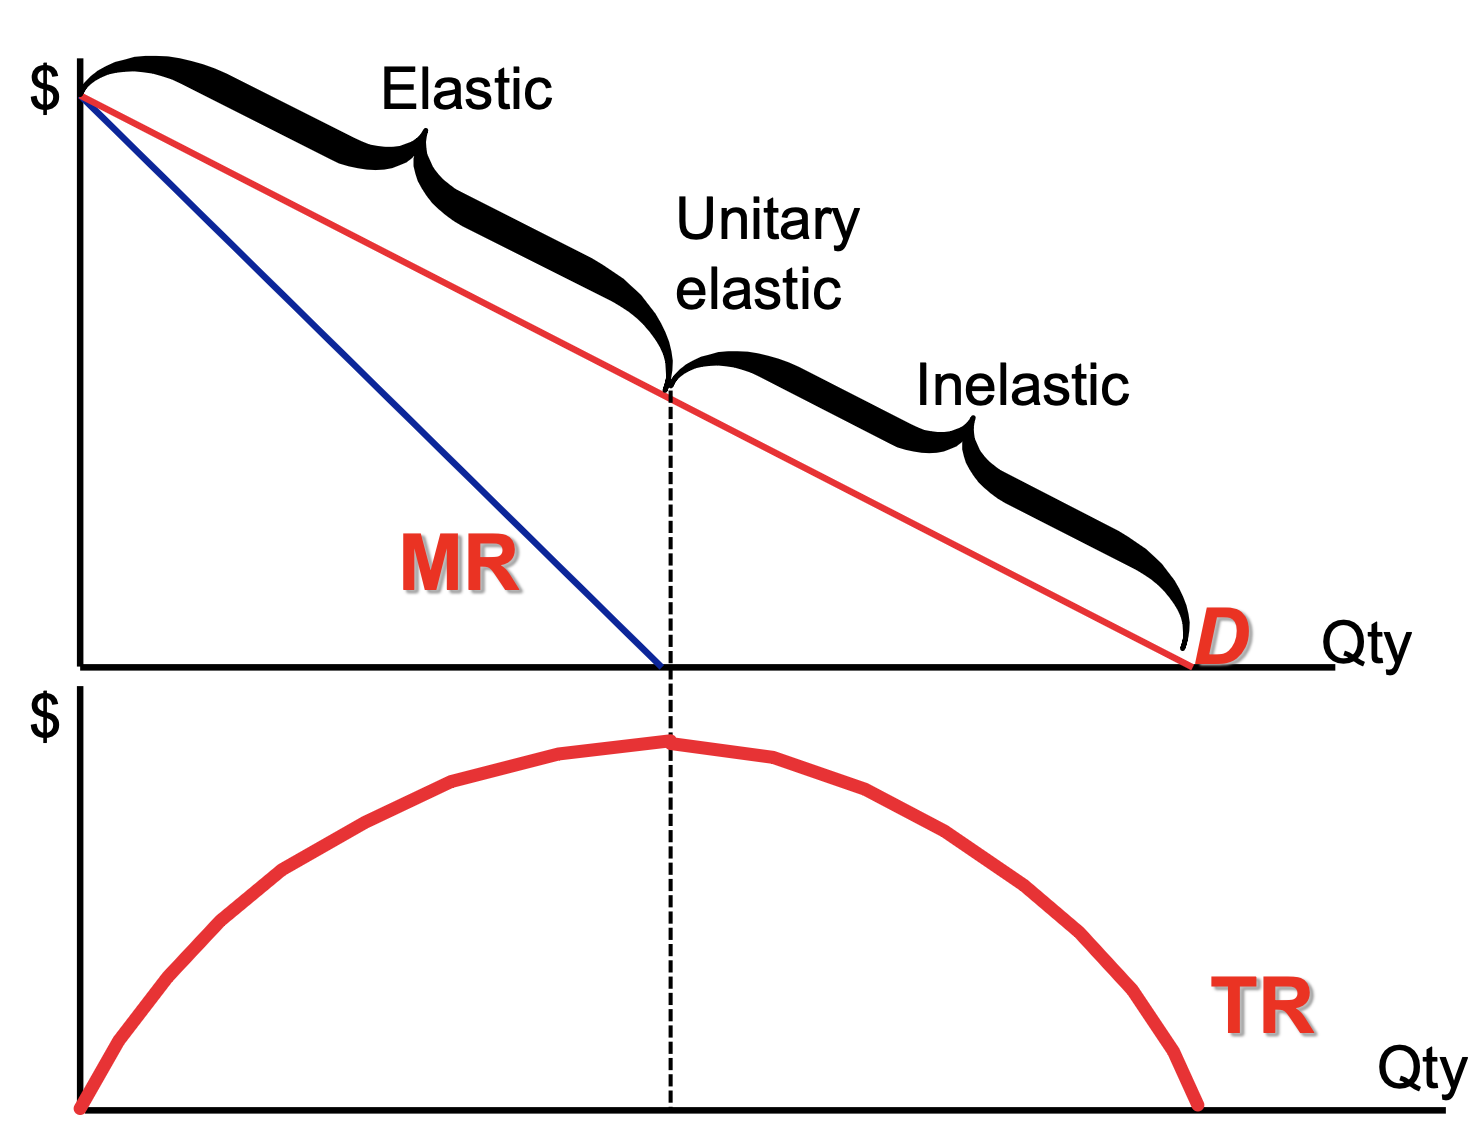
when d is elastic — small decr in p leads to large incr in qd
TR increase — MR is positive
when d is inelastic — small decr in p leads to small incr in qd
TR decrease — MR is negative
profit max monopolist would never prod at output in inelastic region of d curve
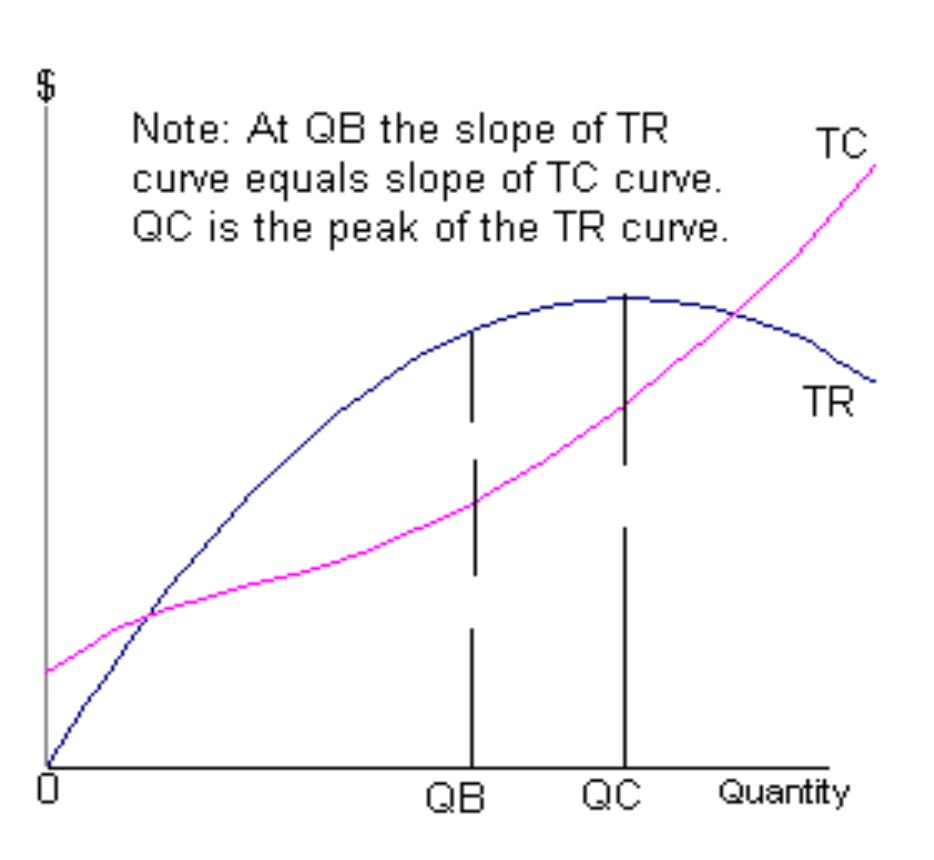
TR and TC curve
profit max is at QB where diff between TR and TC is greatest
TR is concave and upward sloping from 0 to Qc and downward sloping from Q onwards
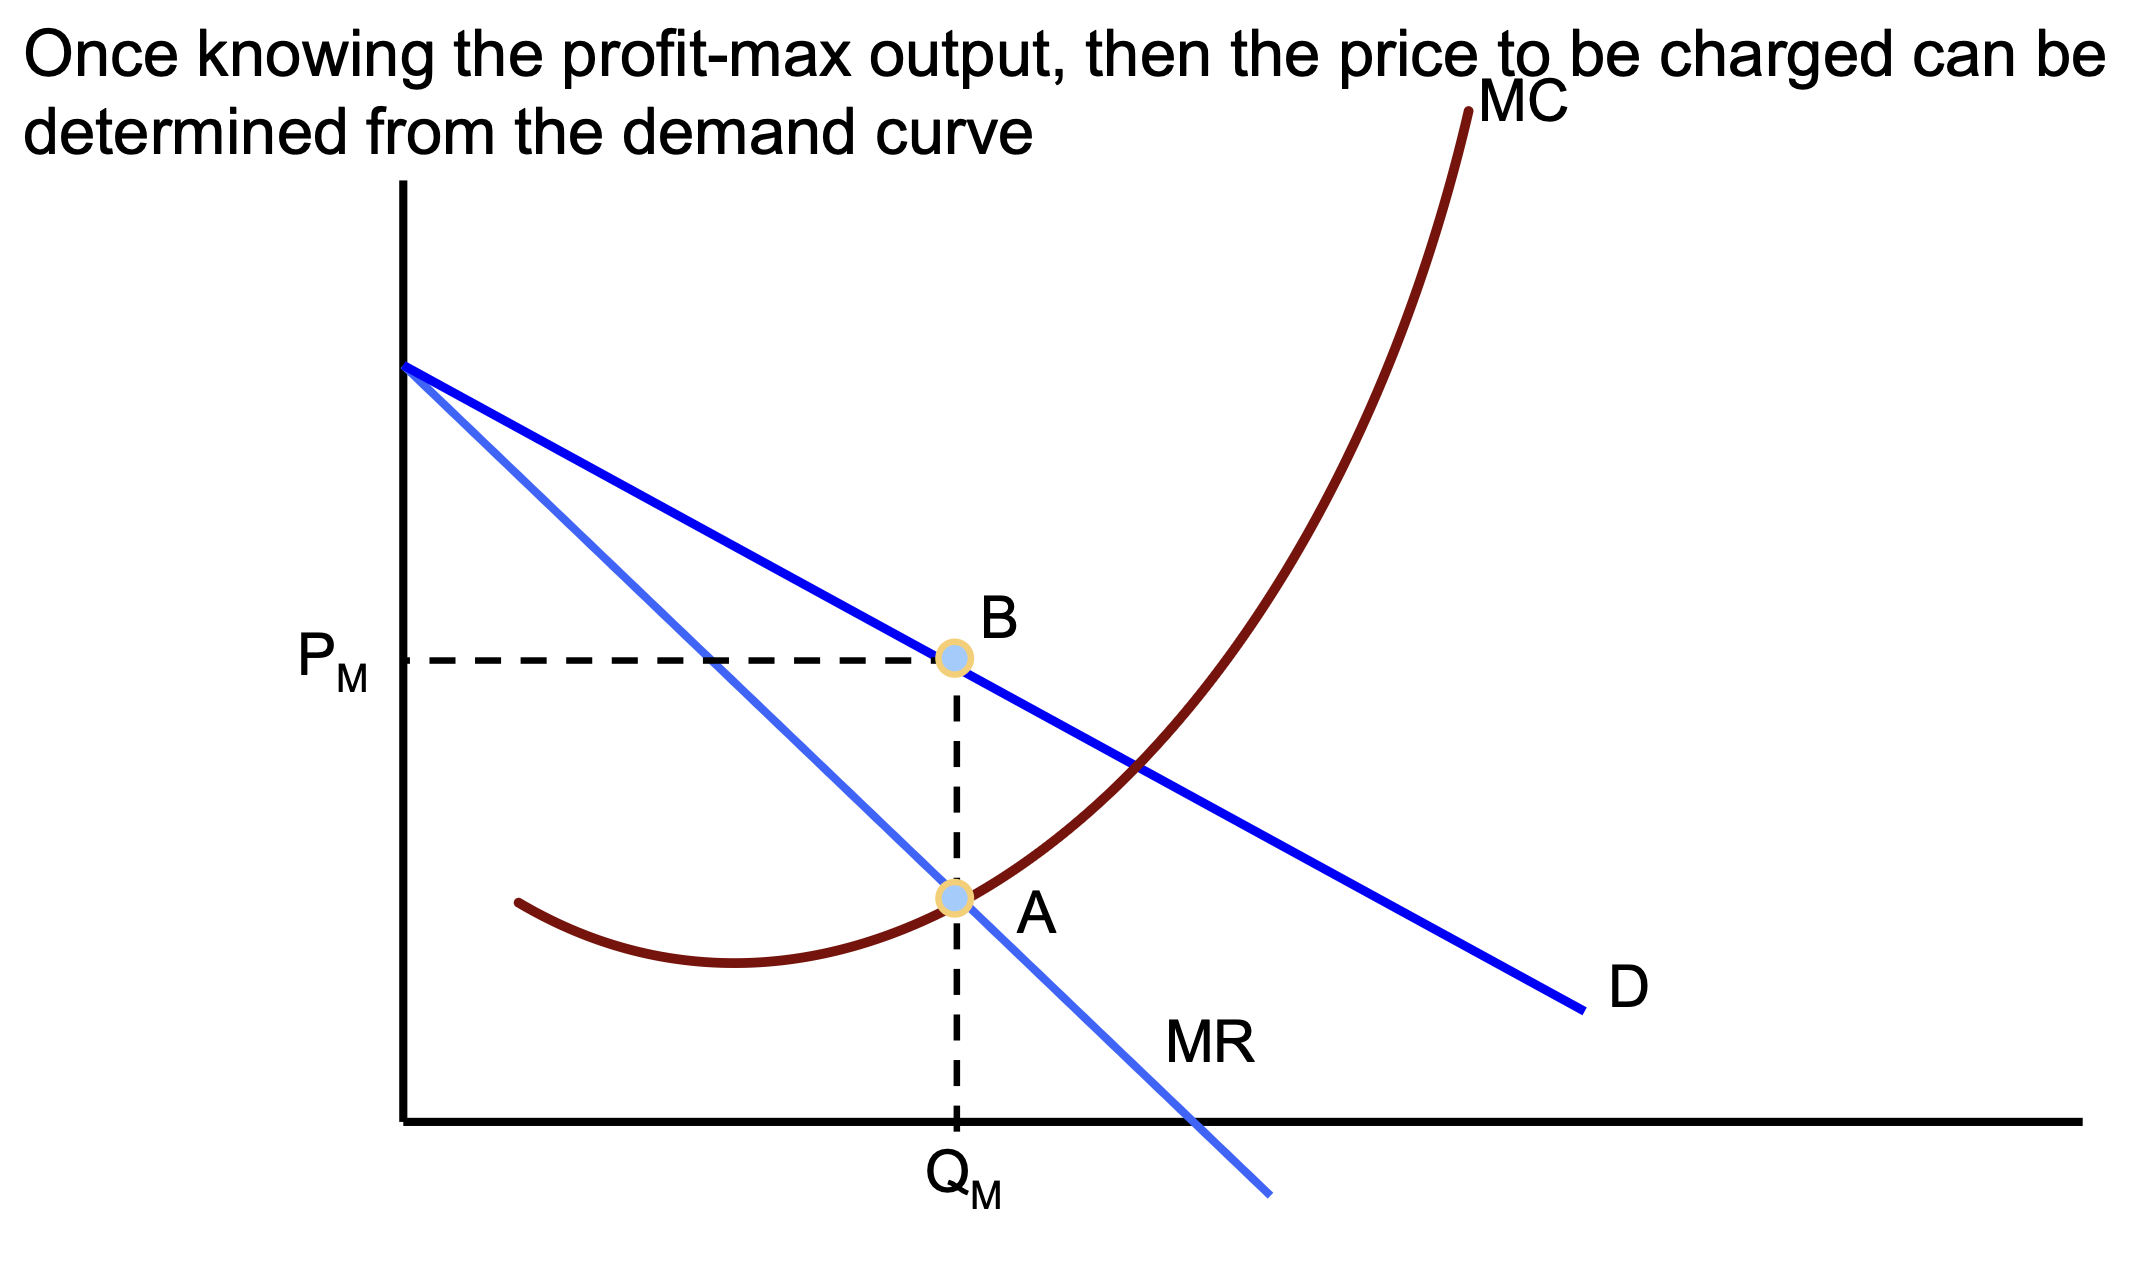
Profit max MR = MC
if MR>MC — monopolists can increase profits by selling 1 extra unit
if MR<MC — profit fall from selling last unit so better off not selling
for a competitive firm — P = MR = MC
for a monopolist — P > MR = MC
for a single price monopoly P > MC at optimal qty supplies
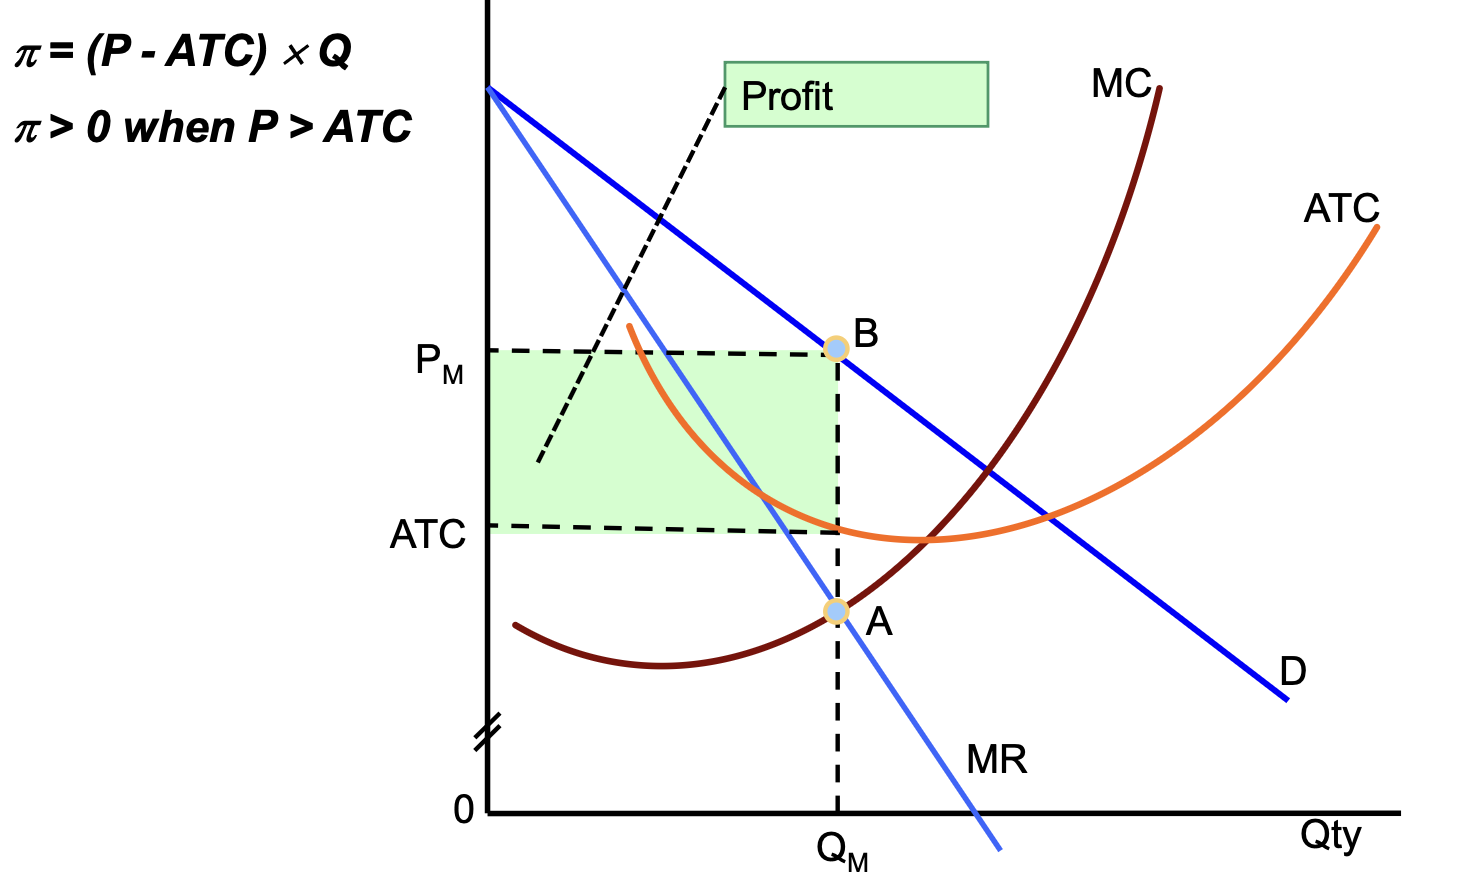
Economic Profits
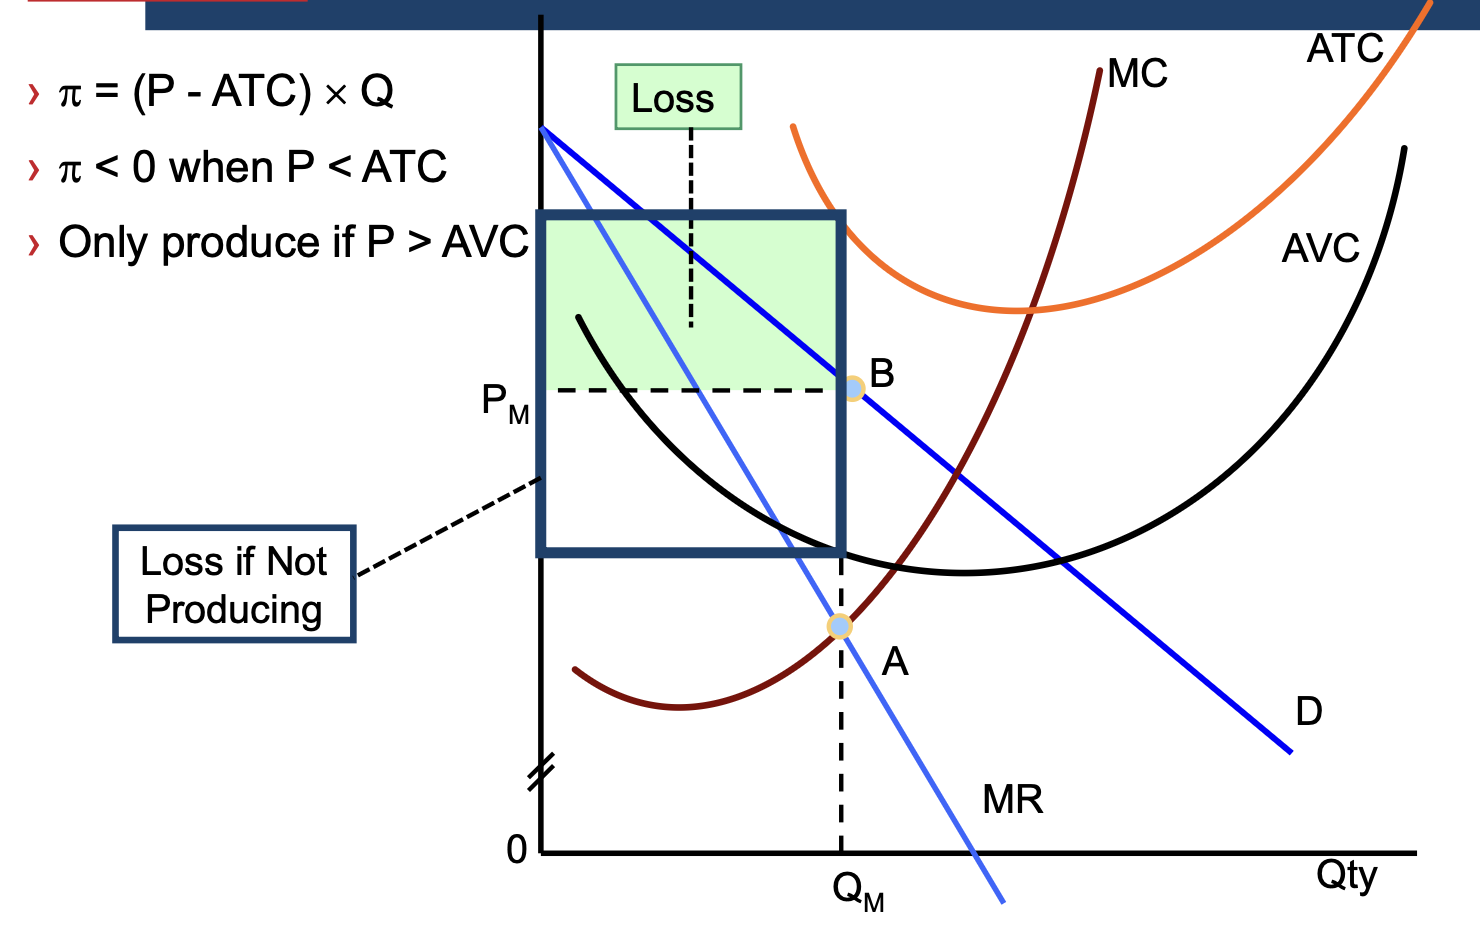
SR loss minimisation
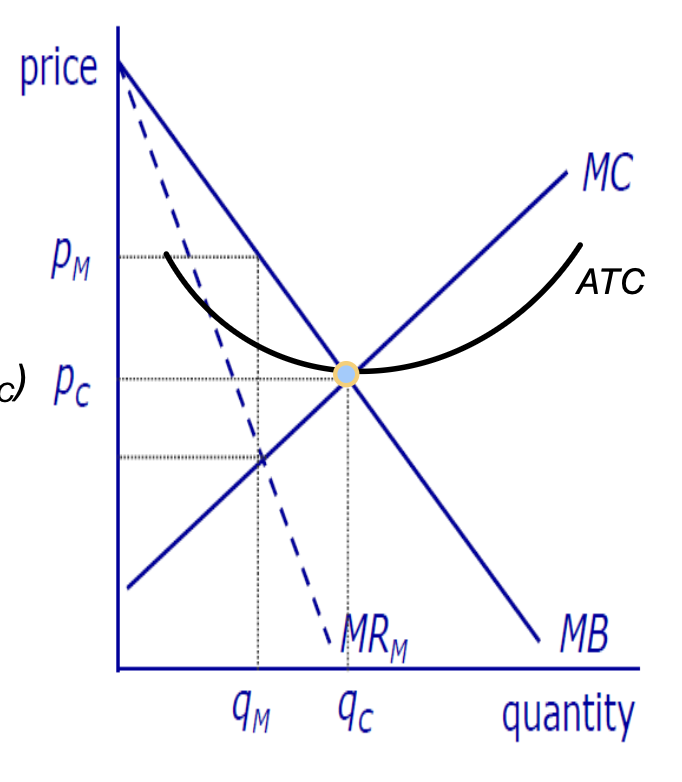
Economic effects of monopoly
If perfect comp industry becomes a monopoly (assuming same cost curve and no EOS)
monopolist charges higher p (pm) and produces smaller qty (qm) compared to competitive indus (pc,qc)
Welfare Analysis of monopoly on graph
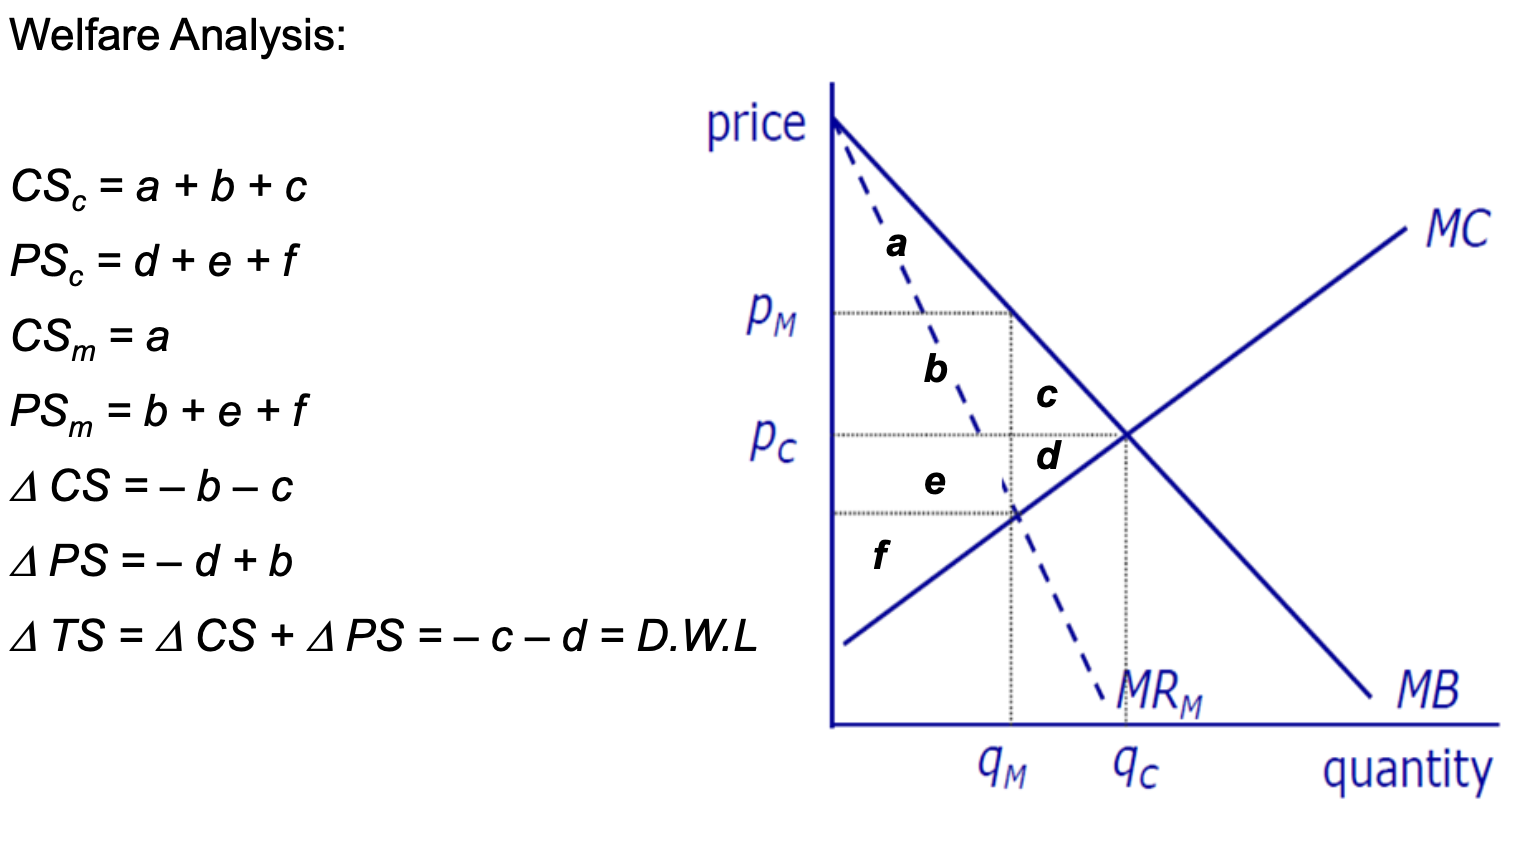
Welfare w monopoly
at competitive qty — all gains from trade exhausted
all potential trades where MB>=MC occur
However monopolist restricts output to Qm<Q*
between Qm and Q* MB>MC so total surplus will increase
but monopolist interested in own profit which is determined by MR not MB
surplus lost from the restriction of output — DWL
occurs because restricted output below the competitive level
Rent seeking behaviour
activity of trying to obtain a monopoly to earn economic profits
firm is willing to spend up the monopoly profit to obtain a monopoly
buying a monopoly — taxies, import quotas
creating a monopoly — lobbying
creating barriers to entry — advertising
Are monopolies that bad?
EOS and scope
may prod at lower avg cost
incentives to innovate
monopolies provided by IPRs may provide an incentive to engage in R&D activities — e.g patents & copyright