NEW 2.1 MEASURES OF ECONOMIC PERFORMANCE
1/26
There's no tags or description
Looks like no tags are added yet.
Name | Mastery | Learn | Test | Matching | Spaced | Call with Kai |
|---|
No study sessions yet.
27 Terms
GROWTH
REAL GDP
NOMINCAL GDP
REAL GDP PER CAPITA
GROSS NATIONAL INCOME
Real GDP - measures the amount of goods and services produced in an economy in a year.
Nominal GDP- the total price of all goods and services produced in an economy.
Economic growth is increase in real GDP.
Nominal GDP increased but Real GDP didn’t as economy was experiencing inflation.
A decrease in nominal GDP could be caused by lower output or lower prices.
An increase in nominal GDP could be caused by an increase in output or increase in prices (deflation).
Real GDP growth % = nominal GDP growth% - inflation rate%. - we remove the effects of inflation and changing prices so we are left with just increase in real GDP.
( New nominal GDP - Original nominal GDP ) '/ Original nominal GDP ) x 100
Real GDP per capita = Real GDP per person
Real GDP per capita = The total output produced in an economy in a year divided by the population.
Real GDP / Size of population = Real GDP per capita.
A decrease in the size of the population could lead to an increase in real GDP per capita.
Real GDP can be misleading because it ignores the size of the country’s population, Using real GDP per capita avoids this problem.
Low living standard in China - China has a very high real GDP but a low real GDP per capita.
GNI = Gross national income
GNI = GDP + Net income from abroad
GNI = GDP + (Remittances received - remittances sent )
Remittances = Money earned by workers which is sent home to family in another country.
NATIONAL INCOME = NATIONAL EXPENDITURE = NATIONAL OUTPUT.
Gross national income = gross national output ( stuff we make or produce )
GROWTH
national happiness - Easterlin paradox.
National Well- Being survey
EASTERLIN PARADOX:
As incomes increases, happiness increases up to a point as people are able to afford important items like food and a home. However, the marginal happiness from each extra £ of income then begins to fall as people spend money on things they don’t need and which bring less happiness.
In economics, when we talk about ‘marginal’ we mean one extra unit. So ‘marginal happiness ‘ means the happiness gained from one extra unit of income.
AD INCOMES INCREASE, MAGRGINAL HAPPINESS DECREASES.
MEASURING HAPPINESS
Office for National Statistics uses a national well-being survey, 4 key questions about life satisfaction, anxiety, happiness and worthwhileness.
The ONS national well-being estimate isn’t the most accurate because the answers from people are normative statements as they are based on opinions.
Not all countries focus on increasing real GDP, some countries focus on Gross National Happiness.
Benefit of attempting to increase national happiness instead of Gross Domestic product encourages a focus on improving standard of living.
GROWTH
Purchasing power parities PPP
Two difficulties when comparing nominal GDP data between countries:
Nominal GDP data is usually measured in different currencies. This makes it particularly difficult to compare nominal GDP data as exchange rates are very volatile.
Second difficulty is that nominal GDP does not reflect differences between the price levels in each country. This makes it very difficult to compare as there is no way of knowing what each currency is worth in terms of the number of goods and services they will buy in each country.
-difference currencies, volatile exchange rates
-different price levels, volatile exchange rates.
A purchasing power parity or PPP between two countries tells us how much of one currency is needed to purchase a basket of goods compares to another country.
To avoid the problems outlined when comparing nominal GDP per capita, it is more helpful to use purchasing power parity.
DIAGRAM: If we start from spare capacity, real GDP has not changed but there has been a right shift in LRAS. However, there has been potential growth from YFE TO YFE1 Potential growth but not actual growth.
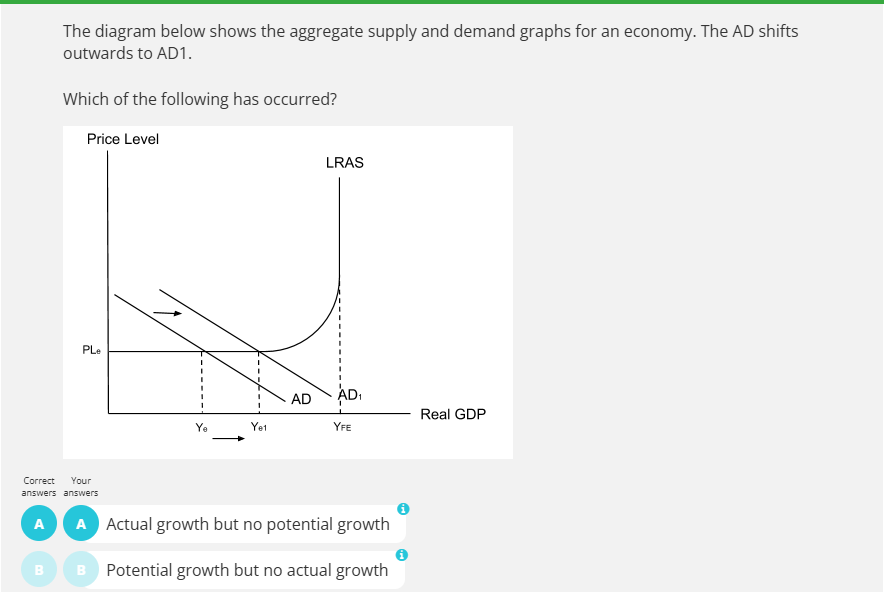
Actual Growth = Real GDP increase.
Potential Growth = Increase in the productive potential in the economy. YFE TO YFE1 potential in the economy to produce more
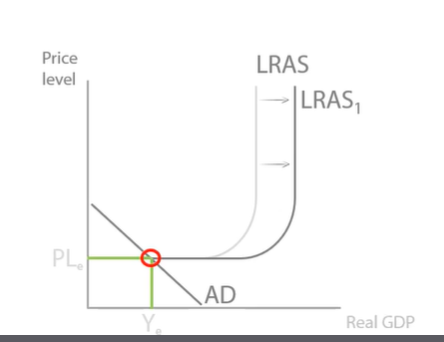
Full employment potential output level remains the same so no potential growth.
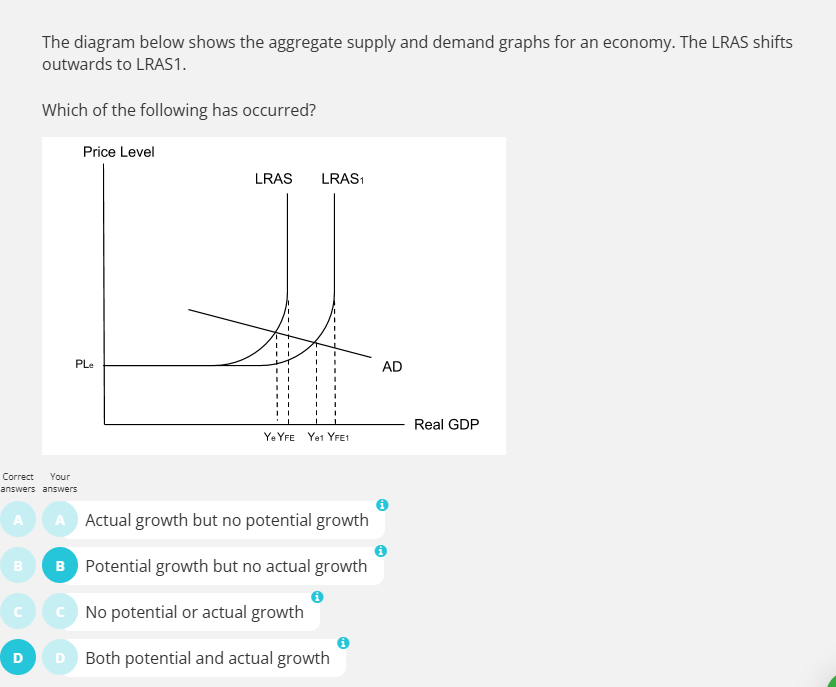
Both potential and actual growth.
Actual growth : LRAS SHIFTS to LRAS 1 , Equilibrium moves from YE to Y1 REAL GDP HAS INCREASED.
LRAS SHIFTED, full employment potential level is higher= potential growth.
PPP between two countries tells us how much one currency is needed to purchase a basket of goods compared to another currency.
Easterin paradox- as income increases, marginal happiness decreases.
Instead of measuring real GDP, leader of an economy may choose to measure gross national happiness.
LIMITATIONS OF GDP
REAL GDP HAS FIVE LIMITATIONS:
IGNORES:
1 population changes
2 incomes distribution
3 types of goods and services
4 underground economies
5 subsistence economies
LIMITATION OF GDP POPULATION CHANGES:
Real GDP does not take into account changes in population
If population is growing faster than real GDP then real GDP per capita will actually be decreasing so everyone will be worse off than the increase in real GDP suggests.
If the population is growing slower than real GDP, then real GDP per capita will be increasing more than the increase in real GDP. Everyone would be worse off than real GDP suggests.
When looking at real GDP when comparing living standards, we need to look at real GDP per capita.
LIMITATION OF GDP: INCOME DISTRIBUTION
Higher incomes not distributed properly .
Limitations of GDP: Types of goods.
Real GDP measures quantity not quality. Does not take into consideration negative externalities produced from goods and services such as death, pollution and heart disease. (1/4 in heart attacks each year from junk food in America) Real GDP increase, living standards fall.
Limitations of GDP: Underground Economy
Real GDP does not measure the illegal activities found in the underground economy. Not accurate measure of goods and services being produced and consumed in an economy. Therefore, can’t measure accurate living standards in the economy.
Limitations of GDP: Subsistence economy.
Limitations of economy: Subsistence economy is made up of people who produce goods to consume themselves rather than sell. This production is not recorded as the goods are not sold. This means real GDP does not measure any of the goods and services produced in the subsistence economy so it underestimates the total amount produced.
SUMMARY OF GDP LIMITATIONS
Real GDP does not reflect changes in population so it is better to use real GDP per capita.
Real GDP does not show how money is distributed so it ignores income inequality.
Real GDP ignores the type of goods produced and living standards will be lower is there is significant production of goods with negative externalities.
Real GDP does not measure the underground economy so it ignores illegal transactions.
Real GDP does not include the subsistence economy where people produced goods to consume for themselves..
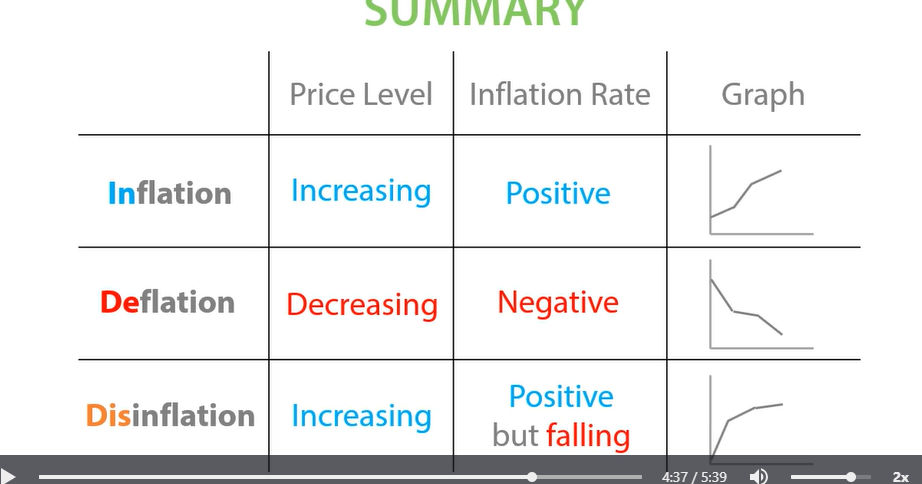
Inflation
Inflation is a sustained increase in the general price level.
Hyperinflation is when inflation rises above 50%
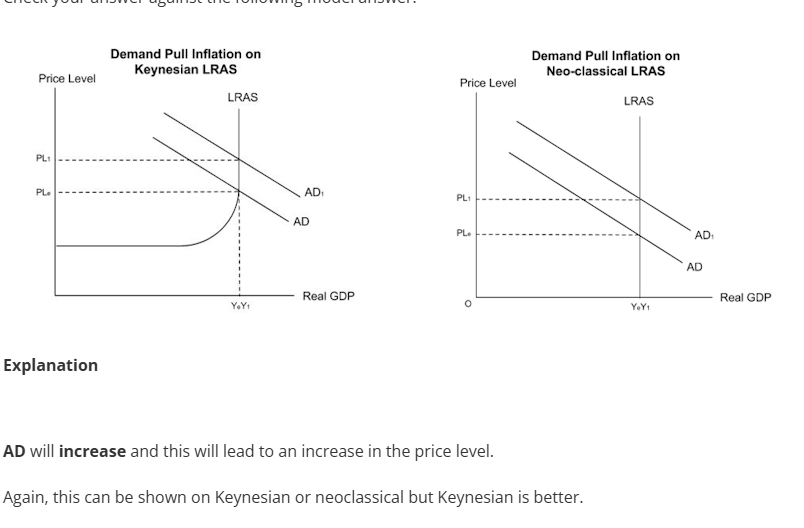
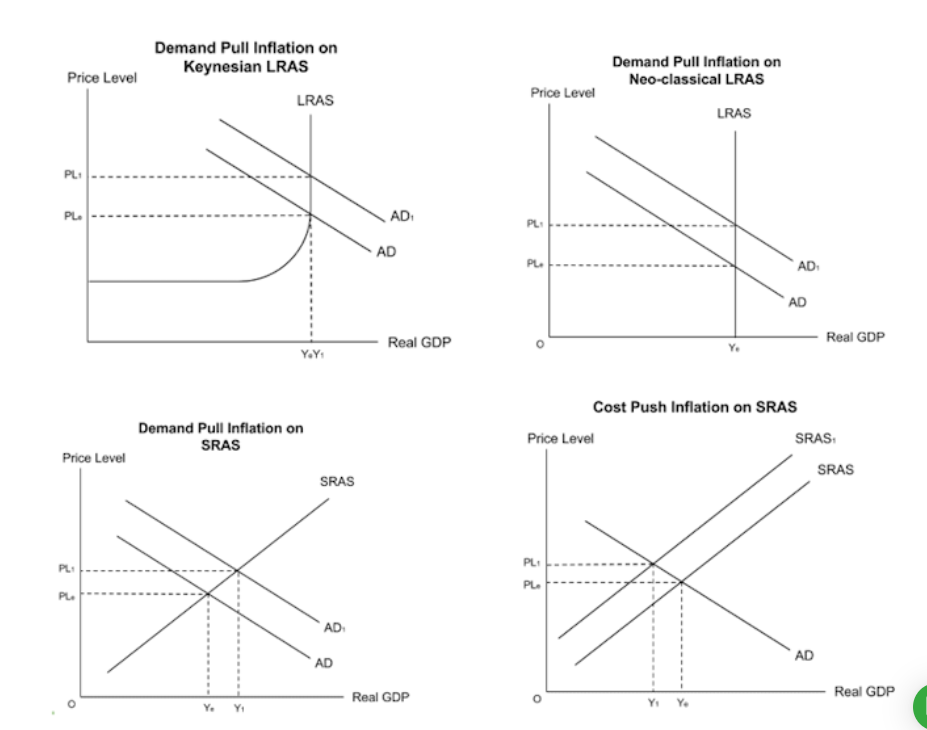
Demand Pull inflation
AD increases, pulling up the price level, leading to inflation.
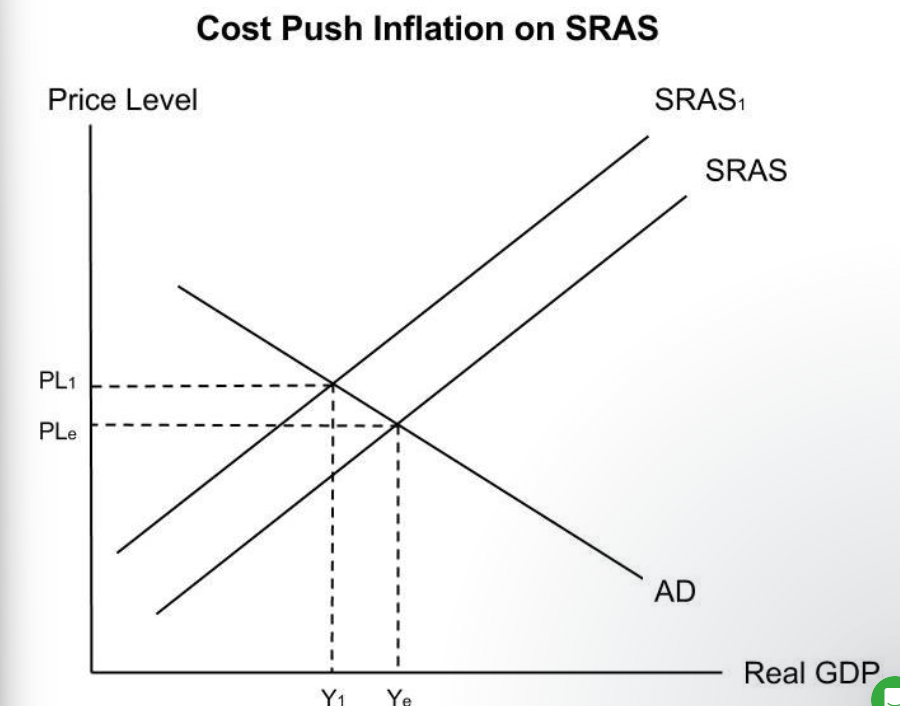
Cost push inflation
Increase in costs, reduces supply.
Higher costs, decrease SRAS, push up price level.
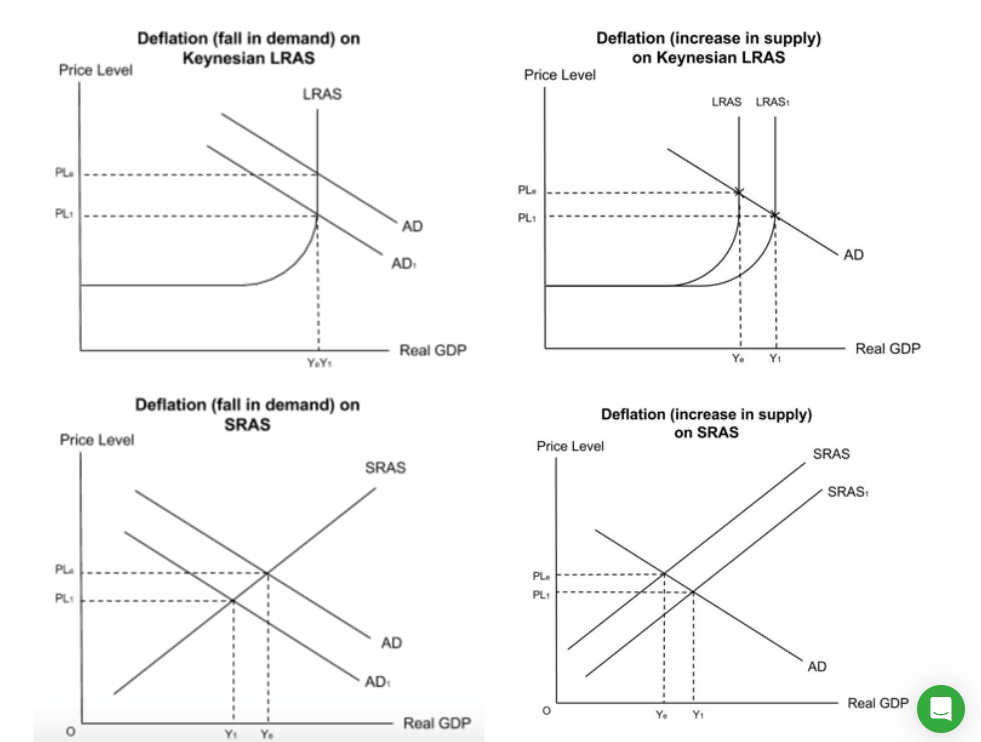
Deflation
Deflationary spiral
When there is a sustained decrease in the general price level.
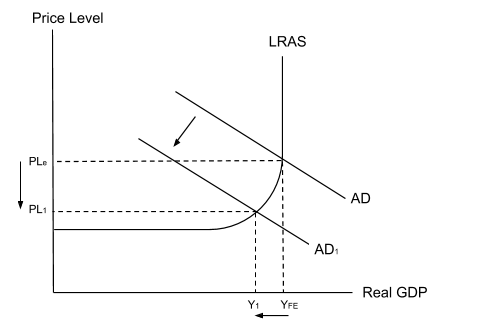
A reduction in business and investor confidence causes a reduction in investment which will reduce AD and shift the AD curve to the left. This leads to a reduction in real GDP and a reduction in the price level.
If consumers notice that prices are falling, they are likely to delay purchasing goods to see if the price will fall further.
If US consumers delay their purchases, current consumption will fall. This will reduce AD as consumption is a component of AD. The AD curve will shift to the left and this will cause a reduction in the price level.
DEFLATIONARY SPIRAL
The spiral begins with deflation which is where there is a sustained fall in the general price level. Consumers notice the falling prices and delay their purchases and wait for the prices to fall further. This causes a reduction in AD as consumption is a component of AD. The fall in AD lowers the price level again and so consumers further delay their purchases.
causes of deflation
deflation can lead to a deflationary spiral which can reduce real GDP.
1929 deflationary spiral, unemployment 25% and real gdp drop “%.
decrease in AD, AD shift in to left price level decrease to PLe to PL1
Increase in AS, decrease price level.(oil prices decrease so firms can produce more), deflation.
Deflation is a sustained decrease in the general price level. It is caused by a reduction in aggregate demand and an increase in aggregate supply.
Inflation/deflation
Value of money
Result of inflation means the value of money decreases.
Deflation is a sustained decrease in the general price level. Deflation means that there is an increase in the value of money.
Inflation decreases the value of money and deflation increases the value of money.
Inflation increases the price level and deflation increases the value of money.
Nominal income is the amount you actually earn. Real income shows how much your income is actually worth in terms of the amount of goods you can produce.
Real income is nominal income with the effects of inflation removed.
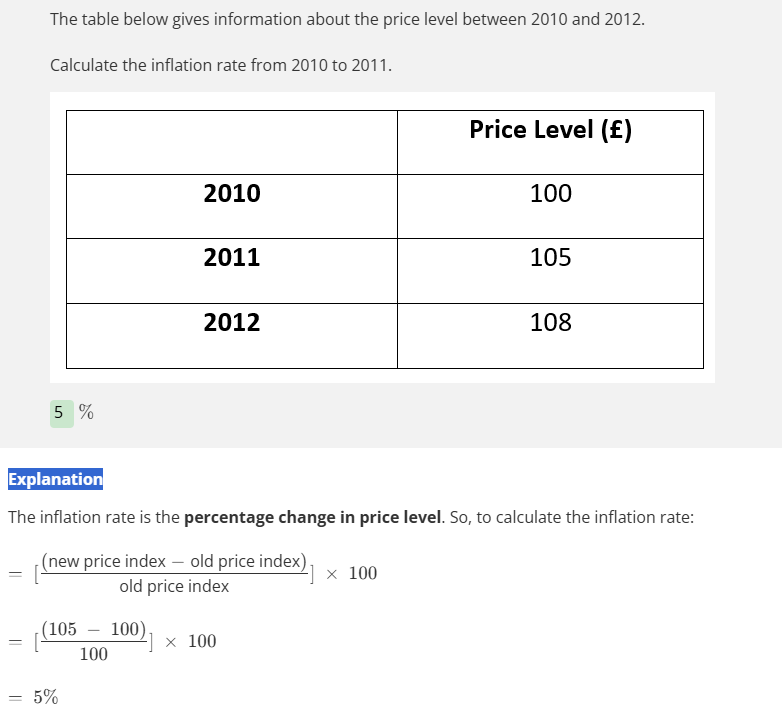
The inflation rate tells us the percentage change in the price level
Inflation rate = change in PL/original price level x 100
-1.98 negative inflation rate, price level is decreasing - deflation
Calculating Price Level: Basket Of Goods
Stage 1- the Office of National Statistics conducts its living costs and food survey. This involves interviewing 7000 households to find the 650 most common goods and services and to find the percentage of their spending goes on each of these goods and services.
Stage 2- the ONS conducts a price survey where they collect prices in order to find the average price of each of 650 most common goods and services.
Step 3- a weighted average of all the prices is calculated in order to find the price level.
Weighted average = %of total spending x price
Consumer price index
current number/base number x 100
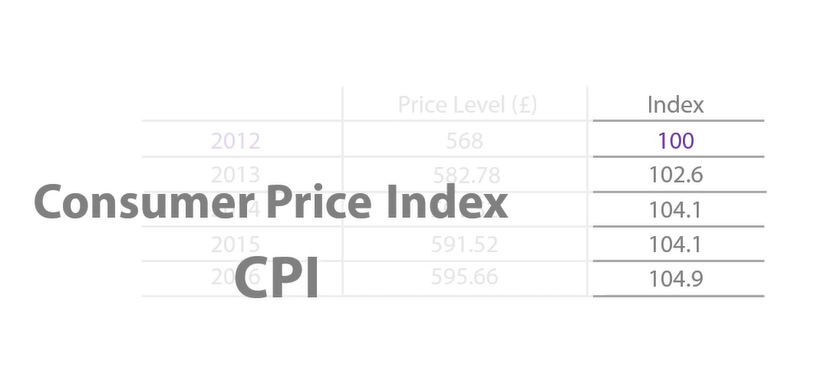
Consumer price index
When converting raw price level data into a consumer price index, we set the base year to a price index of 100.
Disinflation.
Disinflation is when the inflation rate is positive but decreasing. The price level is increasing but by less each time. Deflation occurs whenever the inflation rate is negative, meaning the price level is decreasing.
Problems measuring inflation
Limitations of CPI
The four main problems with CPI as a measure of the cost of living are: unusual spending habits, a time lag, changes in quality and exclusion of mortgage payments.
RPI- Retail price index
Unusual spending habits
For consumers with unusual spending habits, the consumer price index with its most 650 common goods and services will not accurately measure changes in their cost of living. This is because these consumers are buying unusual uncommon goods and services which are not in the CPI basket.
Time Lag
The basket is only updated once a year, so CPI will not reflect price changes for goods which have only just become popular.
Changes in quality
An increase in prices may be due to an improvement in quality and this is not the same as inflation.
Mortgages
A mortgage is an amount of money which is borrowed from the bank in order to buy a house.
It does not include mortgage payments.
Main difference between retail price index and consumer price index
RPI includes mortgage repayments and CPI does not.
Effects of inflation
There are two main measures of changes in the price level: The retail price index and the consumer price index. The RPI includes mortgage payments whereas the CPI excludes them.
Inflation rate= change in CPI/ original CPI x 100.
The main danger of negative inflation is that it may lead to a deflationary spiral. This occurs when consumers see prices falling and choose to delay their purchases. This reduces AD which further reduces the price levels and the cycle continues.
price wage spiral occurs when workers demand higher wages due to inflation.
BENEFIT 1:
High inflation protects against deflation and disinflationary spirals.
However, there will be a price wage spiral. prices increase, cost of living increase, workers will negotiate higher wages so nominal income with increase to cover higher cost of living. However if firms begin to pay higher wages, SRAS shifts left and price level increases.
Which means a further increase in the price level will increase the cost of living. Workers will negotiate higher wages. -price wage spiral. This could lead to hyperinflation.
Benefit 2:
Higher inflation leads to reduced debt and reduced inequality.
Inflation is a sustained increase in the general price level. Inflation means that the value of money decreases as each pound can buy fewer goods and services.
Inflation reduces the real value of debt, money you owe is worth less and improve inequality.
However, high inflation can reduce real wages and real savings, increased inequality. Inflation means that goods and services are more expensive so real value of savings will decrease.
Benefit 3-
High inflation, decreases real wages and lowers costs.
Worker earns a fixed wage of £14 an hour. Real wage would decrease and nominal wage stays the same.
Lower real wages means lower real costs for firms.
Inflation helps the government save money on teachers, doctors, nurses, spend more on infrastructure.
However, inflation can lead to uncertainty. Cant predict future prices or future costs, investing is risky as unsure on profit. Saving is a leakage from the circular flow of income model. Decrease investment.
Effects of inflation
The bank of England’s inflation target is for inflation 2%, but they allow for inflation which is within 1% of their target.
An advantage of high inflation is that it protects from deflation and disinflationary spiral.
A second advantage of high inflation is that it reduces the real value of debt.
A disadvantage of high inflation is that it can lead to price wage spiral/inflation.
A second disadvantage of high inflation is that it can lead to a decrease in real wages and savings which can worsen inequality.
A first advantage of high inflation is that it protects against deflation and deflationary spiral. It reduces the real value of debt and improves inequality. It reduces real wages which can lower costs for firms and the government.
The first disadvantage is that it can lead to price-wage spirals, lead to hyperinflation. It can decrease the real value of wages and savings. A third disadvantage is that it can create high, unstable inflation which can reduce investment and becomes risky.
Unemployment
Economically active, economically inactive.
Employment rate= employment level/working age population x 100
unemployment rate - unemployment level/ active population x 100
Activity rate= active population/ working age population x 100
Unemployed-
The working age population includes everyone between the ages of 16 and 64.
Active population: People who are able to work, actively seeking work or actively working. Physically and mentally able to work.
Inactive population- people of working age aren’t able to work and not actively seeking work.
Unemployment is when someone is able to work and is actively seeking work but is not working.
Unemployment rate is the percentage of people unemployed out of the active population:
Number of unemployed people/ active population x 100 = unemployment rate %
Employment rate = number of employed people/ total working age population x 100. The employment level is just the number of people employed.
Activity/participation rate =
What % of the working age population are actively seeking work or actively working.
The activity rate is also known as the participation rate. It is calculated by taking the active population/ working age population x 100.
Why might employment fall? number of the employed people % of the working age population
A decrease in the number of employed people or an increase in the working age population.
Why might unemployment rate fall? % of the economically active population.
A decrease in the number of unemployed people or an increase in the economically active population.
Measuring unemployment
ILO Labour Force Survey
The Claimant Count
ILO Labour force Survey
The International Labour Organisation’s labour force survey 80 000 households every quarter whether anyone in the household has been out of work for 4 weeks and ready to start work within the next 2 weeks. Someone who meets these criteria counted as unemployed. - can estimate unemployment rate and level for whole of UK.
However, only surveys 80,000 households, not an accurate estimate of unemployment across the UK, ILO is limited.
Claimant count:
The second measure of unemployment is the Claimant Count. This measures how many people are claiming unemployment benefits.
However, not everyone unemployed will claim benefits. Perhaps embarrassment, or if your partner is high income earner not allowed to claim benefits. It will underestimate unemployment.
The first measure of unemployment is the Labour Force Survey which is conducted by the ILO. The second measure of unemployment is the Claimant Count.
Unemployment is when someone is able to work and actively seeking work/looking for work but not actively working.
Underemployment-
Underemployment is when workers are employed but working fewer hours than they want or underusing their skills.
Types of Unemployment
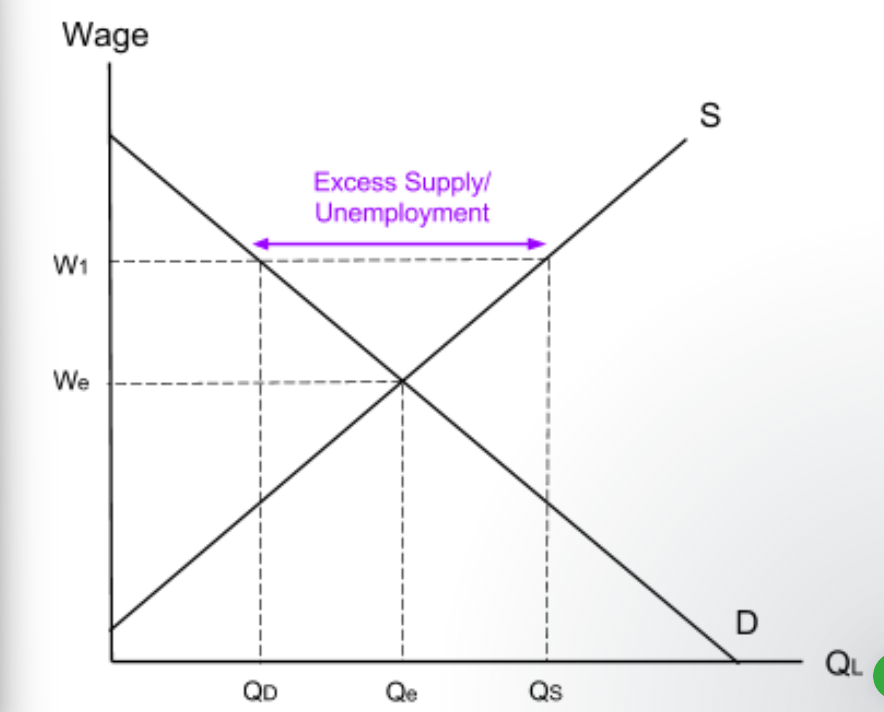
Real wage unemployment / classical unemployment
Demand deficient unemployment.
Real wage unemployment is when the wage is above equilibrium. This means that there is a high supply of labour but low demand for it. This creates excess supply of labour, this is known as unemployment.
If the government sets a national minimum wage above the equilibrium then it will be illegal for firms to pay workers less than this wage. The wage will remain stuck at W1, where there is more labour supply than labour demand.
Wage can be pushed up because of trade unions.
Demand-deficient unemployment.
2008 recession reduce demand for goods and services, firms reduce their production, less workers required, reduce derived demand for labour.
Type of unemployment
Demand deficient unemployment. /cyclical unemployment
Reduction in demand for goods and services, firms reduce their production, less workers required, reduced derived demand for labour. Unemployment will be between Y1 to YFE,.
SUMMARY:
Demand deficient unemployment is also known as cyclical unemployment. It occurs when there is not enough demand in the economy. This causes firms to reduce their derived demand for labour, creating unemployment.
Type of unemployment
Structural unemployment.
Frictional unemployment
Seasonal unemployment
Structural unemployment occurs when the structure of the economy changes and jobs shift from one sector to another.
Occupational Immobility- When workers can’t move between different jobs because they lack the skills needed- lead to structural unemployment. Government can intervene into this with education, training and apprenticeship schemes to teach them new skills.
Geographical immobility- when workers struggle to move between different areas. Can intervene by improving transport, relocation subsidies (help cover the cost of moving)
Frictional unemployment - temporal unemployment whilst job searching.
Seasonal unemployment- Employment is seasonal.
Balance of payments
The balance of payments is a record of payments between one country and the rest of the world.
The first section of balance of payments is the Current Account. The second section is the Capital and Financial Account.
4 parts of the current account:
1 Trade in Goods.
2 Trade in Services
3 Investment Income
4 Current Transfers.
Trade in Goods and services
Impact of an increase in imports on the UK current account: current account decreases due to an increase in withdrawals. Impact of an increase in exports on UK current account increases due to increase in injections.
Investment Income
Investment income earned by a UK investor abroad will appear in the current account as a positive transaction because money is entering the UK. This will increase the current account.
When investment income is paid by UK companies to foreign investors, it will appear as a negative number on the UK current account, which will decrease.
Current transfers:
When UK workers transfer money into the UK from abroad, it will appear as a positive transaction on the current account because money is entering the circular flow.
Remittance- money transferred back home from relatives working abroad.
Current transfers are when money is transferred abroad without getting any goods or services back in exchange. Common examples are aid which is sent abroad and workers wages which are sent back home called remittances.
Current account deficit- more money is leaving the UK than entering the UK.
Current account surplus- More money is entering the economy than leaving it.
Current account equilibrium- total inflow= total outflow
The Capital and Financial Account is part of the Balance of Payments and tracks investments into and out of the country.
The Current Account deficit is balanced by a Capital and Financial Account surplus. Current Account is in equilibrium when the value of capital and financial account is 0.
Current account deficit- outflows are greater than inflows and so its a negative number.
Current Account surplus- inflows are greater than outflows so its a positive number.
Balance of payments
Current Account Macroeconomic objective
Which of the follow shows the UK’s balance of payments?
A current account deficit and a capital and financial account surplus.
The UKs 4th macroeconomic objective is a current account equilibrium.
Explain why the UK government would want to reduce the Current Account deficit and reach equilibrium.
A current account deficit always need to be balanced by a Capital and Financial Account Surplus. A capital and Financial account surplus means that foreign investors are investing in UK assets such as buying shares or property. Any profit from these investments will then be sent overseas to those foreign investors meaning that even more money is withdrawn from the UK economy. By reducing a Current Account deficit, the Capital and Financial Account surplus will be smaller. This means that there will be less foreign investment and so less future earnings leaking out of the economy.
Balance of payments
Factors Affecting the Current Account
Exchange rates
State of the world economy e.g. relative inflation and costs.
Costs
Quality
Income
Degree of protectionism
2 main parts of Balance of payments:
-current account and the capital and financial account.
When a country’s current account is positive, it has a current account surplus. This means that more money is entering the economy than leaving it.
Exchange rates:
If UK pound appreciates, UK imports will get cheaper and exports will get more expensive. Import expenditure will increase and export revenue will decrease. This will worsen the UK current account.
If UK pound depreciates, imports will get more expensive and exports will get cheaper. Import expenditure decreases, export revenue increases. This means that current account will improve.
Relative inflation:
If a country’s inflation rate is relatively lower to other countries, its exports will become relatively cheaper, so foreign consumers will buy more of its exports. This means that export revenue will increase, which will improve the current account.
Costs
If production costs in the UK are higher. UK exports will need to increase their prices. This makes UK exports more expensive and demand for them will fall. This will decrease export revenue which will decrease the UK Current Account.
If a country has lower production costs, its export prices will decrease. This will increase foreign consumers demand for its exports, which will increase its export revenue. This will increase its current account.
EXPORTS WILL GET CHEAPER IS A COUNTRY HAS LOWER RELATIVE INFLATION RATE, DEPRECIATION IN EXCHANGE RATE OR LOWER PRODUCTION COSTS.
Quality
A country which produces lower quality exports will sell fewer exports, which will cause export revenue to decrease. This will then decrease the current account.
Income
If national income increases, consumers import more normal goods and the current account decreases. withdrawal from our economy.
As consumers import more normal goods, import expenditure will increase, which means the current account will decrease.
Protectionism
A tariff is a tax on imports and so tariff will increase the price of imports. This will then reduce demand for imports and decrease import expenditure. This will improve the current account.
The introduction of protectionist measures like tariffs will increase the price of imports, causing consumers to switch from imports to domestic goods. This will lead to a decrease in import expenditure and improve the country’s current account.